CHEEMS vs QNT: Meme Coin'lar ve Kurumsal Blockchain Çözümlerinin Karşılaşması


Giriş: CHEEMS ve QNT Yatırım Karşılaştırması
Kripto para piyasasında CHEEMS ile QNT kıyaslaması, yatırımcıların gündeminde öne çıkan bir başlıktır. İki varlık, piyasa değeri sıralaması, uygulama alanları ve fiyat performansı açısından belirgin farklılıklar gösterirken, kripto varlık ekosisteminde özgün konumlara sahiptir.
CHEEMS (CHEEMS): Lansmanından beri, kripto piyasasında direnç sembolü olarak öne çıkmıştır ve piyasa tarafından kabul görmüştür.
QNT (QNT): 2018’deki çıkışından bu yana, güvenli dijital etkileşim sağlama vizyonuyla teknoloji sağlayıcısı olarak öne çıkmış, kurumsal inovasyon ve blokzincir benimsemesinde lider çözümlerden biri olmuştur.
Bu makalede, CHEEMS ve QNT’nin yatırım değerleri; geçmiş fiyat hareketleri, arz mekanizması, kurumsal benimseme, teknolojik ekosistemler ve gelecek öngörüleri üzerinden kapsamlı bir biçimde analiz edilecek ve yatırımcıların en çok merak ettiği şu soruya yanıt aranacaktır:
"Şu anda hangisi daha avantajlı bir alım?"
I. Fiyat Geçmişi Karşılaştırması ve Güncel Piyasa Durumu
CHEEMS (Coin A) ve QNT (Coin B) Geçmiş Fiyat Trendleri
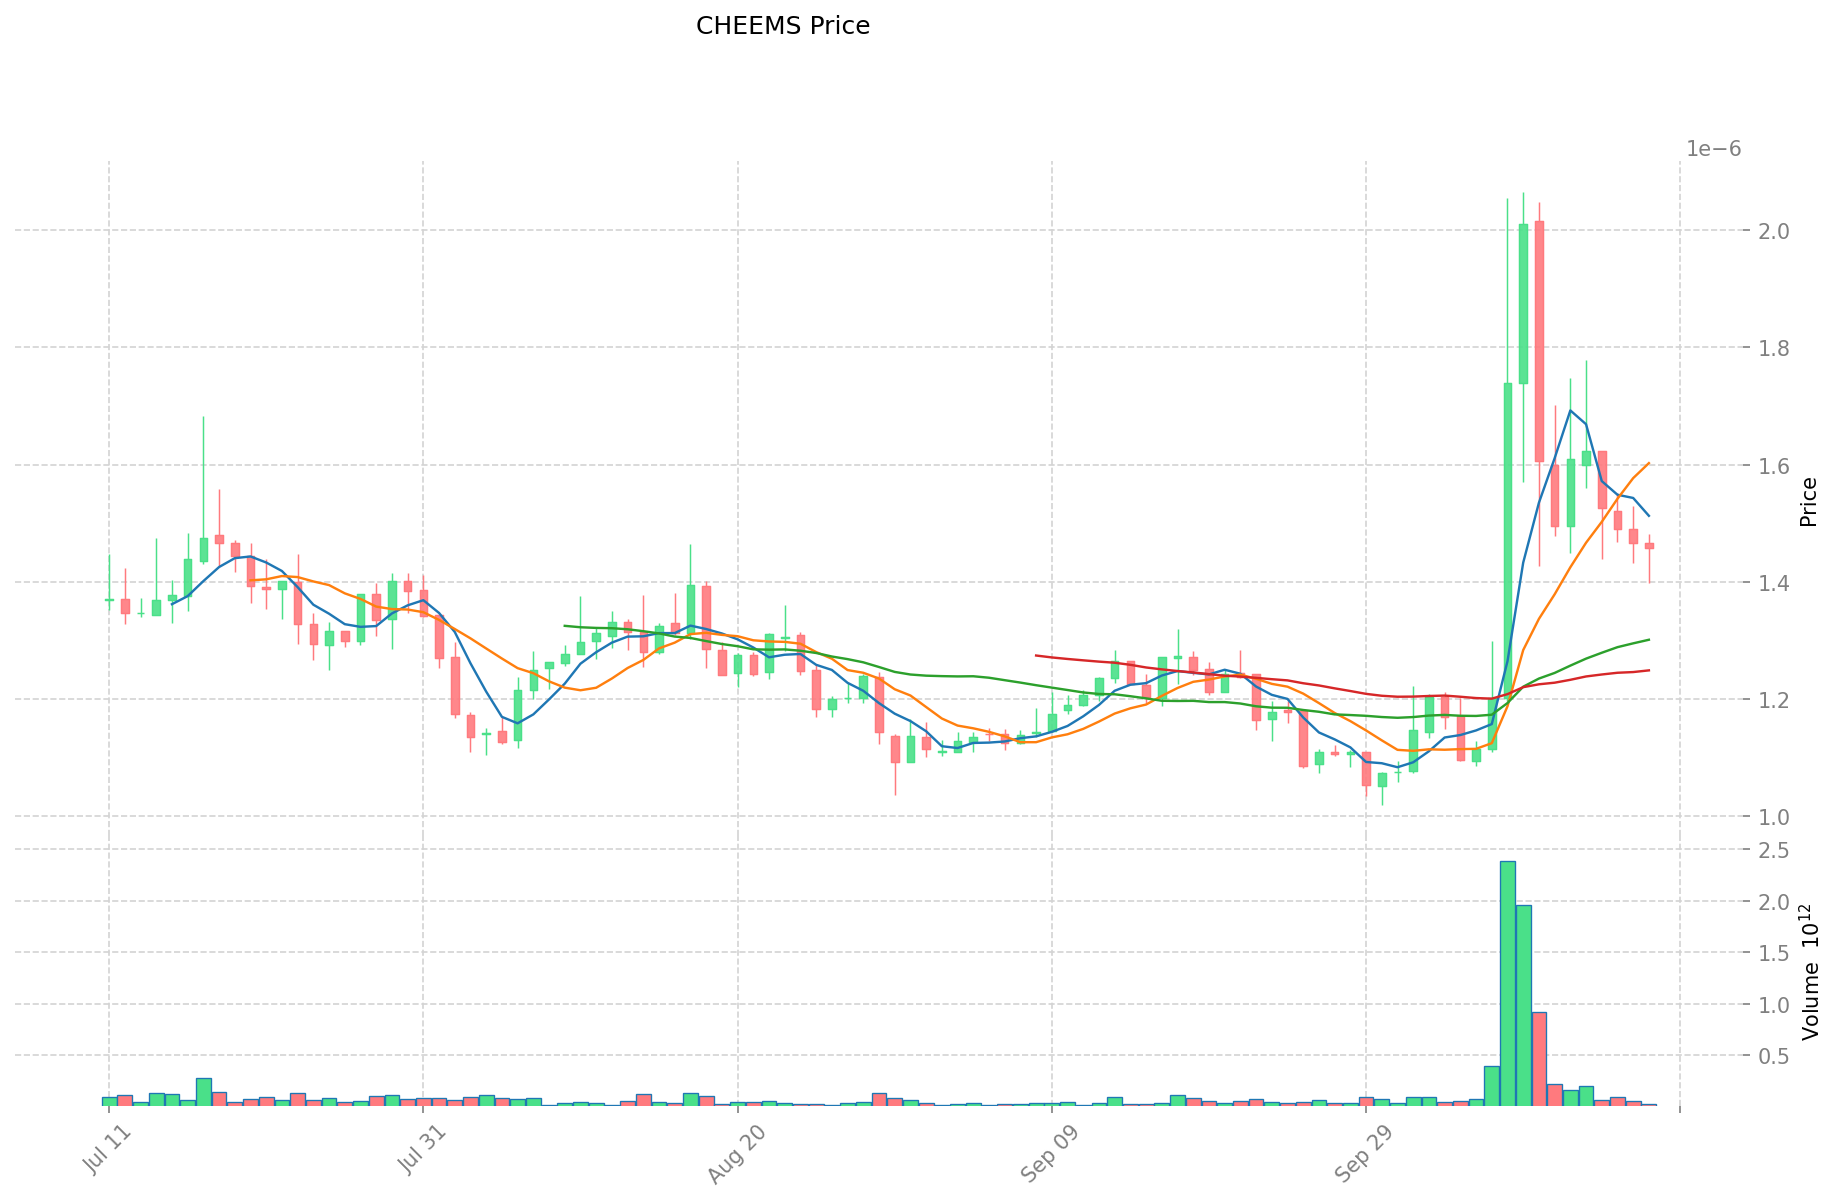
- 2024: CHEEMS, 25 Ekim 2024’te $0,000000115 ile en düşük seviyeye geriledi.
- 2025: CHEEMS, 25 Mart 2025’te $0,0000021763 ile en yüksek seviyeye çıkarak büyük bir sıçrama yaşadı.
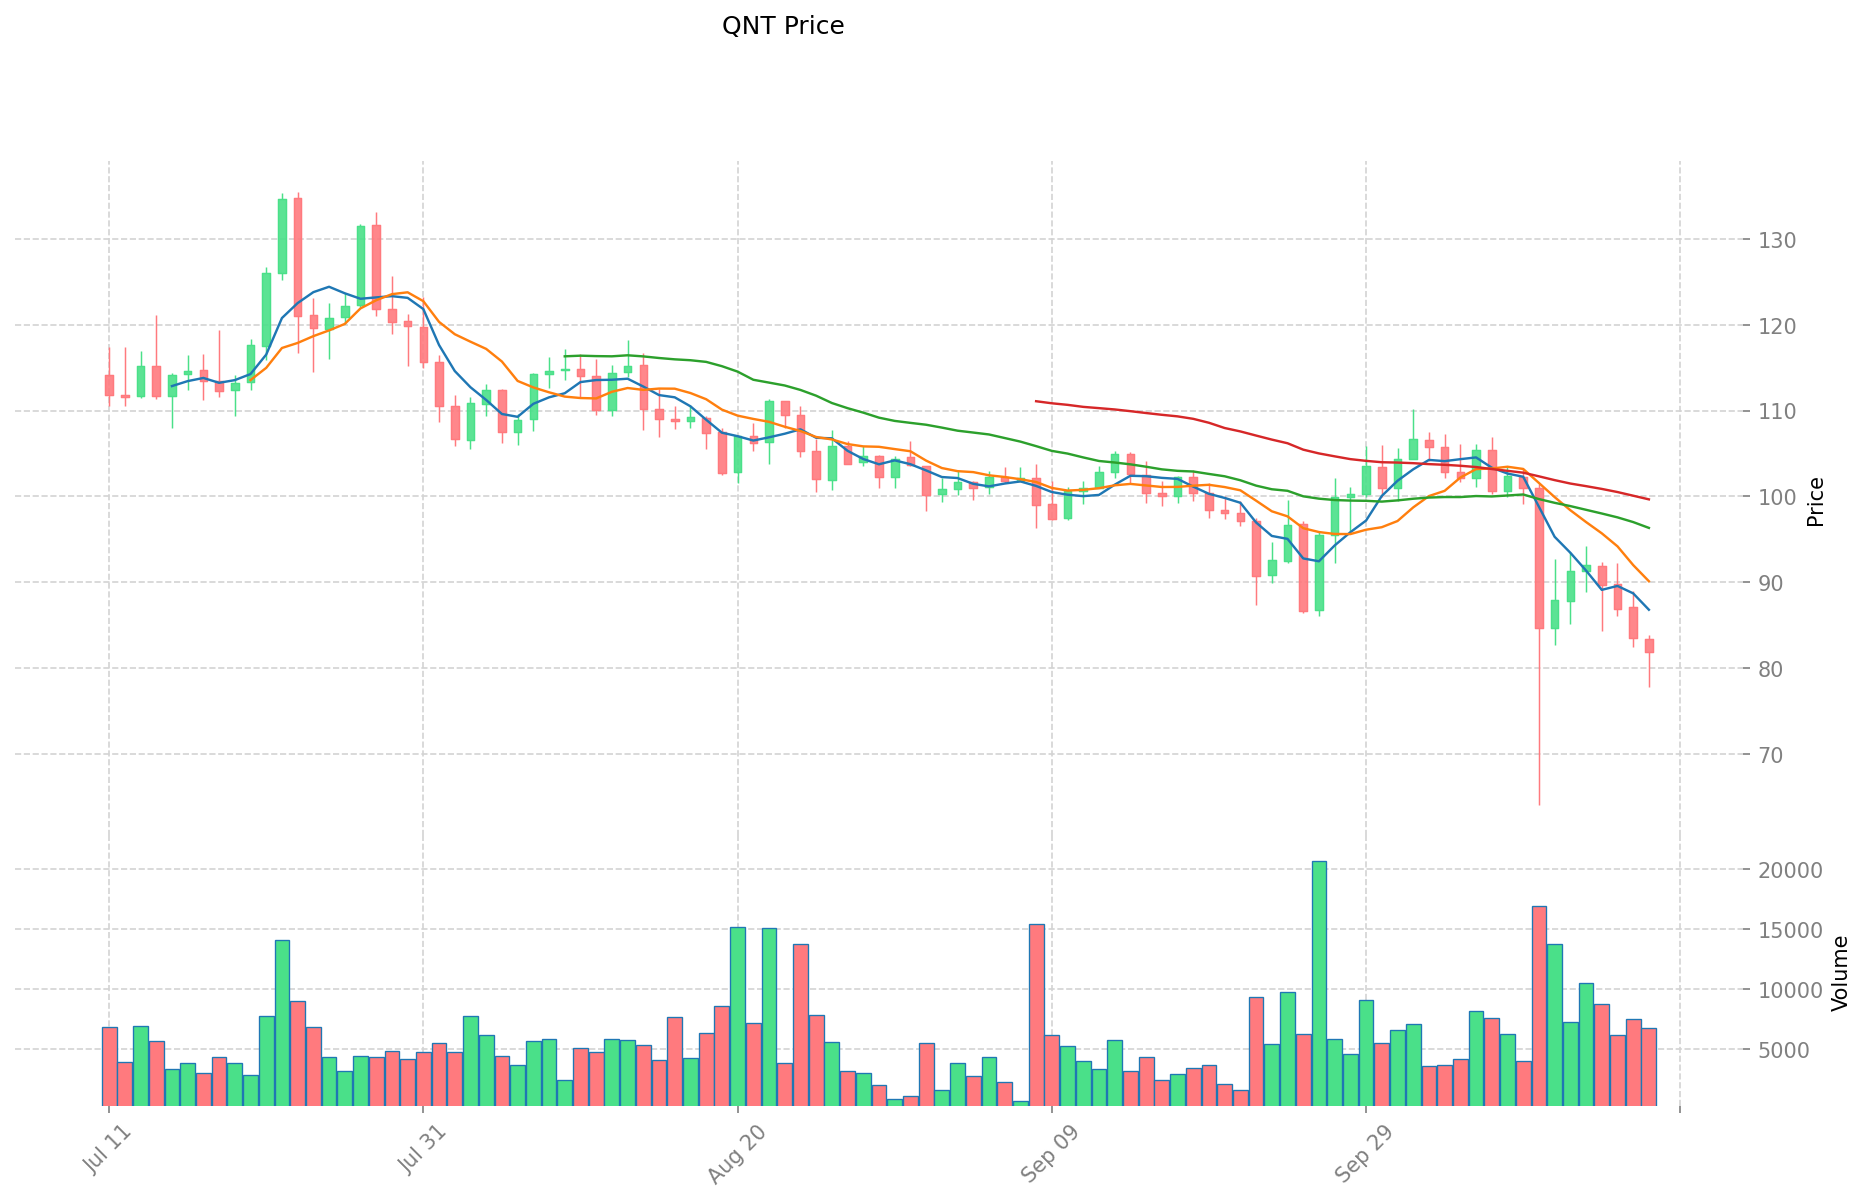
- 2021: QNT, 11 Eylül 2021’de $427,42 ile zirveye ulaştı.
- 2018: QNT, 23 Ağustos 2018’de $0,215773 ile taban fiyatına indi.
- Kıyaslama: Son bir yılda CHEEMS %375,23 oranında dikkat çekici bir büyüme gösterirken, QNT %23,49 ile daha ılımlı bir artış yaşadı.
Güncel Piyasa Durumu (18 Ekim 2025)
- CHEEMS güncel fiyatı: $0,0000014586
- QNT güncel fiyatı: $81,75
- 24 saatlik işlem hacmi: CHEEMS $31.043,37 — QNT $543.145,85
- Piyasa Duyarlılık Endeksi (Korku & Açgözlülük): 22 (Aşırı Korku)
Gerçek zamanlı fiyatları görmek için tıklayın:
- CHEEMS güncel fiyatı Piyasa Fiyatı
- QNT güncel fiyatı Piyasa Fiyatı
II. CHEEMS ve QNT Yatırım Değerini Etkileyen Temel Faktörler
Arz Mekanizması Karşılaştırması (Tokenomik)
- CHEEMS: 69.000.000.000 sabit arz, işlemler sırasında token yakımı ile deflasyonist bir mekanizma
- QNT: 14.612.493 sınırlı arz, yeni ihraç planlanmıyor, kıt varlık modeli sunuyor
- 📌 Tarihsel eğilim: QNT gibi sınırlı arzlı kripto paralar zamanla daha az seyrelme baskısı görürken, CHEEMS’in yakım mekanizması işlem hacmi arttıkça deflasyonist bir etki oluşturabilir.
Kurumsal Benimseme ve Piyasa Uygulamaları
- Kurumsal Portföyler: QNT, Overledger platformu ve kurumsal çözümleriyle daha fazla kurumsal kabul gördü
- Kurumsal Kullanım: QNT, büyük finansal kurumlarla ortaklıklar kurarak birlikte çalışabilirlik çözümleri sunarken, CHEEMS bireysel yatırım alanında yer alıyor
- Düzenleyici Yaklaşım: QNT, kurumsal blokzincir çözümü olarak regülasyonlara uyumlu konumlanırken, CHEEMS gibi meme coin’ler daha fazla düzenleyici incelemeye tabi olabilir
Teknik Gelişim ve Ekosistem Oluşturma
- CHEEMS: Ethereum üzerinde ERC-20 token olarak geliştirilmiş, Ethereum ekosisteminin güvenliğinden yararlanıyor
- QNT: Farklı blokzincir ağları ve geleneksel sistemler arasında birlikte çalışabilirliği sağlayan Overledger teknolojisi
- Ekosistem Karşılaştırması: QNT, kurumsal blokzincir birlikte çalışabilirliği ve finansal kurum uygulamalarına odaklanırken; CHEEMS sosyal ticaret ve meme coin ekosisteminde faaliyet gösteriyor
Makroekonomik ve Piyasa Döngüleri
- Enflasyonist Ortamlarda Performans: QNT’nin sınırlı arz modeli, enflasyona karşı daha güçlü koruma sunabilir
- Makroekonomik Para Politikası: Faiz artışları, CHEEMS gibi spekülatif varlıkları QNT gibi fayda odaklı tokenlardan daha fazla etkileyebilir
- Jeopolitik Faktörler: QNT’nin birlikte çalışabilirlik ve kurumsal çözümlere odaklanması, dijital varlıkların küresel benimsenmesi ve sınır ötesi ödeme talebi arttıkça avantaj sağlayabilir
III. 2025-2030 Fiyat Tahmini: CHEEMS ve QNT
Kısa Vadeli Tahmin (2025)
- CHEEMS: Temkinli $0,00000096228 - $0,000001458 | İyimser $0,000001458 - $0,00000207036
- QNT: Temkinli $69,5215 - $81,79 | İyimser $81,79 - $90,7869
Orta Vadeli Tahmin (2027)
- CHEEMS, büyüme fazına geçebilir; beklenen fiyat aralığı $0,000001695994443 - $0,000002573232948
- QNT, boğa piyasasına girebilir; beklenen fiyat aralığı $74,596365025 - $147,061405335
- Temel etkenler: Kurumsal sermaye girişi, ETF gelişimi, ekosistem büyümesi
Uzun Vadeli Tahmin (2030)
- CHEEMS: Temel senaryo $0,000003238670988 - $0,000003886405185 | İyimser senaryo $0,000003886405185
- QNT: Temel senaryo $148,9047880810035 - $162,306219008293815 | İyimser senaryo $162,306219008293815
Yasal Uyarı: Bu analiz yalnızca bilgilendirme amaçlıdır, yatırım tavsiyesi değildir. Kripto para piyasaları son derece dalgalı ve öngörülemezdir. Her yatırım kararı öncesinde kendi araştırmanızı yapınız.
CHEEMS:
| Yıl | Tahmini En Yüksek Fiyat | Tahmini Ortalama Fiyat | Tahmini En Düşük Fiyat | Değişim Oranı |
|---|---|---|---|---|
| 2025 | 0,00000207036 | 0,000001458 | 0,00000096228 | 0 |
| 2026 | 0,0000021346578 | 0,00000176418 | 0,0000016583292 | 20 |
| 2027 | 0,000002573232948 | 0,0000019494189 | 0,000001695994443 | 33 |
| 2028 | 0,00000296233696 | 0,000002261325924 | 0,000001741220961 | 55 |
| 2029 | 0,000003865510534 | 0,000002611831442 | 0,000002193938411 | 79 |
| 2030 | 0,000003886405185 | 0,000003238670988 | 0,000003141510858 | 122 |
QNT:
| Yıl | Tahmini En Yüksek Fiyat | Tahmini Ortalama Fiyat | Tahmini En Düşük Fiyat | Değişim Oranı |
|---|---|---|---|---|
| 2025 | 90,7869 | 81,79 | 69,5215 | 0 |
| 2026 | 126,8440215 | 86,28845 | 80,2482585 | 5 |
| 2027 | 147,061405335 | 106,56623575 | 74,596365025 | 30 |
| 2028 | 162,3216902944 | 126,8138205425 | 97,646641817725 | 55 |
| 2029 | 153,241820743557 | 144,56775541845 | 93,9690410219925 | 76 |
| 2030 | 162,306219008293815 | 148,9047880810035 | 102,744303775892415 | 82 |
IV. Yatırım Stratejisi Karşılaştırması: CHEEMS ve QNT
Uzun ve Kısa Vadeli Yatırım Stratejileri
- CHEEMS: Sosyal ticaret ve meme coin potansiyelini değerlendirmek isteyen yatırımcılar için uygundur
- QNT: Kurumsal blokzincir çözümleri ve birlikte çalışabilirlik arayan yatırımcılar için uygundur
Risk Yönetimi ve Varlık Dağılımı
- Temkinli yatırımcılar: CHEEMS %5, QNT %15
- Aggresif yatırımcılar: CHEEMS %15, QNT %30
- Koruma araçları: Stablecoin tahsisi, opsiyonlar, döviz portföyleri
V. Potansiyel Risk Karşılaştırması
Piyasa Riskleri
- CHEEMS: Meme coin doğası ve spekülatif işlemlerden kaynaklı yüksek volatilite
- QNT: Kurumsal blokzincir çözümlerinde piyasa doygunluğu riski
Teknik Riskler
- CHEEMS: Ölçeklenebilirlik ve Ethereum ağında istikrar
- QNT: Merkeziyetçilik ve Overledger teknolojisinde güvenlik açıkları
Düzenleyici Riskler
- Küresel regülasyon politikaları, CHEEMS gibi meme coin’leri ve QNT gibi kurumsal çözümleri farklı şekilde etkileyebilir
VI. Sonuç: Hangisi Daha Avantajlı Alım?
📌 Yatırım Değeri Özeti:
- CHEEMS avantajları: Güçlü topluluk, viral büyüme olasılığı
- QNT avantajları: Kurumsal benimseme, birlikte çalışabilirlik, sınırlı arz
✅ Yatırım Tavsiyesi:
- Yeni yatırımcılar: CHEEMS’e düşük pay ile yüksek risk-yüksek getiri potansiyeli değerlendirebilir
- Deneyimli yatırımcılar: Portföyünde CHEEMS ve QNT’yi dengeler, QNT’ye daha yüksek ağırlık verir
- Kurumsal yatırımcılar: Kurumsal çözümleri ve regülasyon uyumluluğu nedeniyle QNT’ye odaklanır
⚠️ Risk Uyarısı: Kripto para piyasasında volatilite yüksektir. Bu makale yatırım tavsiyesi değildir. None
VII. SSS
S1: CHEEMS ve QNT arasındaki temel farklar nelerdir? C: CHEEMS, Ethereum tabanlı meme coin olup sosyal ticarete odaklanır. QNT ise Overledger teknolojisiyle kurumsal odaklı blokzincir çözümüdür ve birlikte çalışabilirlik sunar. CHEEMS’in arzı büyük ve yakım mekanizmalı iken, QNT 14.612.493 sınırlı arzlıdır.
S2: Son dönemde hangi coin daha iyi fiyat performansı sergiledi? C: Son 1 yılda CHEEMS %375,23 oranında güçlü büyüme gösterirken, QNT %23,49 oranında ılımlı büyüme sergiledi.
S3: CHEEMS ve QNT’nin arz mekanizması nasıl farklılaşıyor? C: CHEEMS, işlemler sırasında token yakımıyla deflasyonist mekanizma sunan 69.000.000.000 sabit arza sahip. QNT ise yeni ihraç olmaksızın 14.612.493 sınırlı arz ile kıt bir varlık modeli oluşturuyor.
S4: Kurumlar için hangi coin daha çok tercih ediliyor? C: QNT, kurumsal çözümleri, finansal kurum iş ortaklıkları ve regülasyon uyumluluğu ile kurumların tercih ettiği bir varlık iken; CHEEMS bireysel yatırımcıların alanında kalıyor.
S5: Her bir coin için başlıca risk faktörleri neler? C: CHEEMS, meme coin olması ve spekülatif işlemler nedeniyle yüksek volatilite riski taşır. QNT’de ise kurumsal blokzincir pazarında doygunluk ve merkeziyetçilik endişesi öne çıkar.
S6: CHEEMS ve QNT’de uzun vadeli fiyat tahminleri nasıl? C: 2030’da CHEEMS’in temel senaryoda $0,000003238670988 - $0,000003886405185 aralığına ulaşması, QNT’nin ise $148,9047880810035 - $162,306219008293815 aralığında olması bekleniyor.
S7: Hangi coin, hangi yatırımcı tipi için daha uygun? C: CHEEMS, sosyal ticaret ve yüksek risk-yüksek getiri arayan yatırımcılar için uygun. QNT ise kurumsal blokzincir odaklı ve istikrarlı büyüme arayanlara hitap eder. Deneyimli yatırımcılar her iki varlığı portföylerinde dengeleyebilir.
Share
Content
Giriş: CHEEMS ve QNT Yatırım Karşılaştırması
I. Fiyat Geçmişi Karşılaştırması ve Güncel Piyasa Durumu
II. CHEEMS ve QNT Yatırım Değerini Etkileyen Temel Faktörler
III. 2025-2030 Fiyat Tahmini: CHEEMS ve QNT
IV. Yatırım Stratejisi Karşılaştırması: CHEEMS ve QNT
V. Potansiyel Risk Karşılaştırması
VI. Sonuç: Hangisi Daha Avantajlı Alım?
VII. SSS
How to Buy Cryptocurrency


Trending Cryptocurrencies


PulseX Fiyat Tahmini: Richard Heart’ın DEX’i Nihayet Uçacak mı?
MEME Coin
Ponzi Şeması nedir? Nasıl Tespit Edilir ve Kaçınılır?

Ben Köpek
Turbo Kripto Fiyatı ve Geleceği

En İyi BNB Chain Meme Coin Listesi: Binance Ekosisteminin Eğlenceli Tarafı
Kripto varlıklarınızı güvence altına almak için özel anahtarları anlamak: Güvenlik önerileri

Ethereum ölçeklenebilirliğini geliştirmek amacıyla Layer 2 çözümlerini keşfetmek

Blockchain Node İşlevselliğini Anlamak: Yeni Başlayanlar İçin Rehber

Taproot teknolojisini destekleyen en güvenli Bitcoin cüzdanları
Ethereum İşlem Maliyetlerinin Yapısını Kavramak ve Bunları Azaltma Yöntemleri