CFG vs BTC: Comparing the Future of Digital Assets and Traditional Cryptocurrencies
Introduction: CFG vs BTC Investment Comparison
In the cryptocurrency market, Centrifuge (CFG) vs Bitcoin (BTC) comparison has always been an unavoidable topic for investors. The two not only have significant differences in market cap ranking, application scenarios, and price performance, but also represent different positioning in the crypto asset space.
Centrifuge (CFG): Since its launch, it has gained market recognition for its decentralized asset financing protocol that connects real-world assets to DeFi.
Bitcoin (BTC): Since its inception in 2008, it has been hailed as "digital gold" and is one of the cryptocurrencies with the highest global trading volume and market capitalization.
This article will comprehensively analyze the investment value comparison between CFG and BTC, focusing on historical price trends, supply mechanisms, institutional adoption, technological ecosystems, and future predictions, attempting to answer the question investors care about most:
"Which is the better buy right now?"
I. Price History Comparison and Current Market Status
CFG and BTC Historical Price Trends
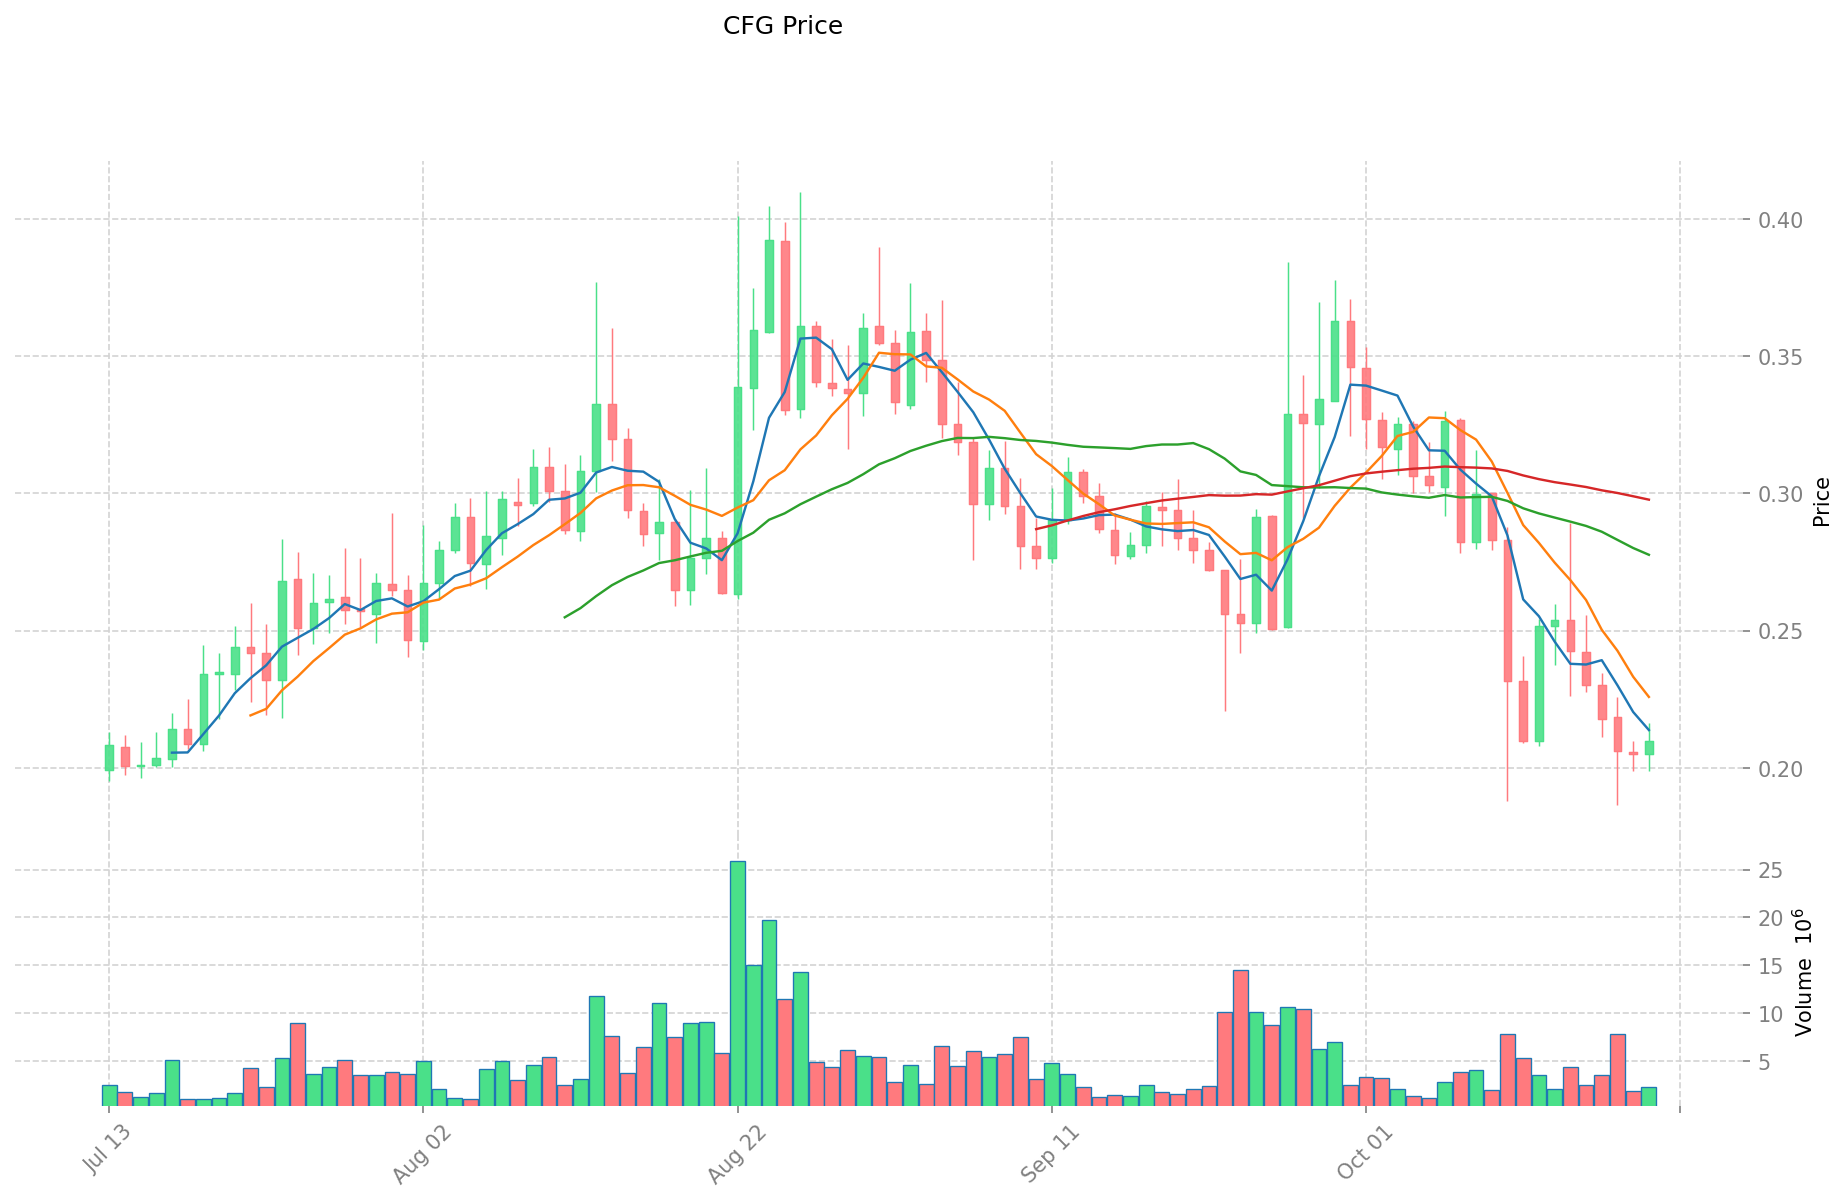
- 2021: CFG reached its all-time high of $2.19 on October 15, 2021.
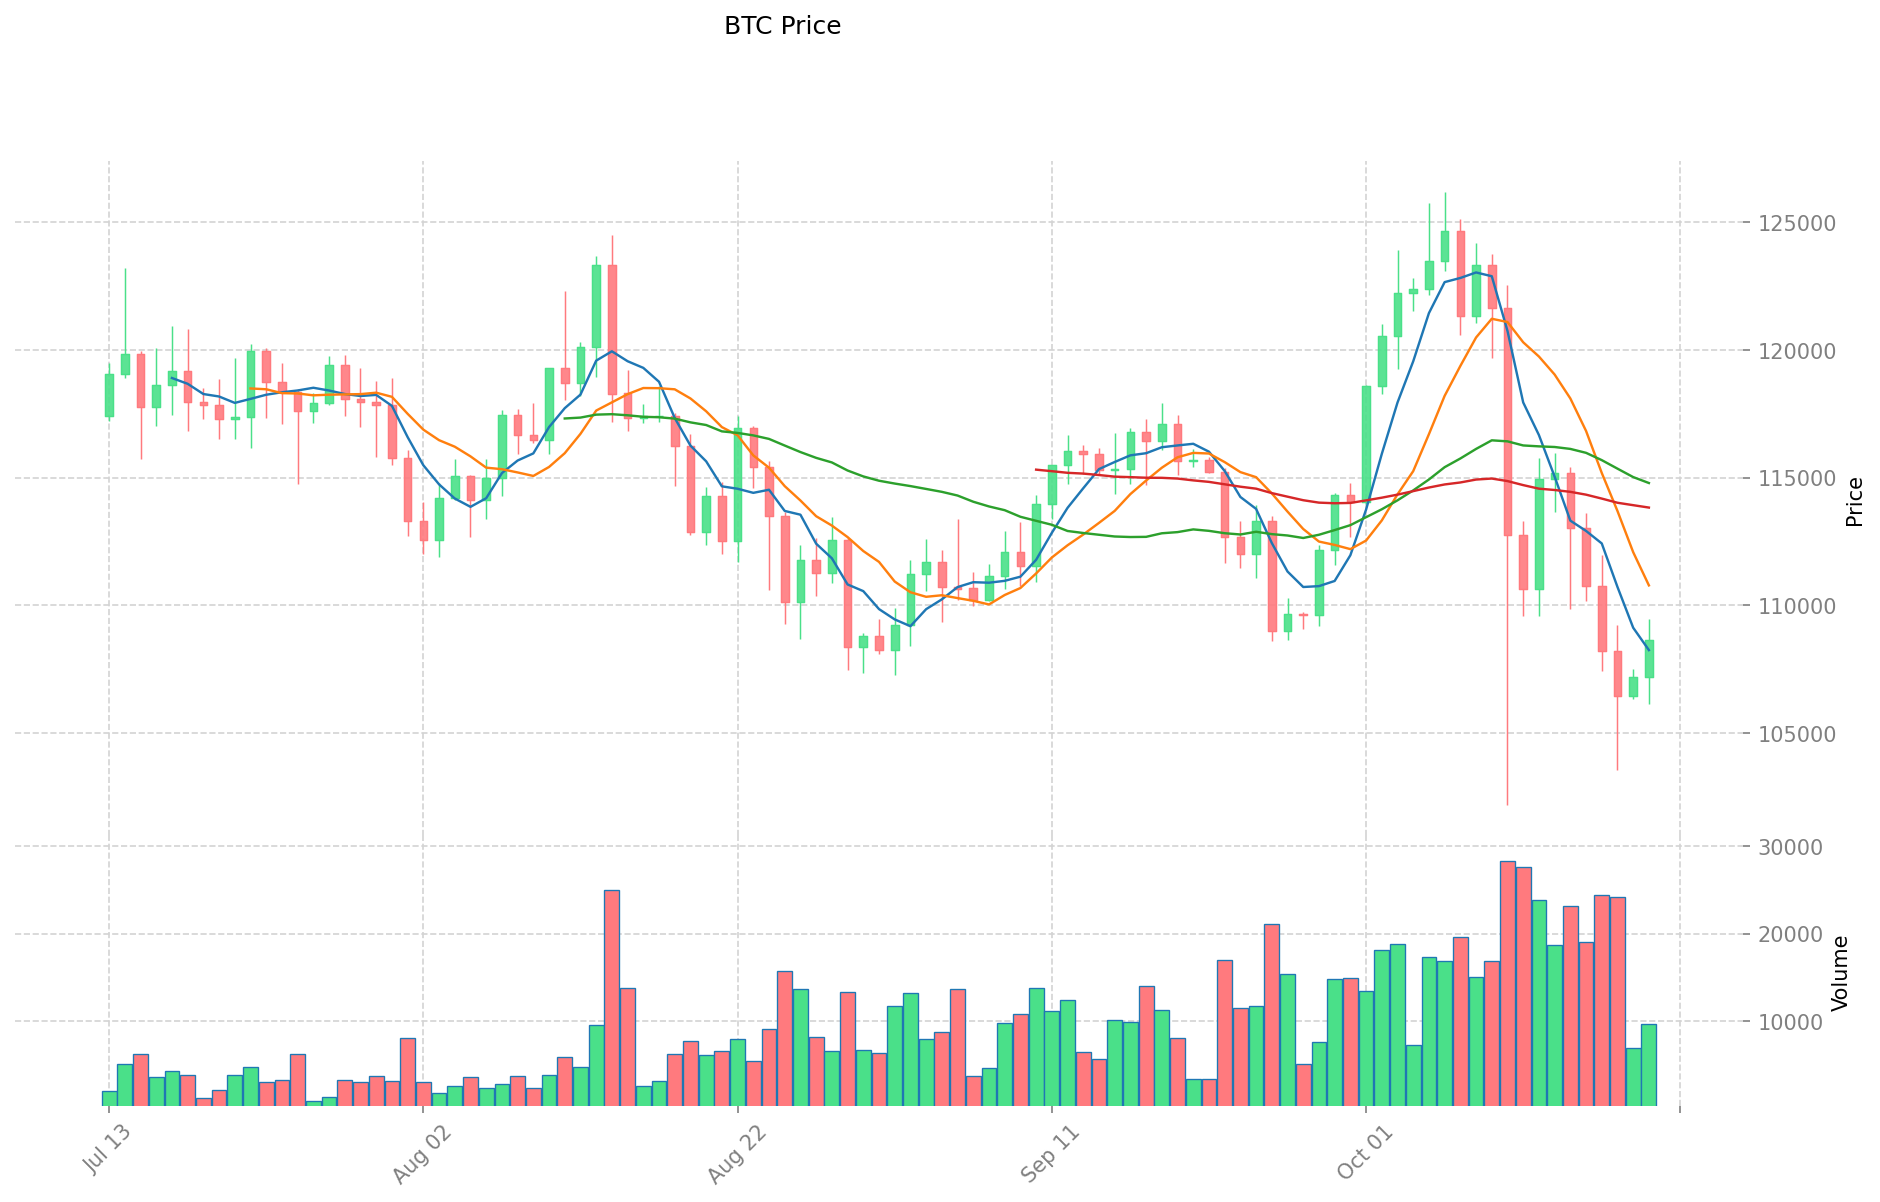
- 2025: BTC achieved a new all-time high of $126,080 on October 7, 2025.
- Comparative analysis: CFG has fallen from its all-time high of $2.19 to its current price of $0.2089, while BTC has shown strong growth, reaching new heights in 2025.
Current Market Situation (2025-10-20)
- CFG current price: $0.2089
- BTC current price: $108,361.6
- 24-hour trading volume: CFG $468,665.01 vs BTC $1,050,599,430.91
- Market Sentiment Index (Fear & Greed Index): 29 (Fear)
Click to view real-time prices:
- View CFG current price Market Price
- View BTC current price Market Price
II. Core Factors Affecting CFG vs BTC Investment Value
Supply Mechanism Comparison (Tokenomics)
-
BTC: Fixed supply cap of 21 million coins with halving mechanism approximately every four years
-
CFG: Total supply of 2 billion tokens with deflationary burning mechanism through transaction fees
-
📌 Historical Pattern: Bitcoin's halving events historically precede bull markets, while CFG's deflationary model aims to create increasing scarcity over time as network activity grows.
Institutional Adoption and Market Applications
- Institutional Holdings: Bitcoin has stronger institutional adoption with major players like MicroStrategy, Tesla, and various ETF providers, while CFG is still in early adoption phases
- Enterprise Adoption: Bitcoin serves primarily as a store of value and investment vehicle, while CFG focuses on powering the Centrifuge ecosystem for real-world asset tokenization
- National Policies: Most jurisdictions have clear regulatory frameworks for Bitcoin, while CFG and other DeFi tokens face varying regulatory uncertainty across different regions
Technology Development and Ecosystem Building
- CFG Technical Upgrades: Focused on real-world asset tokenization infrastructure, enabling businesses to finance receivables, real estate, and other physical assets on-chain
- BTC Technical Development: Lightning Network development for improved scalability and transaction speeds, with continuing focus on security and decentralization
- Ecosystem Comparison: BTC has limited smart contract capabilities but strong store of value properties, while CFG powers a specific DeFi ecosystem focused on bringing real-world assets into DeFi
Macroeconomic Factors and Market Cycles
- Performance in Inflationary Environments: Bitcoin has gained recognition as an inflation hedge due to its fixed supply, while CFG's value is more tied to the adoption of real-world asset tokenization
- Macroeconomic Monetary Policy: Interest rate decisions tend to impact Bitcoin more directly as a macro asset, while CFG may be more affected by regulations around tokenized securities and real-world assets
- Geopolitical Factors: Bitcoin benefits from global uncertainty as a borderless asset, while CFG's success depends more on regulatory clarity for tokenized real-world assets
III. 2025-2030 Price Prediction: CFG vs BTC
Short-term Prediction (2025)
- CFG: Conservative $0.179482 - $0.2087 | Optimistic $0.2087 - $0.258788
- BTC: Conservative $90,788.46 - $108,081.5 | Optimistic $108,081.5 - $141,586.765
Mid-term Prediction (2027)
- CFG may enter a growth phase, with prices expected in the range of $0.1504259512 - $0.3181138968
- BTC may enter a bullish market, with prices expected in the range of $73,770.730600875 - $193,474.180255125
- Key drivers: Institutional capital inflow, ETF, ecosystem development
Long-term Prediction (2030)
- CFG: Base scenario $0.3245692662058 - $0.386237426784902 | Optimistic scenario $0.386237426784902+
- BTC: Base scenario $234,004.341609962240625 - $245,704.558690460352656 | Optimistic scenario $245,704.558690460352656+
Disclaimer: This analysis is for informational purposes only and should not be considered as financial advice. Cryptocurrency markets are highly volatile and unpredictable. Always conduct your own research before making any investment decisions.
CFG:
| 年份 | 预测最高价 | 预测平均价格 | 预测最低价 | 涨跌幅 |
|---|---|---|---|---|
| 2025 | 0.258788 | 0.2087 | 0.179482 | 0 |
| 2026 | 0.25945584 | 0.233744 | 0.12622176 | 11 |
| 2027 | 0.3181138968 | 0.24659992 | 0.1504259512 | 18 |
| 2028 | 0.33882829008 | 0.2823569084 | 0.194826266796 | 35 |
| 2029 | 0.3385459331716 | 0.31059259924 | 0.2919570432856 | 48 |
| 2030 | 0.386237426784902 | 0.3245692662058 | 0.314832188219626 | 55 |
BTC:
| 年份 | 预测最高价 | 预测平均价格 | 预测最低价 | 涨跌幅 |
|---|---|---|---|---|
| 2025 | 141586.765 | 108081.5 | 90788.46 | 0 |
| 2026 | 153545.982975 | 124834.1325 | 76148.820825 | 15 |
| 2027 | 193474.180255125 | 139190.0577375 | 73770.730600875 | 28 |
| 2028 | 209578.46993535375 | 166332.1189963125 | 98135.950207824375 | 53 |
| 2029 | 280053.38875409135625 | 187955.294465833125 | 112773.176679499875 | 73 |
| 2030 | 245704.558690460352656 | 234004.341609962240625 | 126362.344469379609937 | 115 |
IV. Investment Strategy Comparison: CFG vs BTC
Long-term vs Short-term Investment Strategies
- CFG: Suitable for investors focusing on DeFi ecosystems and real-world asset tokenization potential
- BTC: Suitable for investors seeking stability, inflation hedge properties, and institutional adoption
Risk Management and Asset Allocation
- Conservative investors: CFG: 10% vs BTC: 90%
- Aggressive investors: CFG: 30% vs BTC: 70%
- Hedging tools: Stablecoin allocation, options, cross-currency portfolio
V. Potential Risk Comparison
Market Risk
- CFG: Higher volatility due to lower market cap and trading volume
- BTC: Susceptible to macroeconomic factors and regulatory news
Technical Risk
- CFG: Scalability, network stability, smart contract vulnerabilities
- BTC: Mining centralization, potential security vulnerabilities
Regulatory Risk
- Global regulatory policies have different impacts on both, with BTC facing more established frameworks and CFG potentially subject to evolving DeFi regulations
VI. Conclusion: Which Is the Better Buy?
📌 Investment Value Summary:
- CFG advantages: Real-world asset tokenization focus, potential for growth in DeFi ecosystem
- BTC advantages: Established market leader, strong institutional adoption, proven store of value
✅ Investment Advice:
- New investors: Consider a higher allocation to BTC for stability and established track record
- Experienced investors: Diversify with a mix of BTC and CFG based on risk tolerance
- Institutional investors: Focus on BTC for regulatory clarity and established market presence
⚠️ Risk Warning: Cryptocurrency markets are highly volatile. This article does not constitute investment advice. None
VII. FAQ
Q1: What are the main differences between CFG and BTC in terms of investment potential? A: CFG focuses on real-world asset tokenization in DeFi, offering potential growth in a specific ecosystem. BTC is an established market leader with strong institutional adoption and serves as a store of value.
Q2: How do the supply mechanisms of CFG and BTC compare? A: BTC has a fixed supply cap of 21 million coins with a halving mechanism every four years. CFG has a total supply of 2 billion tokens with a deflationary burning mechanism through transaction fees.
Q3: Which cryptocurrency is more suitable for long-term investment? A: BTC is generally considered more suitable for long-term investment due to its established market position, institutional adoption, and proven track record as a store of value. However, CFG may offer higher growth potential for investors interested in DeFi and real-world asset tokenization.
Q4: How do institutional adoption rates compare between CFG and BTC? A: BTC has significantly stronger institutional adoption, with major players like MicroStrategy, Tesla, and various ETF providers holding it. CFG is still in early adoption phases, primarily within the DeFi ecosystem.
Q5: What are the key risk factors to consider when investing in CFG vs BTC? A: For CFG, key risks include higher volatility due to lower market cap, technical risks related to scalability and smart contract vulnerabilities, and evolving DeFi regulations. For BTC, risks include susceptibility to macroeconomic factors, potential mining centralization, and established regulatory frameworks that may impact its use.
Q6: How do the price predictions for CFG and BTC compare for 2030? A: By 2030, CFG's base scenario price range is predicted to be $0.3245692662058 - $0.386237426784902, while BTC's base scenario range is $234,004.341609962240625 - $245,704.558690460352656. BTC is expected to show significantly higher absolute price growth.
Q7: What allocation strategy is recommended for investors interested in both CFG and BTC? A: Conservative investors might consider allocating 10% to CFG and 90% to BTC, while more aggressive investors could allocate 30% to CFG and 70% to BTC. The exact allocation should be based on individual risk tolerance and investment goals.
Share
Content