AKT vs SAND: The Battle for Blockchain Supremacy in the Gaming Industry
Introduction: AKT vs SAND Investment Comparison
In the cryptocurrency market, the comparison between Akash Network (AKT) vs The Sandbox (SAND) has been an unavoidable topic for investors. The two not only show significant differences in market cap ranking, application scenarios, and price performance, but also represent different positions in the crypto asset space.
Akash Network (AKT): Since its launch, it has gained market recognition for its decentralized cloud computing marketplace.
The Sandbox (SAND): It has been hailed as a virtual game world since its inception, and is one of the cryptocurrencies with high global trading volume and market capitalization.
This article will comprehensively analyze the investment value comparison between AKT vs SAND, focusing on historical price trends, supply mechanisms, institutional adoption, technical ecosystems, and future predictions, attempting to answer the question investors care about most:
"Which is the better buy right now?"
I. Price History Comparison and Current Market Status
AKT and SAND Historical Price Trends
- 2021: AKT reached its all-time high of $8.07 on April 7, 2021.
- 2021: SAND hit its peak price of $8.4 on November 25, 2021, likely due to the metaverse hype.
- Comparative analysis: During the market cycle, AKT dropped from its high of $8.07 to a low of $0.164994, while SAND declined from $8.4 to $0.02897764.
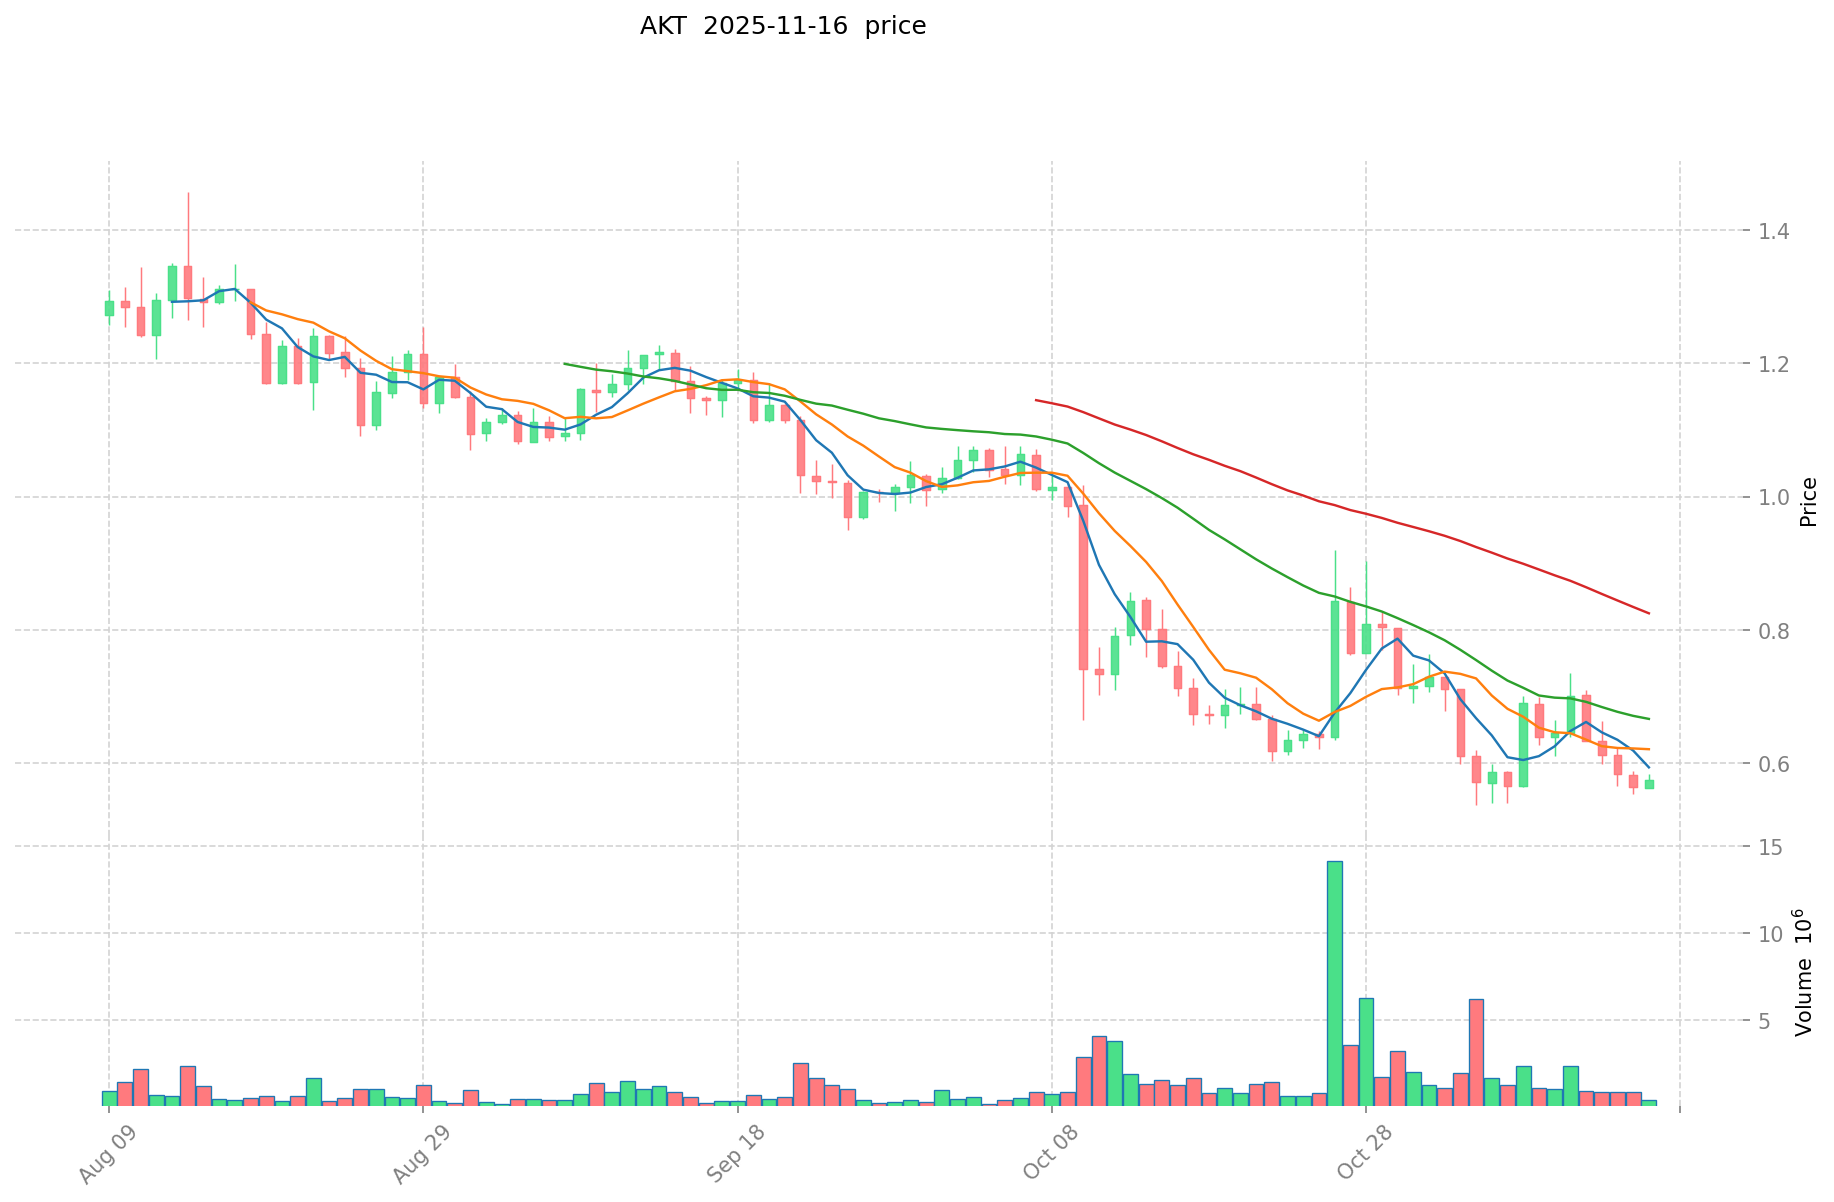
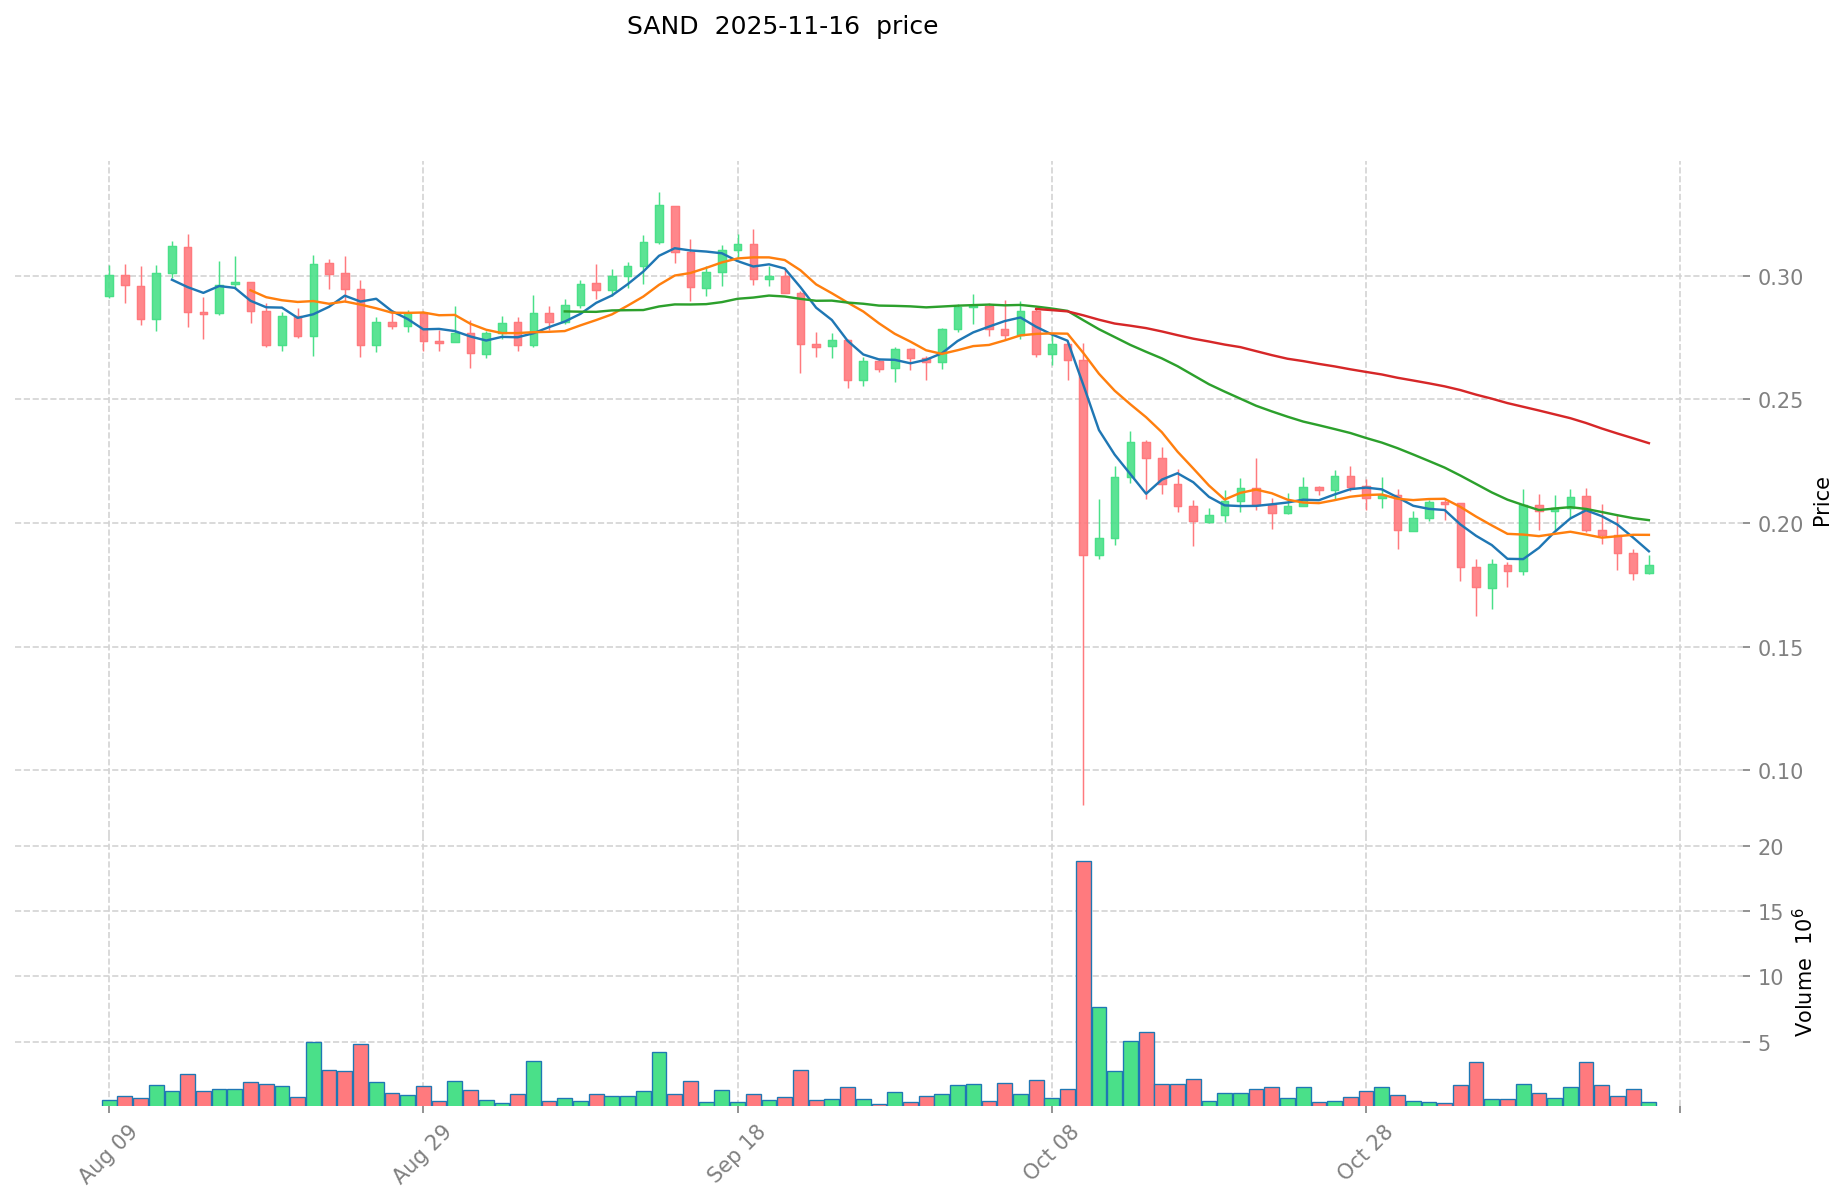
Current Market Situation (2025-11-16)
- AKT current price: $0.5745
- SAND current price: $0.1831
- 24-hour trading volume: AKT $224,989.988482 vs SAND $66,897.982628
- Market Sentiment Index (Fear & Greed Index): 10 (Extreme Fear)
Click to view real-time prices:
- Check AKT current price Market Price
- Check SAND current price Market Price
II. Core Factors Affecting the Investment Value of AKT vs SAND
Supply Mechanism Comparison (Tokenomics)
- AKT: Fixed supply cap of 388,539,008 tokens with inflationary model starting at 10% and reducing over time
- SAND: Maximum supply cap of 3 billion tokens with controlled distribution and deflationary mechanisms through staking and token burning
- 📌 Historical pattern: Deflationary assets like SAND tend to perform better in bull markets, while AKT's inflation schedule affects short-term price action but may stabilize as it matures.
Institutional Adoption and Market Applications
- Institutional holdings: SAND has attracted more institutional interest with investments from SoftBank, Galaxy Interactive, and partnerships with major brands
- Enterprise adoption: AKT focuses on cloud computing infrastructure adoption by Web3 developers, while SAND targets metaverse experiences with brand partnerships like Adidas, Warner Music, and Snoop Dogg
- Regulatory attitudes: Both operate in emerging regulatory frameworks, with SAND potentially facing more scrutiny due to its gaming and NFT focus
Technical Development and Ecosystem Building
- AKT technical upgrades: Mainnet 4.0 "Rhea" introduced provider service billing and resource determination, improving the decentralized cloud marketplace
- SAND technical development: The Sandbox continues to develop its metaverse platform with enhancements to its Game Maker and VoxEdit tools
- Ecosystem comparison: AKT focuses on decentralized computing infrastructure with over 55 validators securing the network, while SAND has built a comprehensive gaming metaverse with over 19,000 LAND owners and numerous brand partnerships
Macroeconomic Factors and Market Cycles
- Performance in inflationary environments: SAND's scarcity model may offer better protection in inflationary periods
- Macroeconomic monetary policy: Both tokens are affected by broader crypto market sentiment related to interest rates and USD strength
- Geopolitical factors: AKT's decentralized cloud services may benefit from increased demand for sovereign computing resources, while SAND depends more on global entertainment sector stability
III. 2025-2030 Price Prediction: AKT vs SAND
Short-term Prediction (2025)
- AKT: Conservative $0.355 - $0.573 | Optimistic $0.573 - $0.826
- SAND: Conservative $0.104 - $0.182 | Optimistic $0.182 - $0.213
Mid-term Prediction (2027)
- AKT may enter a growth phase, with estimated prices between $0.765 - $0.994
- SAND may enter a steady growth phase, with estimated prices between $0.207 - $0.268
- Key drivers: Institutional capital inflow, ETF, ecosystem development
Long-term Prediction (2030)
- AKT: Base scenario $0.959 - $1.257 | Optimistic scenario $1.257+
- SAND: Base scenario $0.363 - $0.439 | Optimistic scenario $0.439+
Disclaimer: This analysis is based on historical data and market projections. Cryptocurrency markets are highly volatile and unpredictable. This information should not be considered as financial advice. Always conduct your own research before making investment decisions.
AKT:
| 年份 | 预测最高价 | 预测平均价格 | 预测最低价 | 涨跌幅 |
|---|---|---|---|---|
| 2025 | 0.825552 | 0.5733 | 0.355446 | 0 |
| 2026 | 1.00017918 | 0.699426 | 0.51058098 | 21 |
| 2027 | 0.9942690303 | 0.84980259 | 0.764822331 | 47 |
| 2028 | 0.9496968844545 | 0.92203581015 | 0.6546454252065 | 60 |
| 2029 | 0.982659664667362 | 0.93586634730225 | 0.63638911616553 | 62 |
| 2030 | 1.256634537840096 | 0.959263005984806 | 0.834558815206781 | 66 |
SAND:
| 年份 | 预测最高价 | 预测平均价格 | 预测最低价 | 涨跌幅 |
|---|---|---|---|---|
| 2025 | 0.213408 | 0.1824 | 0.103968 | 0 |
| 2026 | 0.27310752 | 0.197904 | 0.13259568 | 8 |
| 2027 | 0.2684765664 | 0.23550576 | 0.2072450688 | 28 |
| 2028 | 0.347747805216 | 0.2519911632 | 0.158754432816 | 37 |
| 2029 | 0.42581466757536 | 0.299869484208 | 0.2698825357872 | 63 |
| 2030 | 0.439038911828932 | 0.36284207589168 | 0.235847349329592 | 98 |
IV. Investment Strategy Comparison: AKT vs SAND
Long-term vs Short-term Investment Strategies
- AKT: Suitable for investors focused on decentralized cloud computing potential and Web3 infrastructure growth
- SAND: Suitable for investors interested in metaverse development and gaming industry expansion
Risk Management and Asset Allocation
- Conservative investors: AKT: 30% vs SAND: 70%
- Aggressive investors: AKT: 60% vs SAND: 40%
- Hedging tools: Stablecoin allocation, options, cross-currency portfolios
V. Potential Risk Comparison
Market Risks
- AKT: Volatility due to smaller market cap and lower liquidity
- SAND: Susceptibility to metaverse and gaming industry trends
Technical Risks
- AKT: Network scalability, provider reliability
- SAND: Platform security, smart contract vulnerabilities
Regulatory Risks
- Global regulatory policies may impact SAND more due to its focus on gaming and NFTs
VI. Conclusion: Which Is the Better Buy?
📌 Investment Value Summary:
- AKT advantages: Decentralized cloud computing focus, potential for enterprise adoption
- SAND advantages: Established metaverse presence, strong brand partnerships
✅ Investment Advice:
- New investors: Consider a balanced approach with a slight preference for SAND due to its more established market presence
- Experienced investors: Explore a higher allocation to AKT for potential growth in the decentralized cloud computing sector
- Institutional investors: Evaluate both for different exposure - SAND for metaverse/gaming and AKT for Web3 infrastructure
⚠️ Risk Warning: The cryptocurrency market is highly volatile. This article does not constitute investment advice. None
VII. FAQ
Q1: What are the main differences between AKT and SAND? A: AKT focuses on decentralized cloud computing, while SAND is centered on metaverse and gaming experiences. AKT has a fixed supply cap with an inflationary model, whereas SAND has a maximum supply cap with deflationary mechanisms.
Q2: Which token has shown better price performance historically? A: SAND reached a higher all-time high of $8.4 in November 2021, compared to AKT's peak of $8.07 in April 2021. However, both have experienced significant declines since their peaks.
Q3: How do the future price predictions compare for AKT and SAND? A: By 2030, AKT is predicted to reach $0.959 - $1.257 in the base scenario, while SAND is expected to reach $0.363 - $0.439. AKT shows slightly higher growth potential in these projections.
Q4: What are the key factors affecting the investment value of AKT and SAND? A: Key factors include supply mechanisms, institutional adoption, technical development, ecosystem building, and macroeconomic factors such as inflation and regulatory environments.
Q5: How do the risk profiles of AKT and SAND differ? A: AKT faces risks related to market volatility due to its smaller cap and lower liquidity, as well as technical challenges in network scalability. SAND is more susceptible to metaverse and gaming industry trends and may face greater regulatory scrutiny due to its focus on gaming and NFTs.
Q6: What investment strategies are recommended for AKT and SAND? A: For conservative investors, a portfolio allocation of 30% AKT and 70% SAND is suggested. Aggressive investors might consider 60% AKT and 40% SAND. New investors may prefer a balanced approach with a slight preference for SAND, while experienced investors could explore higher allocations to AKT for potential growth in decentralized cloud computing.
Share
Content
Introduction: AKT vs SAND Investment Comparison
I. Price History Comparison and Current Market Status
II. Core Factors Affecting the Investment Value of AKT vs SAND
III. 2025-2030 Price Prediction: AKT vs SAND
IV. Investment Strategy Comparison: AKT vs SAND
V. Potential Risk Comparison
VI. Conclusion: Which Is the Better Buy?
VII. FAQ

