2025 TAPrice Tahmini: Piyasa Trendleri ve Token Varlıklarının Gelecekteki Değerlemesinin Analizi

Giriş: TA'nın Piyasa Konumu ve Yatırım Potansiyeli
Trusta.AI (TA), yapay zeka ve kripto alanında güvenilir bir kimlik ağı yaratmayı amaçlayan bir proje olarak kuruluşundan bu yana önemli aşamalar kaydetti. 2025 yılı itibarıyla TA'nın piyasa değeri 12.162.600 $’a ulaştı; yaklaşık 180.000.000 adet dolaşımdaki token bulunuyor ve fiyatı 0,06757 $ seviyesinde seyrediyor. “Tüm zeka türleri için evrensel kredi sistemi” olarak tanımlanan bu varlık, insan ile yapay zeka arasındaki güvenin tesisinde giderek kritik hale gelmektedir.
Bu makalede, TA'nın 2025-2030 arası fiyat hareketleri; geçmiş veriler, arz-talep dengesi, ekosistem gelişimi ve makroekonomik koşullar ışığında kapsamlı biçimde incelenecek, yatırımcılar için profesyonel fiyat öngörüleri ve pratik yatırım stratejileri sunulacaktır.
I. TA Fiyat Geçmişi ve Güncel Piyasa Durumu
TA Fiyatının Tarihsel Seyri
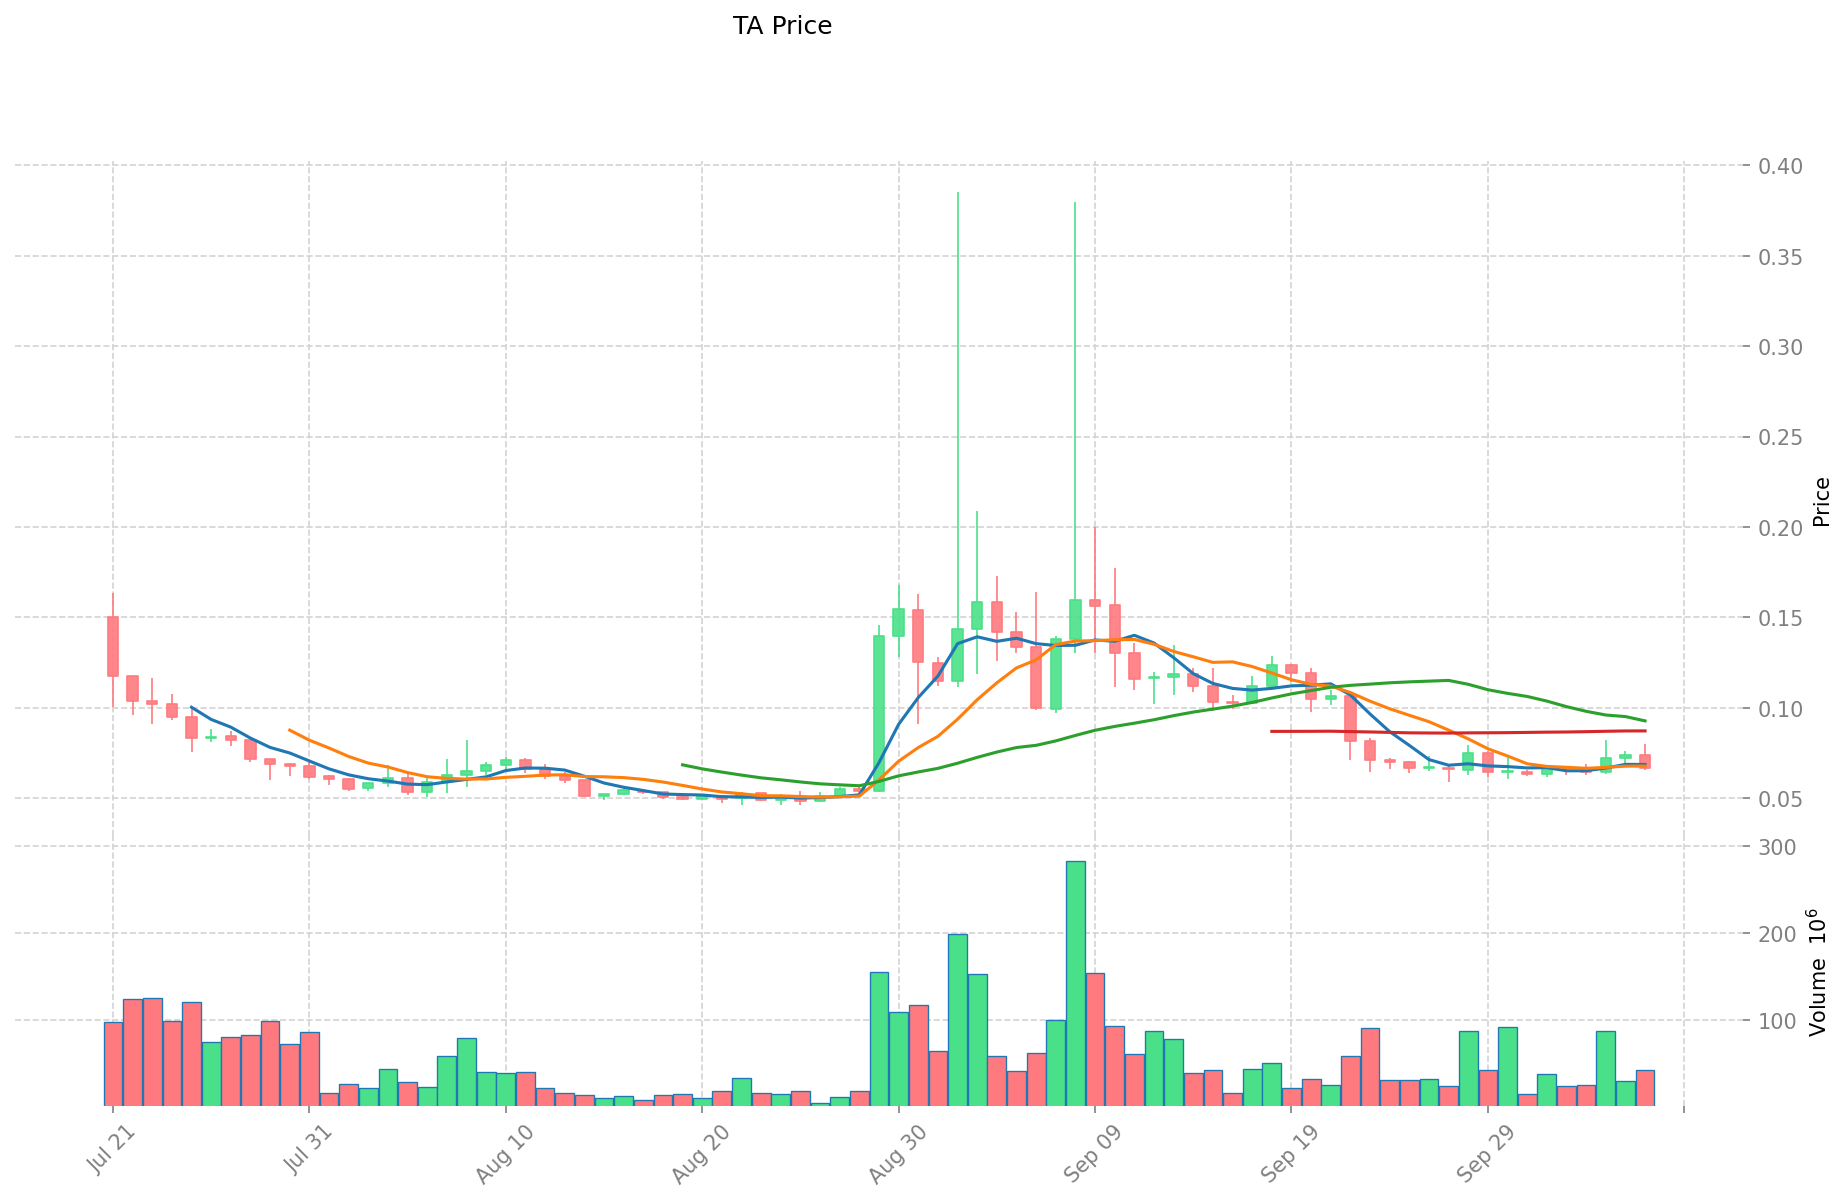
- 2025 Ağustos: İlk listeleme, başlangıç fiyatı 0,1 $
- 2 Eylül 2025: Tüm zamanların zirvesi olan 0,3854 $’a ulaştı
- 2025 Ekim: Fiyat düzeltmesi sonrası güncel işlem fiyatı 0,06757 $
TA Güncel Piyasa Görünümü
TA, 0,06757 $ seviyesinden işlem görüyor ve son 24 saatte %9,36 oranında gerileme yaşadı. Token, 24 saatlik süreçte 0,06551 $ ile 0,07997 $ arasında yüksek oynaklık sergiledi. Son dönemdeki düşüşe rağmen, TA geçtiğimiz hafta %6,23 artışla olumlu bir ivme yakaladı. Ancak, son 30 günlük performans %54,84 oranında ciddi bir azalmaya işaret ederek orta vadede genel bir aşağı yönlü eğilimi gösteriyor.
Mevcut piyasa değeri 12.162.600 $’dır ve dolaşımdaki TA token miktarı 180.000.000’dur. Maksimum arzı 1.000.000.000 olan TA’nın tam seyreltilmiş değerlemesi 67.570.000 $’dır. 24 saatlik işlem hacmi ise 2.938.480,40 $ olup, orta düzeyde piyasa hareketliliği göstermektedir.
Güncel TA piyasa fiyatını görmek için tıklayın
TA Piyasa Duyarlılık Göstergesi
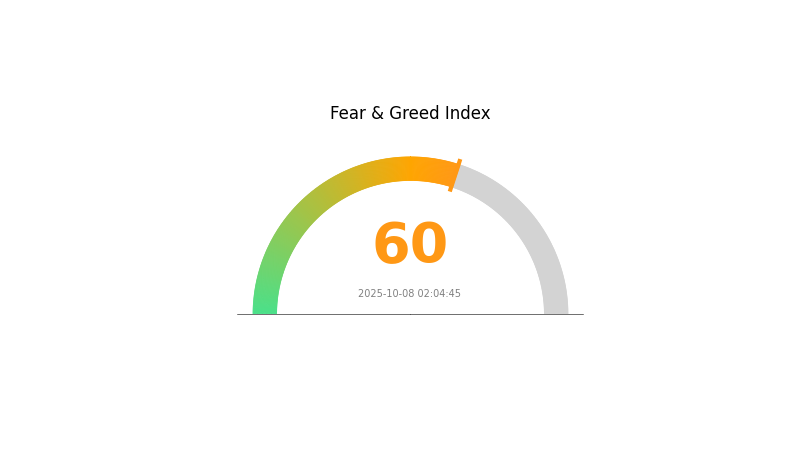
08 Ekim 2025 Korku ve Açgözlülük Endeksi: 60 (Açgözlülük)
Güncel Korku & Açgözlülük Endeksini görmek için tıklayın
Kripto piyasasında iyimserlik hâkim; Korku ve Açgözlülük Endeksi’nin 60’a yükselmesi “Açgözlülük” eğilimini teyit ediyor. Yatırımcıların güveni artarken, bu durum olumlu piyasa hareketleri ya da pozitif haber akışıyla desteklenmiş olabilir. Ancak aşırı açgözlülük, aşırı değerleme ve volatiliteyi tetikleyebileceğinden dikkatli olunmalı. Yatırımcılar, portföylerini çeşitlendirmeli ve riskleri yönetmek için zarar durdur emri koymalıdır. Her zaman olduğu gibi, kripto piyasasında başarılı olmak için kapsamlı analiz ve temkinli kararlar gereklidir.
TA Varlık Dağılımı
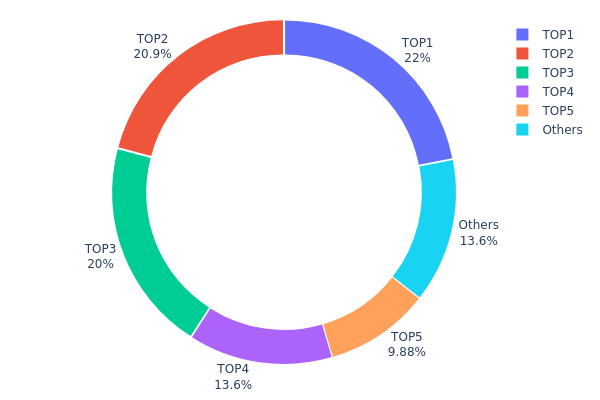
Adreslere göre varlık dağılımı, TA'da sahipliğin son derece yoğunlaştığını gösteriyor. İlk beş adres toplam arzın %86,35’ini elinde bulundururken, en büyük adresin payı %21,95 seviyesinde. Bu konsantrasyon, piyasa manipülasyonu ve yüksek volatilite risklerini gündeme getiriyor.
Böyle bir sahiplik yapısı, büyük adreslerden birinin yüklü satış veya transfer yapması halinde ciddi fiyat oynaklıklarına yol açabilir. Aynı zamanda merkeziyetsizlik düzeyinin düşük olduğunu göstererek tokenin dayanıklılığı ve piyasa istikrarı üzerinde etkili olabilir. Az sayıda hâkim adres, yönetişim ve projenin gelecekteki kararlarını etkileyebilir.
Kısa vadede bu yoğunlaşma fiyat istikrarı yaratabilir; fakat uzun vadede ekosistemi tehdit edecek riskler söz konusu. Yatırımcılar, merkeziyetle ilgili bu riskleri göz önünde bulundurmalı ve büyük adreslerin varlık hareketlerini yakından takip etmelidir; zira bu değişimler TA’nın piyasa dinamiklerini ciddi şekilde etkileyebilir.
Güncel TA Varlık Dağılımını görmek için tıklayın
| En Yüksek | Adres | Varlık Miktarı | Varlık (%) |
|---|---|---|---|
| 1 | 0x9581...88e952 | 210.000,00K | 21,95% |
| 2 | 0xc413...740d97 | 200.000,00K | 20,90% |
| 3 | 0x1b9d...261821 | 191.666,67K | 20,03% |
| 4 | 0x6148...882ec0 | 130.000,00K | 13,59% |
| 5 | 0xf89d...5eaa40 | 94.516,71K | 9,88% |
| - | Diğerleri | 130.379,16K | 13,65% |
II. TA'nın Gelecekteki Fiyatını Etkileyen Temel Faktörler
Arz Mekanizması
- Borsada Listeleme Etkisi: TA, Gate.com gibi borsalarda yeni listelendiği için, bu genellikle kısa vadede fiyatı artırabilecek ilgi ve işlem hacminde artış getirir.
Teknolojik Gelişim ve Ekosistem Oluşumu
-
Teknik Analiz Araçları: RSI ve MACD gibi göstergeler fiyat eğilimlerini tahmin etmek için kullanılır. RSI’nın 70’in üzerinde olması aşırı alım, 30’un altında olması ise aşırı satım işaretidir. MACD’nin sinyal çizgisinin üstüne çıkması yükseliş, altına inmesi ise düşüş trendine işaret edebilir.
-
Ekosistem Uygulamaları: Karanlık havuz DEX’lerin (merkeziyetsiz borsalar) gelişimi, TA ekosisteminde yeni nesil uygulamalar olarak gelecekteki fiyat hareketlerine etki edebilir.
III. 2025-2030 TA Fiyat Öngörüsü
2025 Görünümü
- Temkinli beklenti: 0,05899 $ - 0,06781 $
- Tarafsız beklenti: 0,06781 $ - 0,07323 $
- İyimser beklenti: 0,07323 $ - 0,07866 $ (olumlu piyasa havası ve artan benimseme ile)
2027 Orta Vadeli Görünüm
- Piyasa dönemi beklentisi: Artan volatiliteyle birlikte olası büyüme evresi
- Fiyat aralığı tahmini:
- 2026: 0,05859 $ - 0,09008 $
- 2027: 0,04164 $ - 0,10942 $
- Temel tetikleyiciler: Teknolojik ilerlemeler, piyasada yaygın benimseme ve olumlu regülasyon gelişmeleri
2030 Uzun Vadeli Görünüm
- Temel senaryo: 0,07742 $ - 0,11555 $ (istikrarlı büyüme ve benimseme varsayımıyla)
- İyimser senaryo: 0,11555 $ - 0,12018 $ (güçlü piyasa performansı ve artan kullanım ile)
- Dönüşüm senaryosu: 0,12018 $ - 0,13318 $ (çığır açan uygulamalar ve genel kabul ile)
- 31 Aralık 2030: TA 0,11555 $ (büyüme sonrası olası istikrar)
| Yıl | Tahmini En Yüksek Fiyat | Tahmini Ortalama Fiyat | Tahmini En Düşük Fiyat | Değişim Oranı (%) |
|---|---|---|---|---|
| 2025 | 0,07866 | 0,06781 | 0,05899 | 0 |
| 2026 | 0,09008 | 0,07323 | 0,05859 | 8 |
| 2027 | 0,10942 | 0,08166 | 0,04164 | 20 |
| 2028 | 0,10032 | 0,09554 | 0,09076 | 41 |
| 2029 | 0,13318 | 0,09793 | 0,05484 | 44 |
| 2030 | 0,12018 | 0,11555 | 0,07742 | 71 |
IV. TA İçin Profesyonel Yatırım Stratejileri ve Risk Yönetimi
TA Yatırım Stratejisi
(1) Uzun Vadeli Tutma Stratejisi
- Uygun yatırımcı tipi: Yapay zeka teknolojisine inanan, uzun vadeli yatırımcılar
- İşlem önerileri:
- Fiyat düşüşlerinde TA token biriktirin
- Minimum 1-2 yıl hedefli tutma süresi belirleyin
- Tokenleri güvenli, saklama hakkı sizde olan bir cüzdanda muhafaza edin
(2) Aktif Alım-Satım Stratejisi
- Teknik analiz araçları:
- Hareketli Ortalamalar: Trend ve olası dönüş noktalarını belirlemek için kullanılır
- RSI: Aşırı alım/aşırı satım durumlarını izleyin
- Swing trading için temel noktalar:
- Yapay zeka sektöründeki haber ve gelişmeleri takip edin
- Sıkı zararı durdur ve kâr al seviyeleri belirleyin
TA Risk Yönetimi Çerçevesi
(1) Varlık Dağılımı İlkeleri
- Temkinli yatırımcı: Kripto portföyünün %1-3’ü
- Aggresif yatırımcı: Kripto portföyünün %5-10’u
- Profesyonel yatırımcı: Kripto portföyünün %15’ine kadar
(2) Riskten Korunma Planları
- Çeşitlendirme: Yatırımları birden fazla yapay zeka temalı token arasında paylaştırın
- Zararı durdur emirleri: Olası kayıpları sınırlamak için kullanın
(3) Güvenli Saklama Alternatifleri
- Sıcak cüzdan önerisi: Gate Web3 Cüzdan
- Soğuk saklama: Uzun vadeli varlıklar için donanım cüzdanı
- Güvenlik önlemleri: İki aşamalı doğrulama ve güçlü şifre kullanımı
V. TA için Potansiyel Riskler ve Zorluklar
TA Piyasa Riskleri
- Yüksek oynaklık: Yapay zeka temalı token piyasası büyük fiyat dalgalanmalarına açık
- Rekabet: Yeni yapay zeka projeleri TA'nın pazar payını etkileyebilir
- Piyasa algısı: Yapay zeka ilgisindeki değişimler token değerini etkileyebilir
TA Düzenleyici Riskler
- Bilinmez regülasyonlar: Yapay zeka ve kripto alanında daha sıkı düzenlemeler riski
- Uluslararası uyumluluk: Farklı ülkelerde değişen yapay zeka ve kripto mevzuatı
- Veri gizliliği: Yapay zeka veri kullanımı konusunda olası denetimler
TA Teknik Riskler
- Akıllı kontrat açıkları: Olası istismar veya hatalar
- Ölçeklenebilirlik sorunları: Benimseme arttıkça ağda tıkanıklık yaşanabilir
- Yapay zeka entegrasyonu: Uygulamada ortaya çıkabilecek öngörülmeyen problemler
VI. Sonuç ve Eylem Önerileri
TA Yatırım Potansiyeli Değerlendirmesi
TA, yükselen yapay zeka-kripto sektöründe yüksek riskli ve yüksek potansiyelli bir fırsat sunuyor. Uzun vadeli değer önerisi güçlü olsa da, kısa vadede volatilite ve regülasyon belirsizliği önemli riskler taşımaktadır.
TA Yatırım Tavsiyeleri
✅ Yeni başlayanlar: Küçük, düzenli yatırımlarla pozisyonunuzu zamanla oluşturun ✅ Deneyimli yatırımcılar: Orta düzeyde tahsis yaparak aktif risk yönetimine odaklanın ✅ Kurumsal yatırımcılar: Stratejik ortaklıklar ve riskten korunma ile yüksek pozisyonları değerlendirin
TA Alım-Satım Katılım Yöntemleri
- Spot alım-satım: Gate.com üzerinden TA token alıp tutun
- Staking: Uygunsa staking programlarına katılın
- DeFi entegrasyonu: TA desteklendiği takdirde merkeziyetsiz finans protokollerinde kullanın
Kripto para yatırımları son derece yüksek risk içerir; bu makale yatırım tavsiyesi değildir. Yatırımcılar, kendi risk toleranslarına göre dikkatli karar vermeli ve profesyonel finansal danışmanlardan destek almalıdır. Asla kaybetmeyi göze alabileceğinizden fazlasını yatırmayın.
Sıkça Sorulan Sorular
Aptos için 2025 fiyat tahmini nedir?
Mevcut piyasa trendlerine göre, Aptos’un 2025 Kasım ayında 4,48 € seviyesine ulaşması ve %5 oranında fiyat değişimi yaşaması bekleniyor.
TransAlta için hedef fiyat nedir?
TransAlta için hedef fiyat 14,00 C$ ile 22,00 C$ arasında olup, güncel verilere göre ortalama tahmin 19,50 C$’dır.
2026’da T için fiyat hedefi nedir?
Wall Street analizlerine göre T’nin 2026 fiyat hedefi 32,00 $ olup, öngörülen aralık 20,71 $ ile 34,00 $ arasındadır.
TA tokenlerinin toplam arzı nedir?
TA tokenlerinin toplam arzı 998,56 milyon olup, bu miktar mevcut dolaşımdaki arzı da ifade eder.
Share
Content
Giriş: TA'nın Piyasa Konumu ve Yatırım Potansiyeli
I. TA Fiyat Geçmişi ve Güncel Piyasa Durumu
II. TA'nın Gelecekteki Fiyatını Etkileyen Temel Faktörler
III. 2025-2030 TA Fiyat Öngörüsü
IV. TA İçin Profesyonel Yatırım Stratejileri ve Risk Yönetimi
V. TA için Potansiyel Riskler ve Zorluklar
VI. Sonuç ve Eylem Önerileri
Sıkça Sorulan Sorular
How to Buy Cryptocurrency


Trending Cryptocurrencies


2025 BNKR Fiyat Tahmini: Dijital Varlık Sektöründe Piyasa Eğilimleri ve Büyüme Potansiyelinin Analizi

2025 ASP Fiyat Tahmini: Piyasa Trendleri ve Sektör Liderleri için Stratejik Öngörü

2025 ORAI Fiyat Tahmini: Oraichain Token’ın Piyasa Analizi ve Gelecek Büyüme Potansiyeli

2025 TAO Fiyat Tahmini: Piyasa Trendleri ve Potansiyel Büyüme Faktörlerinin Analizi

2025 TA Fiyat Tahmini: Teknik Varlıklar için Piyasa Trendleri Analizi ve Gelecek Değerlerin Öngörülmesi
2025 DNX Fiyat Tahmini: Piyasa Trendleri ve Potansiyel Büyüme Faktörlerinin Analizi

OpenEden Gerçek Dünya Varlık Tokenizasyon Platformu ve EDEN Token Ekonomisi
Anoma Ağı Niyet Odaklı Dağıtık İşletim Sistemi Çoklu Zincir Birlikte Çalışabilirlik
Aster Merkeziyetsiz Sürekli Sözleşme ve Çok Zincirli Türevler Ticaret Platformu
Web3 dünyasında NFT dijital sanatına yönelik önde gelen platformları keşfetmek

Kriptoda Farcaster Protokolü’nü Anlamak