2025 TA Fiyat Tahmini: Teknik Varlıklar için Piyasa Trendleri Analizi ve Gelecek Değerlerin Öngörülmesi


Giriş: TA'nın Piyasa Konumu ve Yatırım Potansiyeli
Trusta.AI (TA), yapay zeka ve kripto ekosistemi için güvenilir kimlik ağı oluşturma hedefiyle 2025’te faaliyete geçtiğinden beri önemli ilerlemeler kaydetti. 2025 yılı itibarıyla Trusta.AI’nin piyasa değeri 13.471.200 USD’ye ulaştı; yaklaşık 180.000.000 dolaşımdaki token ile fiyatı 0,07484 USD civarında. “AI-Kripto Köprüsü” olarak bilinen bu varlık, hem insan hem de yapay zeka için evrensel bir kredi sisteminin kurulmasında giderek daha kritik bir rol üstleniyor.
Bu makalede, Trusta.AI’nin 2025-2030 dönemindeki fiyat hareketleri, geçmiş eğilimler, piyasa arz-talep dengesi, ekosistem gelişimi ve makroekonomik faktörler ışığında analiz edilerek yatırımcılara profesyonel fiyat tahminleri ve uygulanabilir yatırım stratejileri sunulacaktır.
I. TA Fiyat Geçmişi ve Mevcut Piyasa Durumu
TA Tarihsel Fiyat Değişimi
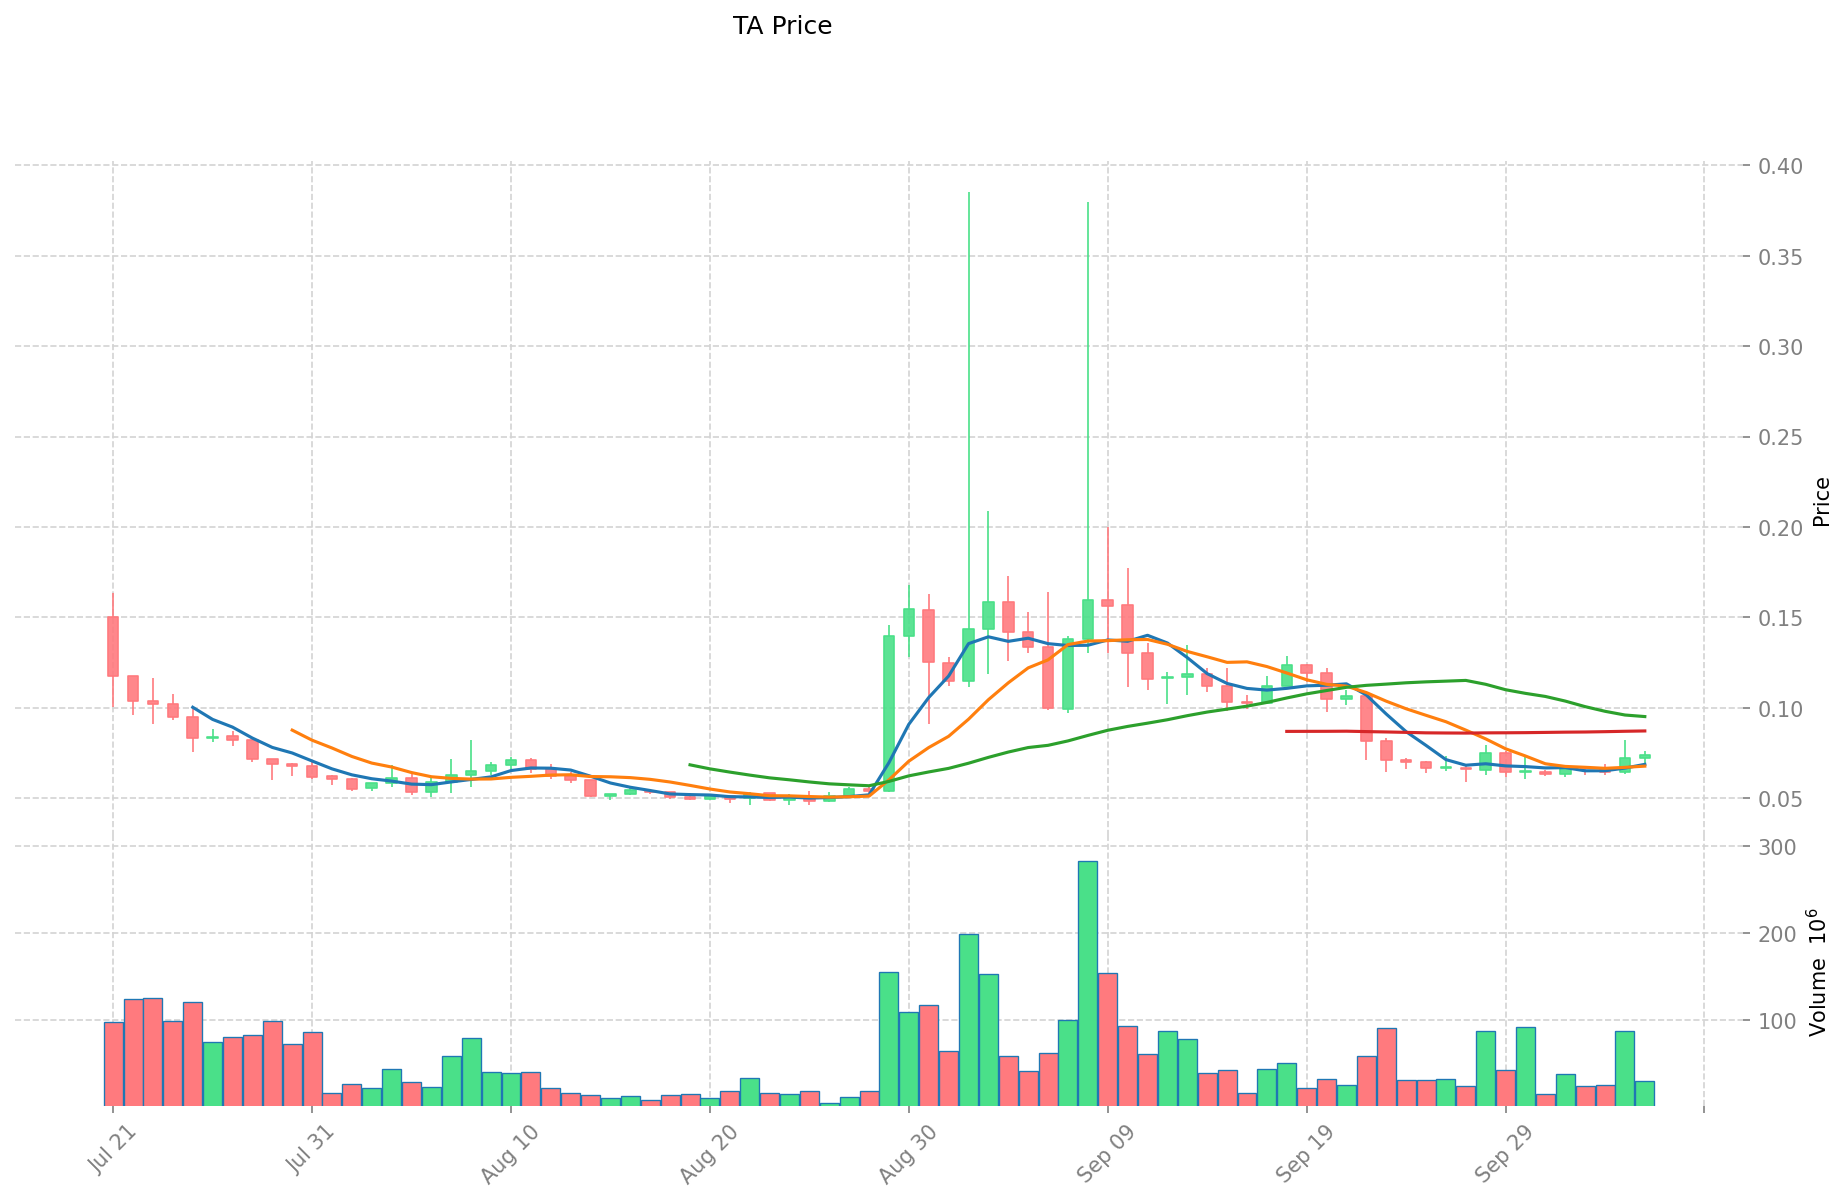
- 2025 (Ağustos): İlk lansmanda fiyat 0,10 USD’den başladı
- 2025 (2 Eylül): Tüm zamanların en yüksek seviyesi olan 0,3854 USD’ye ulaştı
- 2025 (24 Ağustos): Tüm zamanların en düşük seviyesi olan 0,046 USD’ye geriledi
TA Güncel Piyasa Durumu
TA, şu anda 0,07484 USD’den işlem görüyor ve son 24 saatte %6,79 artış kaydetti. Token’ın piyasa değeri 13.471.200 USD, dolaşımda ise 180.000.000 TA bulunuyor. Tam seyreltilmiş değerleme 74.840.000 USD düzeyinde.
Geçen hafta TA’da %9,11 artış gözlemlendi ve kısa vadede yükseliş ivmesi bulunuyor. Ancak, 30 günlük trend %25,91 düşüşle orta vadede baskılı seyri gösteriyor.
Token’ın son 24 saatteki işlem hacmi 2.284.720,37 USD olup, orta düzeyde piyasa aktivitesine işaret ediyor. TA’nın mevcut fiyatı, tüm zamanların en yüksek seviyesi olan 0,3854 USD’nin oldukça altında; ancak en düşük seviyesi olan 0,046 USD’nin üzerinde.
Piyasa duyarlılığı TA için karmaşık; kısa vadeli kazançlar uzun vadeli kayıplarla birlikte görülüyor. Yatırımcıların, token’ın Ağustos 2025’te piyasaya yeni sürüldüğünü unutmaması gerekiyor.
Mevcut TA piyasa fiyatını görüntülemek için tıklayın
TA Piyasa Duyarlılık Göstergesi
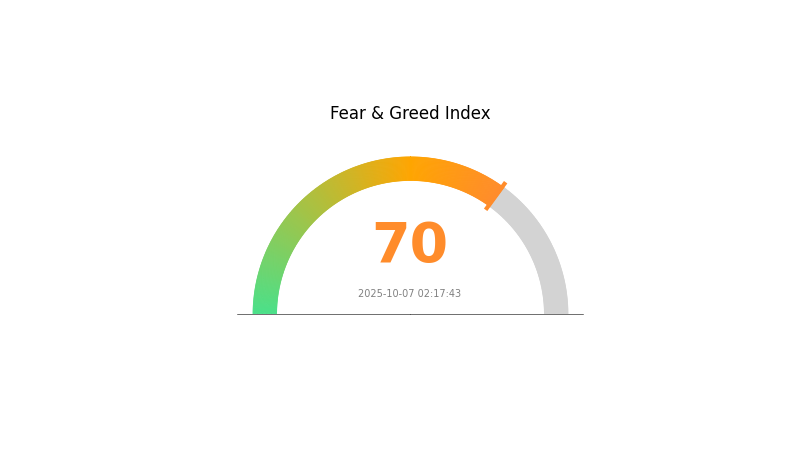
07 Ekim 2025 Korku ve Açgözlülük Endeksi: 70 (Açgözlülük)
Mevcut Korku ve Açgözlülük Endeksi için tıklayın
Kripto piyasasında aşırı iyimserlik dikkat çekiyor; Korku ve Açgözlülük Endeksi 70’e ulaştı ve piyasada açgözlülük hakim. Bu ortamda yatırımcılar aşırı iyimser davranarak fiyatları sürdürülemez seviyelere taşıyabiliyor. Yükseliş eğilimi ilave kazançlar getirebilir; yine de temkinli yaklaşmak önemli. Tecrübeli traderlar aşırı açgözlülüğü genellikle karşıt bir sinyal olarak görür ve bu dönemi kâr almak veya pozisyonlarını korumak için uygun bulur. Her zaman olduğu gibi, çeşitlendirme ve risk yönetimi dalgalı piyasalarda temel öneme sahiptir.
TA Varlık Dağılımı
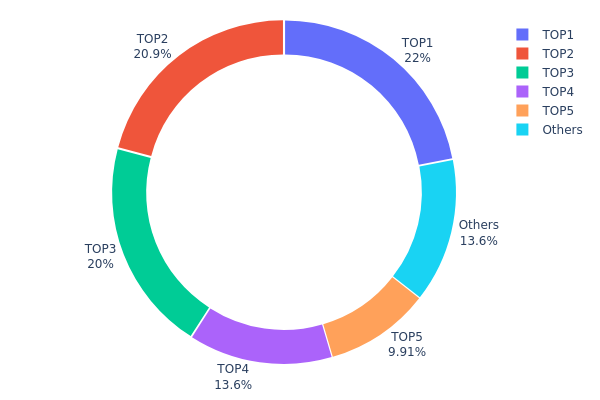
Adres bazında varlık dağılımı, TA’da son derece yoğunlaşmış bir sahiplik yapısı gösteriyor. İlk beş adres, toplam arzın %86,38’ini elinde bulunduruyor; kalan %13,62 ise diğer adreslere dağılmış durumda. Özellikle ilk üç adres toplam token’ların %62,88’ini kontrol ediyor.
Böylesine yüksek bir yoğunluk, piyasa manipülasyonu ve fiyat oynaklığı konusunda önemli riskler barındırıyor. Az sayıda büyük sahip, token arzı üzerinde ciddi etkisiyle ani ve büyük işlemlerle fiyatları hızla değiştirebilir. Merkezileşmiş bu dağılım, blokzincir projelerinin merkeziyetsizlik ilkesiyle örtüşmüyor.
Piyasa yapısı açısından, bu yoğunlaşma TA için görece olgunlaşmamış ve istikrarsız bir ekosisteme işaret ediyor. Balina hakimiyeti algısı küçük yatırımcıları caydırabilir; organik fiyat oluşumunu sınırlayabilir. Token’ın uzun vadeli piyasa sağlığını değerlendirmek için büyük adreslerdeki değişiklikler yakından izlenmeli.
Mevcut TA Varlık Dağılımı için tıklayın
| Sıra | Adres | Varlık Miktarı | Varlık (%) |
|---|---|---|---|
| 1 | 0x9581...88e952 | 210.000,00K | 21,95% |
| 2 | 0xc413...740d97 | 200.000,00K | 20,90% |
| 3 | 0x1b9d...261821 | 191.666,67K | 20,03% |
| 4 | 0x6148...882ec0 | 130.000,00K | 13,59% |
| 5 | 0xf89d...5eaa40 | 94.815,71K | 9,91% |
| - | Diğerleri | 130.079,86K | 13,62% |
II. Gelecekteki TA Fiyatlarını Etkileyecek Temel Faktörler
Arz Mekanizması
- Tarihsel örüntüler: Geçmiş arz değişikliklerinin fiyatlar üzerinde etkisi oldu; arz artışı çoğunlukla fiyatlarda düşüşe yol açtı.
- Güncel etkiler: Mevcut arz değişikliklerinin ileriye dönük fiyat hareketlerini etkilemesi bekleniyor.
Kurumsal ve Balina Dinamikleri
- Ulusal politikalar: Devletin TA’ya yönelik düzenlemeleri ve politikaları, piyasa performansını doğrudan etkileyebilir.
Makroekonomik Ortam
- Enflasyona karşı koruma: TA’nın enflasyon ortamındaki performansı, fiyat eğilimlerini belirleyebilir.
- Jeopolitik faktörler: Uluslararası ticaret gerilimleri ve tarife değişiklikleri, TA’nın arz-talep dengesini değiştirerek fiyat dalgalanmalarına sebep olabilir.
Teknolojik Gelişim ve Ekosistem Oluşturma
- Teknik analiz araçları: RSI ve MACD gibi göstergeler, TA fiyat trendlerinin tahmininde kullanılıyor.
- Ekosistem uygulamaları: Merkeziyetsiz uygulama (DApp) ve ekosistem projelerinin gelişimi, TA’nın değerini doğrudan etkileyebilir.
III. 2025-2030 TA Fiyat Tahmini
2025 Görünümü
- Temkinli tahmin: 0,05725 - 0,07533 USD
- Tarafsız tahmin: 0,07533 - 0,08512 USD
- İyimser tahmin: 0,08512 - 0,09492 USD (olumlu piyasa duyarlılığı ve daha fazla benimseme ile)
2027-2028 Görünümü
- Piyasa aşaması beklentisi: Benimsenme artışıyla büyüme dönemi
- Fiyat aralığı öngörüsü:
- 2027: 0,07685 - 0,15474 USD
- 2028: 0,07758 - 0,18101 USD
- Temel katalizörler: Teknolojik ilerlemeler, yaygın piyasa kabulü ve potansiyel ortaklıklar
2029-2030 Uzun Vadeli Görünüm
- Temel senaryo: 0,15515 - 0,16291 USD (istikrarlı büyüme ve benimseme ile)
- İyimser senaryo: 0,17067 - 0,22807 USD (olumlu piyasa koşulları ve artan kullanım ile)
- Dönüştürücü senaryo: 0,22807 USD üstü (çığır açıcı gelişmeler ve kitlesel benimseme ile)
- 31 Aralık 2030: TA 0,22807 USD (yeni rekor seviyelere ulaşabilir)
| Yıl | Tahmini En Yüksek Fiyat | Tahmini Ortalama Fiyat | Tahmini En Düşük Fiyat | Artış Oranı (%) |
|---|---|---|---|---|
| 2025 | 0,09492 | 0,07533 | 0,05725 | 0 |
| 2026 | 0,12258 | 0,08512 | 0,07916 | 13 |
| 2027 | 0,15474 | 0,10385 | 0,07685 | 38 |
| 2028 | 0,18101 | 0,12929 | 0,07758 | 72 |
| 2029 | 0,17067 | 0,15515 | 0,09464 | 107 |
| 2030 | 0,22807 | 0,16291 | 0,12055 | 117 |
IV. TA için Profesyonel Yatırım Stratejileri ve Risk Yönetimi
TA Yatırım Metodolojisi
(1) Uzun Vadeli Tutma Stratejisi
- Uygunluk: Yüksek risk toleransı olan uzun vadeli yatırımcılar
- Uygulama önerileri:
- Piyasa düşüşlerinde TA biriktirin
- En az 1-2 yıl tutarak dalgalanmaları aşın
- Token’ları donanım cüzdanında saklayın
(2) Aktif Ticaret Stratejisi
- Teknik analiz araçları:
- Hareketli ortalamalar: Trend ve destek/direnç tespiti için
- RSI: Aşırı alım/aşırı satım izleme
- Dalgalı işlemde önemli noktalar:
- Teknik göstergelere göre net giriş/çıkış noktaları belirleyin
- Zarar durdur emirleriyle riski sınırlayın
TA Risk Yönetimi Çerçevesi
(1) Varlık Dağılımı İlkeleri
- Temkinli yatırımcı: Kripto portföyünün %1-3’ü
- Agresif yatırımcı: Kripto portföyünün %5-10’u
- Profesyonel yatırımcı: Kripto portföyünün %15’ine kadar
(2) Riskten Korunma Çözümleri
- Çeşitlendirme: Yatırımı farklı kripto varlıklarına yaymak
- Zarar durdur: Potansiyel kayıpları sınırlamak için uygulayın
(3) Güvenli Saklama Çözümleri
- Donanım cüzdanı önerisi: Gate Web3 Wallet
- Yazılım cüzdanı: Resmi Trusta.AI cüzdanı (varsa)
- Güvenlik önlemleri: İki faktörlü doğrulama, güçlü parola kullanımı
V. TA İçin Potansiyel Riskler ve Zorluklar
TA Piyasa Riskleri
- Yüksek oynaklık: Kripto piyasasında sık fiyat dalgalanmaları
- Likitide riski: Kısıtlı işlem hacmi, hızlı alım/satım kabiliyetini etkileyebilir
- Rekabet: Diğer AI ve kimlik odaklı projeler TA’nın payını azaltabilir
TA Düzenleyici Riskler
- Bilinmeyen düzenleyici ortam: AI ve kriptoya yönelik yeni düzenlemeler olasılığı
- Sınır ötesi uyum sorunları: Uluslararası mevzuata uyumda zorluklar
- Veri gizliliği: Kişisel veri işleyen AI projelerine yönelik artan denetim
TA Teknik Riskler
- Akıllı sözleşme açıkları: Kodda istismar veya hata riski
- Ölçeklenebilirlik: Artan ağ yükünü yönetmede potansiyel sınırlamalar
- Entegrasyon: Farklı AI sistemleriyle bağlantıda zorluklar
VI. Sonuç ve Eylem Önerileri
TA Yatırım Değeri Değerlendirmesi
Trusta.AI, AI ve kripto kimlik alanında yenilikçi yaklaşımıyla büyüyen sektörde uzun vadeli potansiyel sunuyor. Ancak kısa vadeli dalgalanma ve düzenleyici belirsizlikler ciddi riskler oluşturuyor.
TA Yatırım Önerileri
✅ Yeni başlayanlar: Kademeli ve düzenli küçük yatırımlarla pozisyon oluşturun
✅ Deneyimli yatırımcılar: Potansiyel ve riski dengeleyerek orta düzeyde pay ayırın
✅ Kurumsal yatırımcılar: Kapsamlı inceleme yaparak TA’yı çeşitlendirilmiş portföyde değerlendirin
TA Ticaret Katılım Yöntemleri
- Spot ticaret: Gate.com üzerinden TA token alıp tutun
- DCA (Dolar Maliyet Ortalaması): Fiyat oynaklığını azaltmak için düzenli küçük alımlar yapın
- Staking: Trusta.AI’nin sunduğu staking programlarına katılarak ek ödüller kazanın (varsa)
Kripto para yatırımları son derece yüksek risk içerir; bu makale yatırım tavsiyesi değildir. Yatırımcılar, kararlarını kendi risk profillerine göre dikkatlice vermeli ve profesyonel finansal danışmanlara danışmalıdır. Asla kaybetmeyi göze alabileceğinizden fazla yatırım yapmayın.
Sıkça Sorulan Sorular
Aptos için 2025 tahmini nedir?
Aptos’un 2025 tahmini 4,59 - 12,58 USD arasında olup, %175’e kadar büyüme potansiyeli gösteriyor. Piyasa eğilimleri önemli bir değer artışı ihtimaline işaret ediyor.
T için 2026 fiyat hedefi nedir?
Wall Street analizine göre, T için 2026 fiyat hedefi 32,00 USD; tahmin aralığı ise 20,71 - 34,00 USD.
En yüksek fiyat tahminine sahip kripto para hangisi?
En yüksek fiyat tahminine sahip kripto para Bitcoin’dir; tahminler, 2025’te şu anki 124.798 USD’den 139.045 USD’ye çıkabileceğini gösteriyor.
TA tokenlarının toplam arzı nedir?
TA tokenlarının toplam arzı 998,56 milyon; 07 Ekim 2025 tarihi itibarıyla dolaşımdaki arz ile aynıdır.
Share
Content
Giriş: TA'nın Piyasa Konumu ve Yatırım Potansiyeli
I. TA Fiyat Geçmişi ve Mevcut Piyasa Durumu
II. Gelecekteki TA Fiyatlarını Etkileyecek Temel Faktörler
III. 2025-2030 TA Fiyat Tahmini
IV. TA için Profesyonel Yatırım Stratejileri ve Risk Yönetimi
V. TA İçin Potansiyel Riskler ve Zorluklar
VI. Sonuç ve Eylem Önerileri
Sıkça Sorulan Sorular
How to Buy Cryptocurrency


Trending Cryptocurrencies


2025 BNKR Fiyat Tahmini: Dijital Varlık Sektöründe Piyasa Eğilimleri ve Büyüme Potansiyelinin Analizi

2025 ASP Fiyat Tahmini: Piyasa Trendleri ve Sektör Liderleri için Stratejik Öngörü

2025 ORAI Fiyat Tahmini: Oraichain Token’ın Piyasa Analizi ve Gelecek Büyüme Potansiyeli

2025 TAO Fiyat Tahmini: Piyasa Trendleri ve Potansiyel Büyüme Faktörlerinin Analizi

2025 TAPrice Tahmini: Piyasa Trendleri ve Token Varlıklarının Gelecekteki Değerlemesinin Analizi
2025 DNX Fiyat Tahmini: Piyasa Trendleri ve Potansiyel Büyüme Faktörlerinin Analizi
Kripto varlıklarınızı güvence altına almak için özel anahtarları anlamak: Güvenlik önerileri

Ethereum ölçeklenebilirliğini geliştirmek amacıyla Layer 2 çözümlerini keşfetmek
Blockchain Node İşlevselliğini Anlamak: Yeni Başlayanlar İçin Rehber
Taproot teknolojisini destekleyen en güvenli Bitcoin cüzdanları
Ethereum İşlem Maliyetlerinin Yapısını Kavramak ve Bunları Azaltma Yöntemleri