2025 MORE Fiyat Tahmini: Dijital Varlık Piyasasında Büyümeyi Şekillendiren Yükseliş Trendleri ve Temel Etkenler

Giriş: MORE'un Piyasadaki Konumu ve Yatırım Potansiyeli
Moonveil (MORE), tam kapsamlı bir Web3 oyun ekosistemi olarak kuruluşundan bu yana önemli kilometre taşlarına ulaştı. 2025 yılı itibarıyla Moonveil'in piyasa değeri 4.495.701 $ seviyesine ulaştı, dolaşımdaki token sayısı yaklaşık 179.900.000 ve fiyatı da 0,02499 $ civarında seyrediyor. "Oyun ve L2 altyapı inovasyoncusu" olarak tanımlanan bu varlık, blokzincir tabanlı oyun ve merkeziyetsiz altyapı alanlarında giderek daha önemli bir rol üstleniyor.
Bu makalede, Moonveil'in 2025-2030 yılları arasındaki fiyat hareketleri; geçmişten gelen performans, piyasa arz-talep dengesi, ekosistem gelişimi ve makroekonomik faktörler eşliğinde kapsamlı biçimde analiz edilerek, yatırımcılara profesyonel fiyat öngörüleri ve uygulanabilir yatırım stratejileri sunulmaktadır.
I. MORE Fiyat Geçmişi ve Güncel Piyasa Durumu
MORE Tarihsel Fiyat Seyri
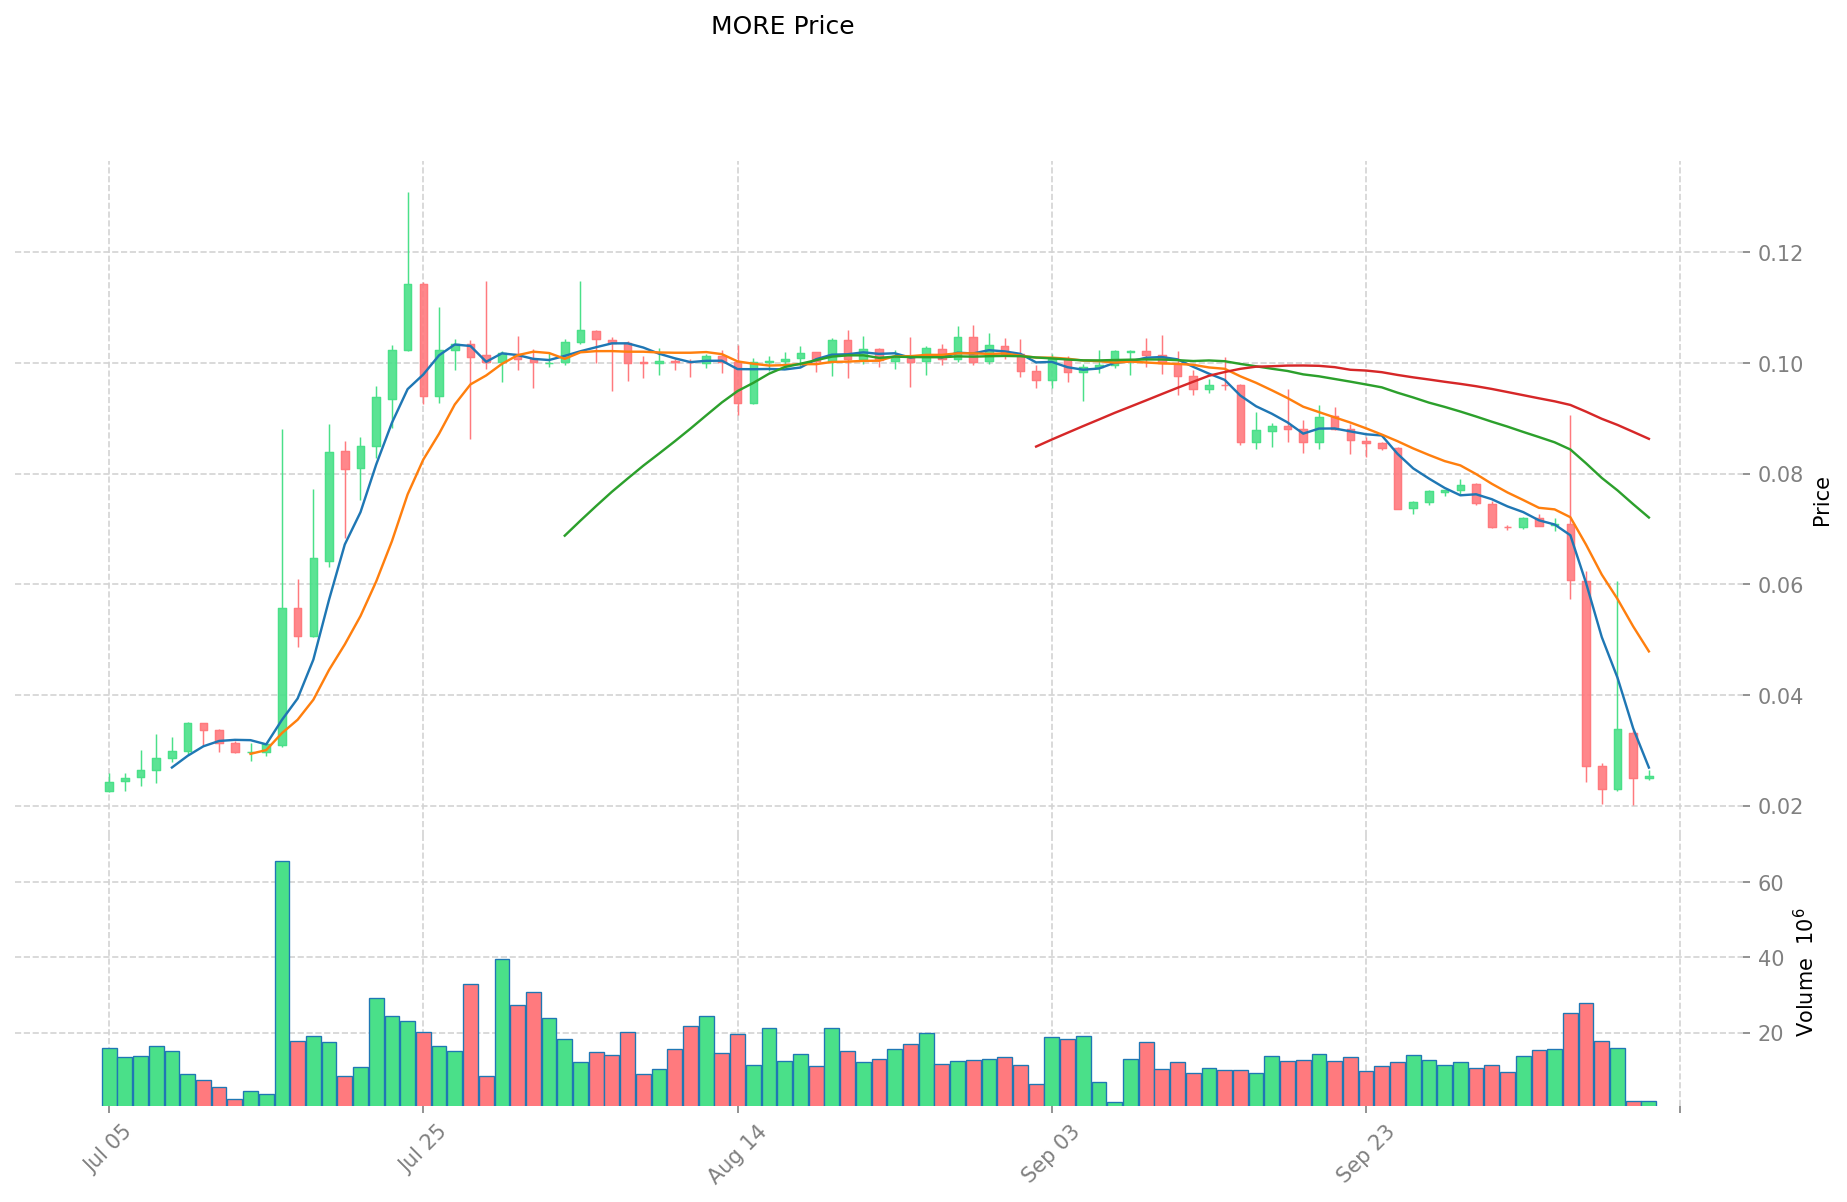
- 2025: Proje lansmanı, fiyat 27 Haziran'da 0,22 $ ile rekor seviyeye ulaştı
- 2025: Piyasa düzeltmesi, fiyat 27 Haziran'da 0,01518 $ ile en düşük seviyeye indi
- 2025: Kademeli toparlanma, fiyat ekim ayında 0,025 $ civarında istikrar buldu
MORE Güncel Piyasa Tablosu
12 Ekim 2025 itibarıyla MORE, 0,02499 $ seviyesinden işlem görüyor ve son 24 saatte %3,99 oranında geriledi. Token'ın piyasa değeri 4.495.701 $ olup, genel kripto para piyasasında 1.791. sırada yer alıyor. Dolaşımdaki arzı 179.900.000 adet ve bu, toplam arzın %17,99'una denk geliyor (toplam arz: 1.000.000.000).
Token son dönemde ciddi dalgalanmalar gösterdi; son bir haftada %64,48, son 30 günde ise %74,61 oranında değer kaybetti. Bu gerileme, kısa ve orta vadede ayı piyasasının hâkim olduğunu gösteriyor. Mevcut fiyat, 0,22 $'lık tüm zamanların en yüksek seviyesine göre oldukça düşük ve projeye uzun vadeli inanan yatırımcılar için fırsat sunuyor.
Son 24 saatteki işlem hacmi 47.406,06 $ olarak gerçekleşti ve piyasada orta seviyede bir aktiviteye işaret ediyor. Projenin tam seyreltilmiş değeri ise, toplam arz bazında 24.990.000 $'a ulaşıyor.
Güncel MORE piyasa fiyatını görüntülemek için tıklayın
MORE Piyasa Duyarlılık Göstergesi
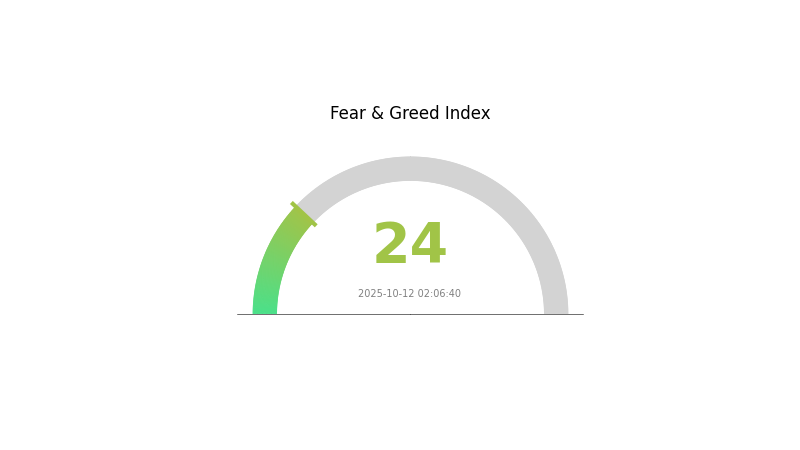
12 Ekim 2025 Korku ve Açgözlülük Endeksi: 24 (Aşırı Korku)
Güncel Korku ve Açgözlülük Endeksi'ni görüntülemek için tıklayın
Kripto piyasasında aşırı korku hakim; duyarlılık endeksi 24 seviyesine geriledi. Bu kadar kötümser bir ortam genellikle tecrübeli yatırımcılar için fırsatlar sunar. Birçok kişi panik satış yaparken, zıt stratejiler avantaj sağlayabilir. Ancak piyasa dalgalanması sürebilir; yatırım kararı almadan önce kapsamlı araştırma yapmalı ve risk toleransınızı mutlaka göz önünde bulundurmalısınız. Unutmayın, piyasa duyarlılığı hızla değişebilir ve güncel kalmak bu belirsiz dönemde kritik öneme sahiptir.
MORE Token Dağılımı
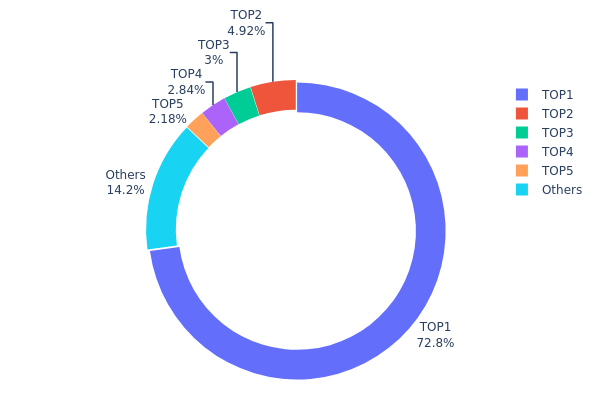
MORE'un token dağılımı analizi, sahiplikte son derece yüksek bir yoğunlaşmayı ortaya koyuyor. En büyük adres, toplam arzın %72,84'ünü (728.458,23K token) elinde bulunduruyor. Bu denli yoğunlaşma, MORE ekosisteminde merkeziyet riskini artırıyor. İkinci büyük adres %4,92, üçüncüsü %2,99 oranında paya sahip.
Bu dengesiz dağılım, MORE'un piyasa dinamikleri üzerinde önemli sonuçlar doğurabilir. Hakim adresin konumu, token arzı ve fiyat hareketleri üzerinde güçlü bir etki sağlar. Büyük işlemler volatiliteyi artırabilir; ayrıca bu yoğunlaşma piyasa manipülasyonu riskini beraberinde getirir. Token sahipliğindeki merkeziyet, projenin merkeziyetsizlik iddiasını zayıflatabilir.
Piyasa yapısı açısından bu dağılım, yaygın benimsenme ve likidite için ideal olmayan bir tabloya işaret ediyor. İlk 5 adres dışında kalanlar yalnızca %14,24'lük paya sahip; yeni katılımcıların anlamlı miktarda token edinme imkanı oldukça sınırlı. Bu yapı, token'ın fiyat keşfi ve piyasa sağlığı açısından sorun teşkil edebilir ve adil piyasa koşullarına önem veren yatırımcıları caydırabilir.
Güncel MORE token dağılımını görüntülemek için tıklayın
| Üst | Adres | Tutan Miktar | Pay (%) |
|---|---|---|---|
| 1 | 0x0beb...1b951f | 728458,23K | 72,84% |
| 2 | 0x2ff7...b4de41 | 49231,65K | 4,92% |
| 3 | 0x93de...85d976 | 29997,21K | 2,99% |
| 4 | 0x15c4...49c15c | 28368,06K | 2,83% |
| 5 | 0x86e6...14f8ee | 21810,10K | 2,18% |
| - | Diğerleri | 142134,74K | 14,24% |
II. MORE'un Gelecek Fiyatını Etkileyen Temel Unsurlar
Arz Mekanizması
- Yarılanma Etkinlikleri: Madenci ödüllerinin belirli aralıklarla azaltılması, arzı ve dolayısıyla fiyatı etkiler
- Tarihsel Seyir: Önceki yarılanmalar uzun vadede fiyat artışı sağlamıştır
- Mevcut Etki: Yaklaşan yarılanma, arz enflasyonunu düşürecek ve fiyatı destekleyebilir
Kurumsal ve Balina Hareketleri
- Kurumsal Yatırımlar: Büyük finansal kurumlar kriptoya olan ilgisini artırıyor
- Kurumsal Benimseme: Daha fazla şirket, bilançosuna MORE ekliyor
- Devlet Politikaları: Temel pazarlardaki düzenleyici gelişmeler benimsenmeyi etkiliyor
Makroekonomik Ortam
- Para Politikası Etkisi: Merkez bankası faiz politikaları kripto piyasalarını etkiler
- Enflasyona Karşı Koruma: MORE'un olası enflasyon koruma performansı
- Jeopolitik Unsurlar: Küresel siyasi-ekonomik gelişmeler kripto piyasası algısını etkiler
Teknik Gelişim ve Ekosistem Büyümesi
- Ağ Güncellemeleri: Ölçeklenebilirlik ve işlevselliğe yönelik sürekli iyileştirmeler
- Layer 2 Çözümleri: Ağ kapasitesini artıran ikinci katman protokollerinin geliştirilmesi
- Ekosistem Uygulamaları: MORE ağında DeFi, NFT ve diğer kullanım alanlarının yaygınlaşması
III. 2025-2030 MORE Fiyat Tahmini
2025 Öngörüsü
- Temkinli tahmin: 0,01489 $ - 0,02 $
- Tarafsız tahmin: 0,02 $ - 0,0248 $
- İyimser tahmin: 0,0248 $ - 0,0273 $ (olumlu piyasa duyarlılığı gerektirir)
2027-2028 Öngörüsü
- Piyasa fazı beklentisi: Potansiyel büyüme dönemi
- Fiyat aralığı tahmini:
- 2027: 0,02511 $ - 0,0444 $
- 2028: 0,03376 $ - 0,04839 $
- Kritik tetikleyiciler: Artan benimseme, teknolojik ilerlemeler
2030 Uzun Vadeli Öngörüsü
- Temel senaryo: 0,04625 $ - 0,04768 $ (istikrarlı piyasa büyümesiyle)
- İyimser senaryo: 0,04768 $ - 0,05673 $ (güçlü piyasa performansı ile)
- Dönüştürücü senaryo: 0,05673 $ üzeri (çok olumlu piyasa koşullarında)
- 31 Aralık 2030: MORE 0,05673 $ (potansiyel tepe fiyat)
| Yıl | Tahmini En Yüksek Fiyat | Tahmini Ortalama Fiyat | Tahmini En Düşük Fiyat | Değişim (%) |
|---|---|---|---|---|
| 2025 | 0,0273 | 0,02482 | 0,01489 | 0 |
| 2026 | 0,03518 | 0,02606 | 0,02398 | 4 |
| 2027 | 0,0444 | 0,03062 | 0,02511 | 22 |
| 2028 | 0,04839 | 0,03751 | 0,03376 | 50 |
| 2029 | 0,0524 | 0,04295 | 0,02706 | 71 |
| 2030 | 0,05673 | 0,04768 | 0,04625 | 90 |
IV. MORE Profesyonel Yatırım Stratejileri ve Risk Yönetimi
MORE Yatırım Yaklaşımı
(1) Uzun Vadeli Tutma Stratejisi
- Uygunluk: Web3 oyun ekosistemine inanan uzun vadeli yatırımcılar
- Uygulama önerileri:
- Piyasa geri çekilmelerinde MORE token biriktirin
- Moonveil'in proje gelişiminden ve kilometre taşlarından haberdar olun
- Token'ları güvenli, saklama dışı cüzdanlarda muhafaza edin
(2) Aktif Alım-Satım Stratejisi
- Teknik analiz araçları:
- Hareketli Ortalama: Trendleri ve olası dönüş noktalarını tespit etmek için kullanılır
- RSI (Göreceli Güç Endeksi): Aşırı alım-satım durumlarını belirlemeye yardımcı olur
- Dalgalı alım-satım için odak noktalar:
- Moonveil ekosisteminin gelişimini ve iş birliklerini izleyin
- Genel kripto piyasa duyarlılığını takip edin
MORE Risk Yönetimi Çerçevesi
(1) Varlık Dağılımı İlkeleri
- Temkinli yatırımcılar: Kripto portföyünün %1-3'ü
- Agresif yatırımcılar: Kripto portföyünün %5-10'u
- Profesyonel yatırımcılar: Kripto portföyünün en fazla %15'i
(2) Riskten Korunma Yöntemleri
- Çeşitlendirme: Yatırımları farklı Web3 oyun projelerine yaymak
- Stop-loss emirleri: Potansiyel kayıpları sınırlamak için uygun seviyeler belirlemek
(3) Güvenli Saklama Çözümleri
- Sıcak cüzdan önerisi: Gate Web3 Cüzdan
- Soğuk saklama: Uzun vadeli tutum için donanım cüzdanları
- Güvenlik önlemleri: İki faktörlü kimlik doğrulama, güçlü parola ve özel anahtarların çevrimdışı tutulması
V. MORE İçin Olası Riskler ve Zorluklar
MORE Piyasa Riskleri
- Yüksek volatilite: Web3 oyun sektörü büyük fiyat dalgalanmalarına açıktır
- Rekabet: Artan sayıda Web3 oyun projesi Moonveil'in pazar payını azaltabilir
- Piyasa duyarlılığı: Genel kripto piyasa koşulları MORE'un fiyatını etkileyebilir
MORE Düzenleyici Riskler
- Belirsiz düzenlemeler: Web3 oyunlarına dair kurallar birçok ülkede hâlâ netleşmemiştir
- Olası sınırlamalar: Bazı ülkeler blokzincir tabanlı oyunlara kısıtlamalar getirebilir
- Uyum zorlukları: Farklı bölgelerdeki değişken düzenleyici gereksinimlere uyum sağlamak
MORE Teknik Riskler
- Akıllı kontrat açıkları: Temel kodda olası hata veya istismarlar
- Ölçeklenebilirlik sorunları: Ekosistem büyüdükçe artan kullanıcı yükünü yönetme zorlukları
- Birlikte çalışabilirlik endişeleri: Çoklu zincir işlevselliğini sorunsuz sağlama zorlukları
VI. Sonuç ve Eylem Önerileri
MORE Yatırım Değeri Değerlendirmesi
Moonveil (MORE), Web3 oyun sektöründe güçlü iş birlikleri ve kapsamlı ekosistem yaklaşımı ile uzun vadede cazip bir değer sunmaktadır. Ancak kısa vadede piyasa oynaklığı ve düzenleyici belirsizlikler risk teşkil etmektedir.
MORE Yatırım Tavsiyeleri
✅ Yeni başlayanlar: Küçük pozisyonlarla başlayın, Web3 oyun sektörünü öğrenmeye odaklanın ✅ Deneyimli yatırımcılar: Risk toleransınıza ve projeye olan inancınıza göre orta büyüklükte portföy ayırın ✅ Kurumsal yatırımcılar: Kapsamlı inceleme yapın ve Moonveil ekibiyle doğrudan iletişime geçmeyi düşünün
MORE İşlem Katılım Yöntemleri
- Spot işlemler: Gate.com üzerinden MORE token alıp satabilirsiniz
- Staking: Pasif gelir elde etmek için varsa staking programlarına katılabilirsiniz
- Düğüm işletimi: Ekosisteme daha etkin katılım için Moonveil node çalıştırmayı değerlendirin
Kripto para yatırımları çok yüksek risk taşır ve bu makale yatırım tavsiyesi niteliği taşımaz. Yatırımcılar, kendi risk toleranslarına göre dikkatli hareket etmeli ve profesyonel finansal danışmanlardan destek almalıdır. Asla kaybetmeyi göze alamayacağınız tutarda yatırım yapmayın.
Sıkça Sorulan Sorular
IMX yükselir mi?
Evet, mevcut piyasa trendlerine göre IMX'in hafta sonunda %5 artarak 0,520569 $ seviyesine yükselmesi bekleniyor.
2030 yılında 1 Bitcoin ne kadar olacak?
Mevcut öngörülere göre, 1 Bitcoin 2030 yılında 250.000 $ ile 1 milyon $ arasında değer kazanabilir; bu artış benimsenme ve sınırlı arzdan kaynaklanmaktadır.
Ford hissesi 20 $'a ulaşır mı?
Evet, Ford hissesi güçlü gelir büyümesi, kâr artışı ve olumlu piyasa koşulları ile 20 $ seviyesine ulaşabilir; ancak bu hedefin kesin zamanı belirsizdir.
HOT coin 1 $'a ulaşır mı?
Mevcut tahminlere göre, HOT coin'in kısa vadede 1 $ seviyesine çıkması beklenmemektedir. Öngörüler, 2029'da yaklaşık 0,25 $ ile zirve yapabileceğini, ancak uzun vadeli projeksiyonların belirsiz olduğunu göstermektedir.
Share
Content
Giriş: MORE'un Piyasadaki Konumu ve Yatırım Potansiyeli
I. MORE Fiyat Geçmişi ve Güncel Piyasa Durumu
II. MORE'un Gelecek Fiyatını Etkileyen Temel Unsurlar
III. 2025-2030 MORE Fiyat Tahmini
IV. MORE Profesyonel Yatırım Stratejileri ve Risk Yönetimi
V. MORE İçin Olası Riskler ve Zorluklar
VI. Sonuç ve Eylem Önerileri
Sıkça Sorulan Sorular
How to Buy Cryptocurrency


Trending Cryptocurrencies


2025 OL Fiyat Tahmini: Olympus DAO’nun Piyasa Trendleri ve Gelecek Öngörüleri

2025 DELABS Fiyat Tahmini: Yükselen Kripto Para Birimi İçin Piyasa Trendleri ve Olası Büyüme Etkenlerinin Analizi

2025 G3 Fiyat Tahmini: Elektrikli Lüks SUV’lerin Geleceğinde Yolculuk
2025 GO4 Fiyat Tahmini: Piyasa Trendleri ve Olası Değer Artışının Analizi
Pump.Fun (PUMP) Token: 2025'te Gate'de Yeni Web3 Oyun Fırsatı
2025 B3 Fiyat Tahmini: Uzman Analizi ve Brezilya Borsası Performansına Yönelik Tahmin

Anoma Ağı Niyet Odaklı Dağıtık İşletim Sistemi Çoklu Zincir Birlikte Çalışabilirlik

Aster Merkeziyetsiz Sürekli Sözleşme ve Çok Zincirli Türevler Ticaret Platformu

Web3 dünyasında NFT dijital sanatına yönelik önde gelen platformları keşfetmek
Kriptoda Farcaster Protokolü’nü Anlamak
Bitcoin Birimlerinin Açıklaması: Satoshi Dönüştürme Kılavuzu
