2025 GT Price Prediction: Analyzing Market Trends and Potential Growth Factors for Gran Turismo's Future
Introduction: GT's Market Position and Investment Value
GateToken (GT) has established itself as a key player in the blockchain ecosystem since its inception in 2019, achieving significant milestones in user asset security and decentralized transactions. As of 2025, GT's market capitalization has reached $1.91 billion, with a circulating supply of approximately 117,344,473 tokens and a price hovering around $16.26. This asset, often referred to as the "revolutionary blockchain solution," is playing an increasingly crucial role in enhancing asset security and facilitating decentralized trading.
This article will provide a comprehensive analysis of GT's price trends from 2025 to 2030, considering historical patterns, market supply and demand, ecosystem development, and macroeconomic factors to offer professional price predictions and practical investment strategies for investors.
I. GT Price History Review and Current Market Status
GT Historical Price Evolution
- 2020: GT hit its all-time low of $0.25754 on March 13, amid the global market crash
- 2022: GT reached its all-time high of $25.94 on January 25, during the crypto bull market
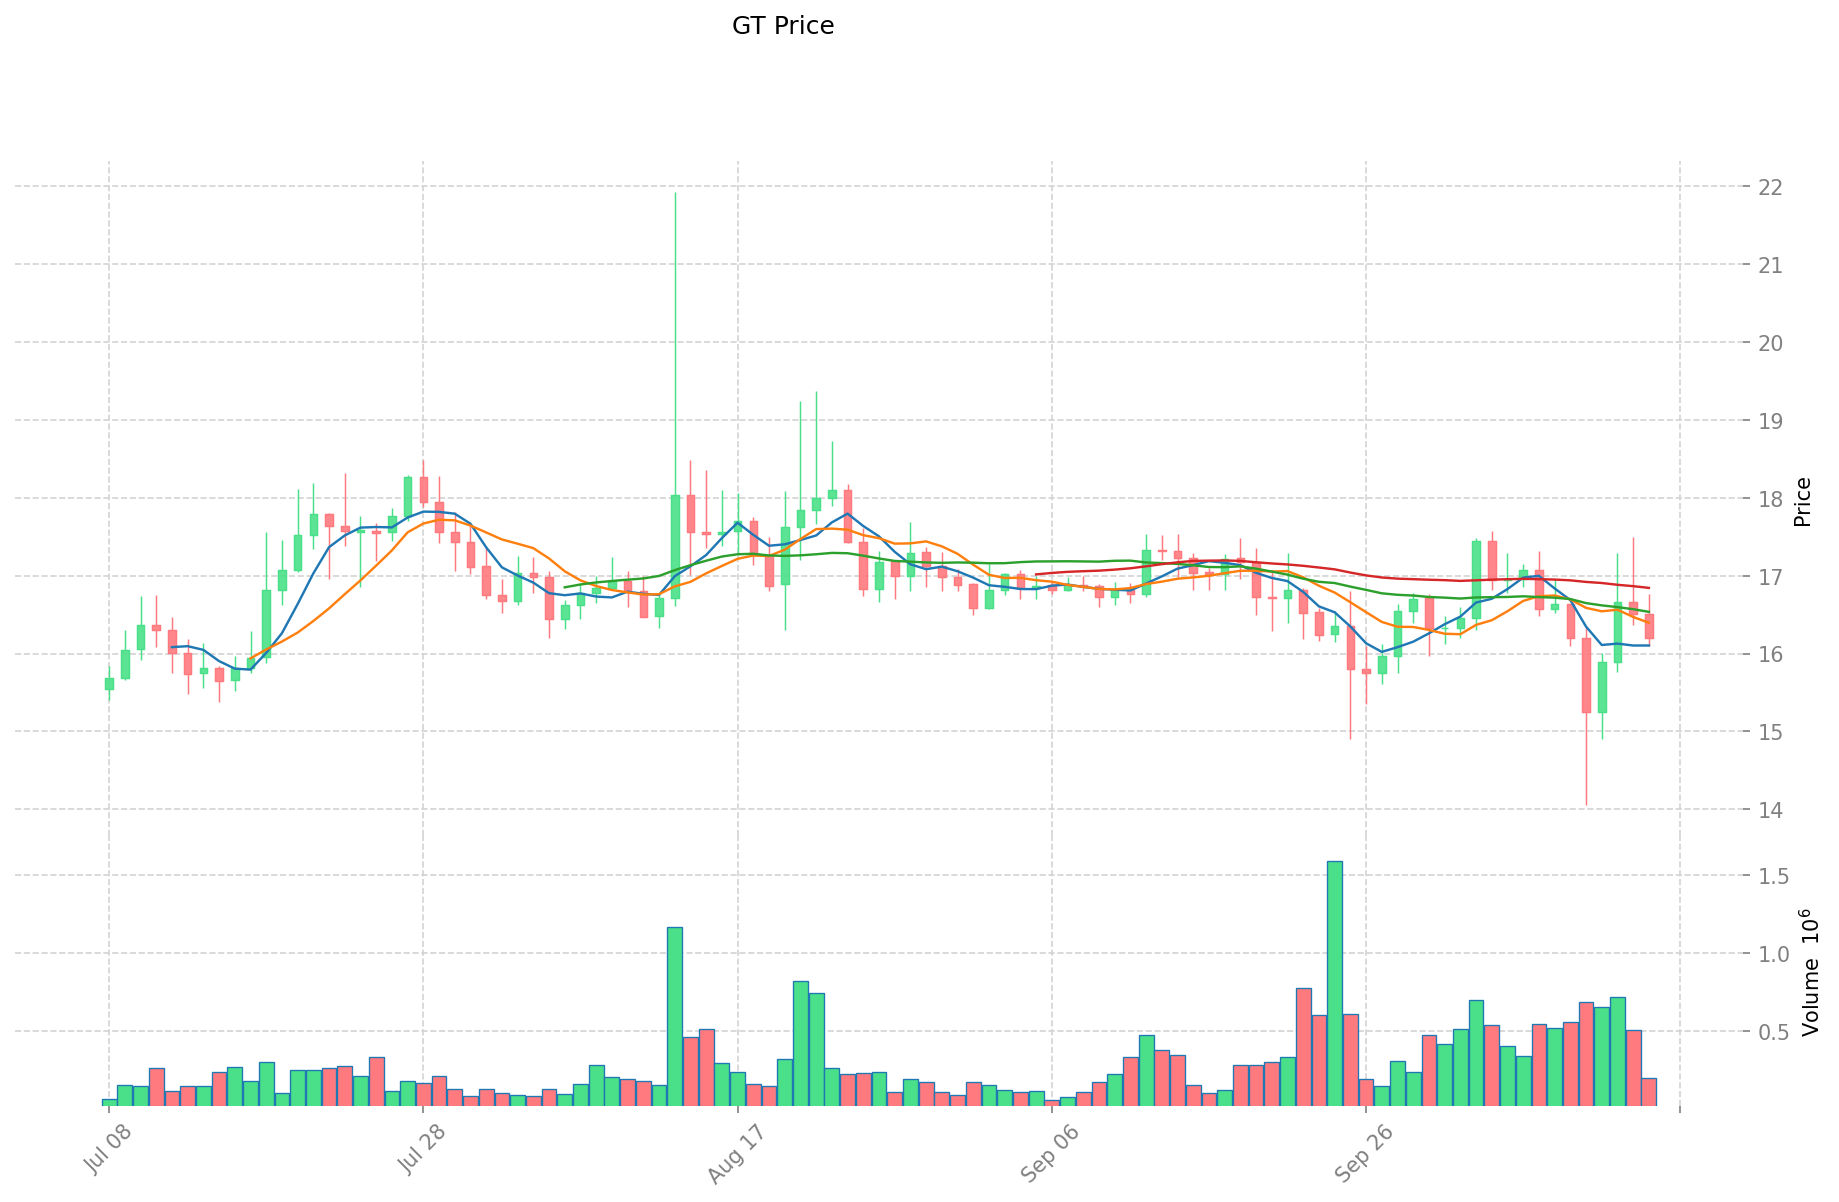
- 2025: GT has maintained a relatively stable price range, currently trading at $16.262
GT Current Market Situation
GT is currently trading at $16.262, with a 24-hour trading volume of $3,092,096.59. The token has experienced a 2.78% decrease in the last 24 hours. GT's market capitalization stands at $1,908,255,828.56, ranking it 61st in the overall cryptocurrency market.
The circulating supply of GT is 117,344,473.53 tokens, which represents 39.11% of the maximum supply of 300,000,000 tokens. Over the past year, GT has shown significant growth, with a 74.48% increase in value.
Despite the recent 24-hour dip, GT has demonstrated positive short-term performance with a 0.4% increase in the last hour. However, the token has experienced declines of 2.88% and 5.37% over the past 7 and 30 days, respectively.
Click to view the current GT market price
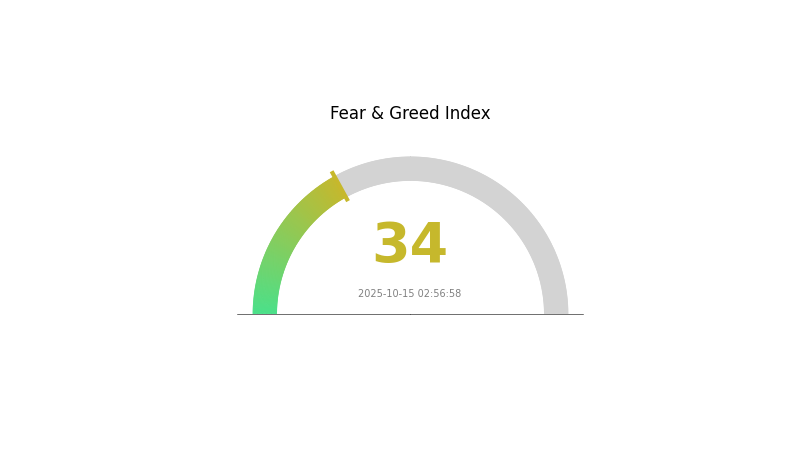
GT Market Sentiment Indicator
2025-10-15 Fear and Greed Index: 34 (Fear)
Click to view the current Fear & Greed Index
The crypto market is showing signs of caution today, with the Fear and Greed Index at 34, indicating a fearful sentiment. This suggests investors are becoming more risk-averse, potentially due to market uncertainties or recent price fluctuations. During such periods, some traders may see opportunities for accumulation, while others might prefer to wait for clearer market direction. As always, it's crucial to conduct thorough research and manage risks wisely when making investment decisions in the volatile crypto space.
GT Holdings Distribution
The address holdings distribution data provides crucial insights into the concentration of GT tokens among various addresses. Analysis of this data reveals a highly concentrated distribution pattern, with the top 5 addresses controlling 99.46% of the total GT supply. The leading address alone holds 60.18% of all tokens, indicating a significant concentration of ownership.
This level of concentration raises concerns about potential market manipulation and price volatility. With such a large portion of tokens held by a few addresses, any significant movement or sell-off could have a substantial impact on GT's market price and liquidity. Furthermore, this concentration may affect the token's decentralization goals and governance structure, as a small number of large holders could potentially exert disproportionate influence over decision-making processes.
From a market structure perspective, the current distribution suggests a relatively low level of on-chain stability and a higher risk of price fluctuations. While this concentration might provide some short-term price support, it also presents long-term challenges for achieving wider token distribution and fostering a more robust, decentralized ecosystem for GT.
Click to view the current GT Holdings Distribution
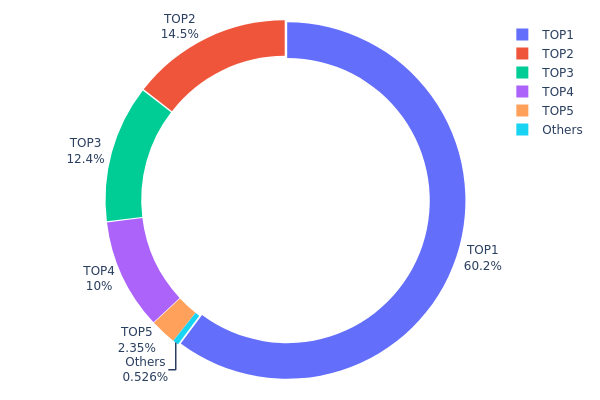
| Top | Address | Holding Qty | Holding (%) |
|---|---|---|---|
| 1 | 0x2b8f...95f308 | 180555.11K | 60.18% |
| 2 | 0x1c4b...bb558c | 43560.34K | 14.52% |
| 3 | 0xc882...84f071 | 37267.47K | 12.42% |
| 4 | 0x9bbe...252b19 | 30000.00K | 10.00% |
| 5 | 0xaaac...3dca17 | 7038.97K | 2.34% |
| - | Others | 1578.10K | 0.53999999999999% |
II. Key Factors Affecting GT's Future Price
Supply Mechanism
- Token Burning: GT implements a continuous token burning strategy, reducing the circulating supply and increasing scarcity. By the end of 2024, 174 million GT tokens had been burned.
- Historical Impact: The token burning mechanism has historically contributed to GT's price appreciation.
- Current Effect: The ongoing reduction in supply is expected to maintain upward pressure on GT's price due to increased scarcity.
Institutional and Whale Dynamics
- Corporate Adoption: As Gate.com's platform token, GT's adoption is closely tied to the exchange's growth and user base expansion.
Macroeconomic Environment
- Inflation Hedge Properties: GT, like other cryptocurrencies, may be viewed as a potential hedge against inflation in certain economic conditions.
Technological Development and Ecosystem Building
- Platform Growth: The continued development and expansion of Gate.com's services and user base directly impact GT's utility and demand.
- Ecosystem Applications: GT's value is intrinsically linked to its utility within the Gate.com ecosystem, including trading fee discounts and participation in platform activities.
III. GT Price Prediction for 2025-2030
2025 Outlook
- Conservative prediction: $12.99 - $15.00
- Neutral prediction: $15.00 - $16.24
- Optimistic prediction: $16.24 - $17.05 (requires favorable market conditions)
2027 Mid-term Outlook
- Market phase expectation: Potential growth phase
- Price range forecast:
- 2026: $9.49 - $20.31
- 2027: $15.15 - $22.36
- Key catalysts: Increasing adoption of Gate.com platform and GT token utility
2030 Long-term Outlook
- Base scenario: $22.00 - $26.51 (assuming steady market growth)
- Optimistic scenario: $26.51 - $31.28 (assuming strong crypto market performance)
- Transformative scenario: $31.28+ (extreme favorable conditions in crypto adoption)
- 2030-12-31: GT $31.28 (potential peak price)
| 年份 | 预测最高价 | 预测平均价格 | 预测最低价 | 涨跌幅 |
|---|---|---|---|---|
| 2025 | 17.0541 | 16.242 | 12.9936 | 0 |
| 2026 | 20.31062 | 16.64805 | 9.48939 | 2 |
| 2027 | 22.36 | 18.47934 | 15.15306 | 13 |
| 2028 | 27.56655 | 20.41967 | 15.92734 | 25 |
| 2029 | 29.03166 | 23.99311 | 22.31359 | 47 |
| 2030 | 31.28461 | 26.51238 | 22.00528 | 63 |
IV. GT Professional Investment Strategies and Risk Management
GT Investment Methodology
(1) Long-term Holding Strategy
- Suitable for: Risk-tolerant investors with a long-term outlook
- Operation suggestions:
- Accumulate GT tokens during market dips
- Set price targets for partial profit-taking
- Store tokens securely in Gate Web3 wallet
(2) Active Trading Strategy
- Technical analysis tools:
- Moving Averages: Use to identify trends and potential reversal points
- Relative Strength Index (RSI): Monitor overbought/oversold conditions
- Key points for swing trading:
- Monitor GT's correlation with broader crypto market trends
- Set stop-loss orders to manage downside risk
GT Risk Management Framework
(1) Asset Allocation Principles
- Conservative investors: 1-3% of crypto portfolio
- Moderate investors: 3-7% of crypto portfolio
- Aggressive investors: 7-15% of crypto portfolio
(2) Risk Hedging Solutions
- Diversification: Balance GT holdings with other crypto assets
- Stop-loss orders: Implement to limit potential losses
(3) Secure Storage Solutions
- Hot wallet recommendation: Gate Web3 wallet
- Cold storage solution: Hardware wallet for long-term holdings
- Security precautions: Enable two-factor authentication, use strong passwords
V. Potential Risks and Challenges for GT
GT Market Risks
- Volatility: Crypto market fluctuations can impact GT price
- Competition: Emerging blockchain projects may challenge GateChain's market position
- Liquidity: Changes in trading volume could affect price stability
GT Regulatory Risks
- Global regulations: Evolving crypto regulations may impact GT's utility and adoption
- Compliance requirements: Increased KYC/AML measures could affect user base
- Tax implications: Changing tax laws may influence investor behavior
GT Technical Risks
- Network security: Potential vulnerabilities in GateChain infrastructure
- Scalability challenges: Future growth may test network capacity
- Smart contract risks: Bugs or exploits in GateChain's smart contracts
VI. Conclusion and Action Recommendations
GT Investment Value Assessment
GT presents a unique value proposition in the blockchain space, focusing on asset security and decentralized transactions. While it offers long-term potential, short-term volatility and regulatory uncertainties pose risks.
GT Investment Recommendations
✅ Beginners: Start with small, regular investments to understand market dynamics ✅ Experienced investors: Consider a balanced approach, combining long-term holding with strategic trading ✅ Institutional investors: Evaluate GT as part of a diversified crypto portfolio, focusing on its unique features and ecosystem growth
GT Participation Methods
- Spot trading: Buy and sell GT on Gate.com's spot market
- Staking: Participate in GateChain's staking program for potential rewards
- Ecosystem engagement: Explore GateChain's DApps and services to understand GT's utility
Cryptocurrency investments carry extremely high risks, and this article does not constitute investment advice. Investors should make decisions carefully based on their own risk tolerance and are advised to consult professional financial advisors. Never invest more than you can afford to lose.
FAQ
What is the price target for GT?
Based on current forecasts, the price target for GT ranges from $9.00 to $17.00, with an average target suggesting a 78.17% upside by 2025.
What is the price prediction for GT coin in 2025?
GT coin price is predicted to reach $19-$39 in 2025, based on current market analysis and expert forecasts.
What is the price prediction for NVDA in 2030?
Based on current projections, NVDA's price is predicted to reach $265.35 by 2030, representing a 41.61% increase from today's price.
What is the price prediction for GRT 2026?
GRT is predicted to reach $13.15-$15.15 in 2026, with an average price of $14.17, based on current market analysis.
Share
Content