2025 GAI Fiyat Tahmini: Gelişen dijital ekonomide GAI'nin piyasa trendleri ve gelecekteki değerlemesini analiz etmek

Giriş: GAI’nin Piyasa Konumu ve Yatırım Potansiyeli
GraphAI (GAI), Web3 ekosisteminde yapay zekâ tabanlı veri katmanını inşa eden öncü bir proje olarak, kuruluşundan bu yana kayda değer ilerlemeler göstermektedir. 2025 yılı itibarıyla GAI’nin piyasa değeri 18.130.000 dolara ulaşmış, yaklaşık 70.000.000 token dolaşımda bulunmakta ve fiyatı 0,259 dolar civarında seyretmektedir. Sıklıkla “blokzincir ile yapay zekâ arasındaki köprü” olarak nitelendirilen bu varlık, blokzincir üzerindeki ham verileri, yapılandırılmış ve sorgulanabilir bilgi grafiklerine dönüştürerek kritik bir dönüşüm sağlamaktadır.
Bu makalede, GAI’nin 2025-2030 yılları arasındaki fiyat hareketleri; tarihsel eğilimler, arz-talep dengesi, ekosistem gelişimi ve makroekonomik faktörler ekseninde detaylı biçimde analiz edilerek yatırımcılara profesyonel fiyat tahminleri ve uygulanabilir yatırım stratejileri sunulacaktır.
I. GAI Fiyat Geçmişi ve Güncel Piyasa Durumu
GAI Fiyatının Tarihsel Seyri
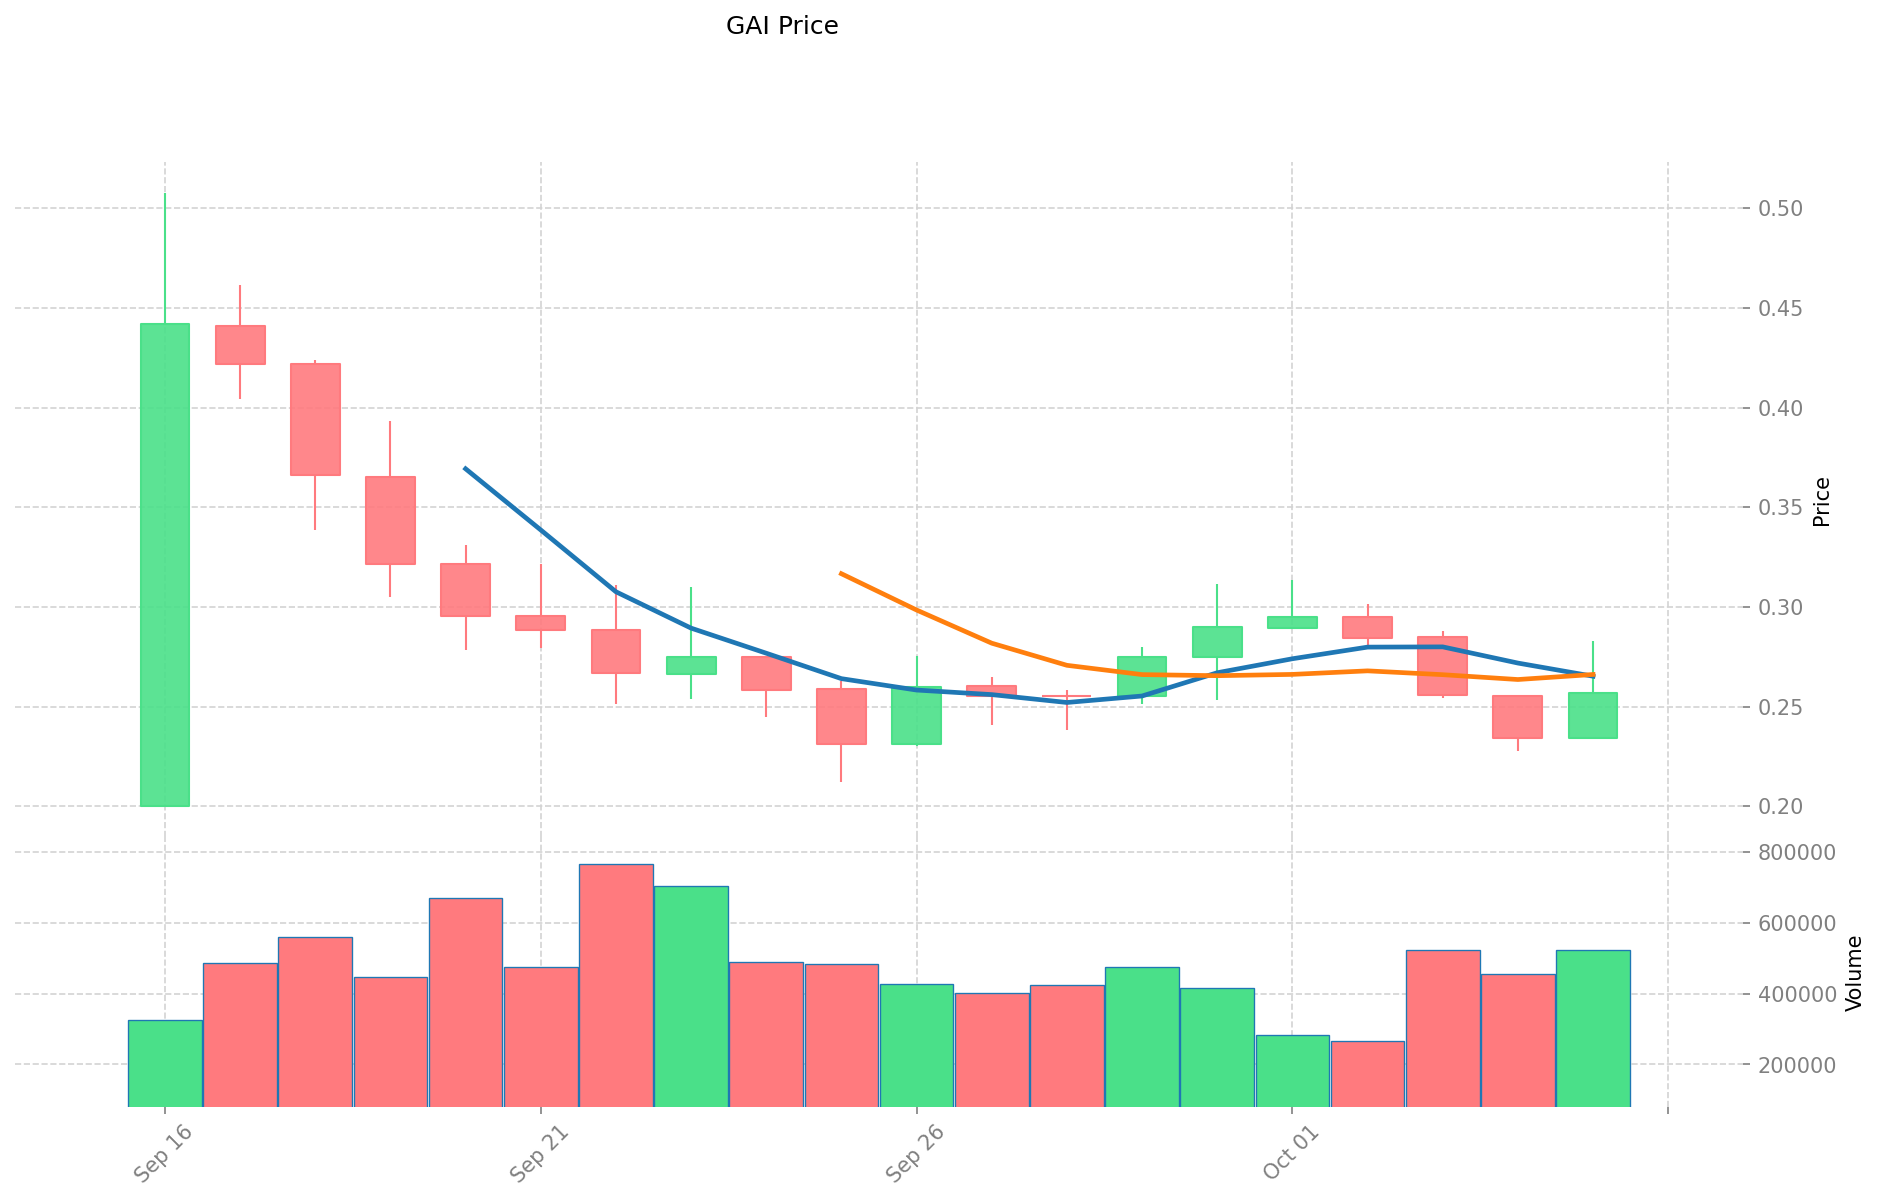
- 2025: İlk çıkışında fiyat 0,2 ile 0,5078 dolar arasında dalgalandı
GAI'nin Güncel Piyasa Durumu
6 Ekim 2025 itibarıyla GAI, 0,259 dolardan işlem görürken, 24 saatlik işlem hacmi 129.444,58 dolara ulaştı. Token, son 24 saatte %7,96 değer kazandı. GAI’nin piyasa değeri şu anda 18.130.000 dolar olup, kripto para piyasasında 1.151. sıradadır.
Token’ın tüm zamanların en yüksek seviyesi olan 0,5078 dolar ve en düşük seviyesi olan 0,2 dolar, her ikisi de 16 Eylül 2025’te kaydedildi; bu da kısa bir işlem geçmişine işaret ediyor. GAI, farklı zaman dilimlerinde karma bir performans gösterdi; son bir saatte %0,47 yükseliş, son 24 saatte %7,96 artış, son bir haftada %0,65 düşüş ve son 30 günde %15,15 oranında daha belirgin bir gerileme yaşandı.
GAI’nin dolaşımdaki arzı 70.000.000 token olup, toplam arzın %70’ine karşılık gelmektedir (toplam arz: 100.000.000 token). Tam seyreltilmiş piyasa değeri ise 25.900.000 dolardır.
Güncel GAI piyasa fiyatını görmek için tıklayın
GAI Piyasa Duyarlılık Endeksi
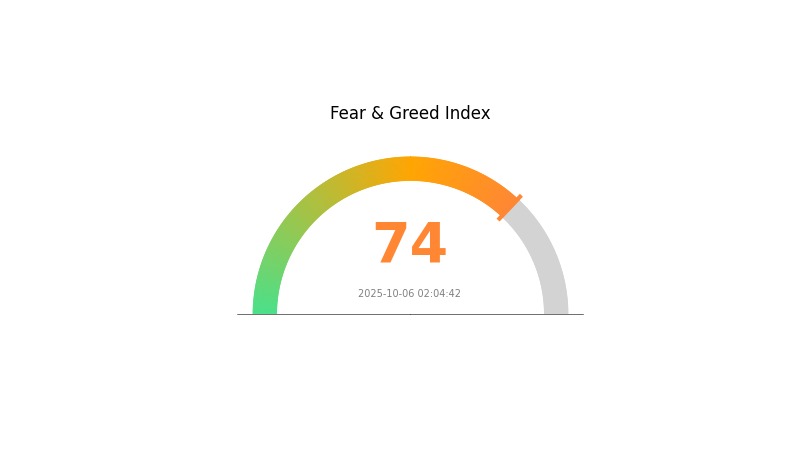
06 Ekim 2025 Korku ve Açgözlülük Endeksi: 74 (Açgözlülük)
Güncel Korku & Açgözlülük Endeksi için tıklayın
Kripto piyasasında Korku ve Açgözlülük Endeksi’nin 74 değerine ulaşmasıyla birlikte ciddi bir açgözlülük eğilimi gözleniyor. Bu tür yükseliş eğilimleri genellikle alım baskısının artmasını ve varlıkların yüksek değerlenmesini tetikleyebilir. Fırsatlar artsa da, yatırımcıların FOMO etkisiyle ani kararlar vermekten kaçınması önemlidir. Unutmayın, piyasalar öngörülemezdir; yükselen her varlık bir noktada gerileyebilir. Portföyünüzü çeşitlendirin, net kâr hedefleri oluşturun. Bilgili hareket edin, riskleri dikkatle yönetin ve yatırım kararınızı vermeden önce mutlaka kendi araştırmanızı yapın.
GAI Varlık Dağılımı
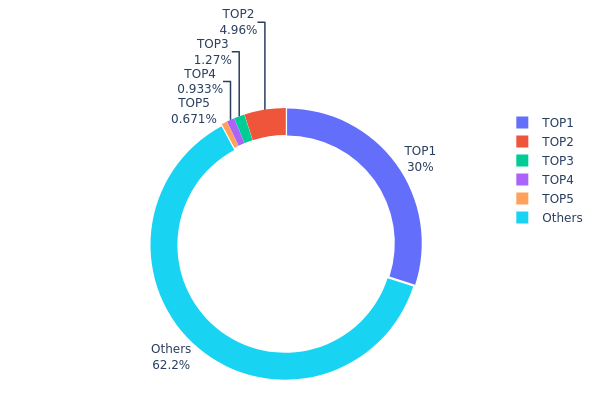
Adres bazlı varlık dağılımı, GAI tokenlarının adresler arasındaki yoğunlaşmasını anlamak için kritik bilgiler sağlar. En büyük adres toplam arzın %29,99’unu elinde tutarken, bu ciddi bir yoğunlaşmaya işaret etmektedir. İkinci en büyük adresin payı %4,95 olup, ilk 5 adresin her biri %0,67 ile %1,26 arasında tokena sahiptir. İlk 5 adres, toplam arzın %37,8’ini elinde bulundururken, geri kalan %62,2 diğer adreslere dağılmıştır.
Bu dağılım, özellikle en büyük adresin baskın konumu nedeniyle orta düzeyde bir merkezileşmeye işaret eder. Böyle bir yoğunlaşma, piyasa dinamiklerini, fiyat dalgalanmasını ve likiditeyi etkileyebilir. Tek bir adresin arzın neredeyse %30’unu tutması, piyasa manipülasyonuna dair endişeleri artırır. Bununla birlikte, tokenlerin %60’tan fazlasının daha küçük adreslerde bulunması, ekosistemin daha geniş bir kullanıcı tabanına yayıldığını gösterir.
Piyasa yapısı açısından bu dağılım, merkezi kontrol ile yaygın katılım arasında bir denge sunar. En büyük sahipler önemli bir etkiye sahipken, küçük adreslerin yüksek oranı aktif ve çeşitli bir ekosistem anlamına gelir. Bu yapı, piyasa istikrarını destekleyebilir; ancak büyük token hareketlerine karşı dikkatli olunmalıdır.
Güncel GAI Varlık Dağılımı için tıklayın
| Üst | Adres | Varlık Miktarı | Varlık (%) |
|---|---|---|---|
| 1 | 0xb5d7...e0fe3b | 29.990,57K | 29,99% |
| 2 | 0xf3d4...d58355 | 4.957,42K | 4,95% |
| 3 | 0x36cc...75414f | 1.269,00K | 1,26% |
| 4 | 0x4e3a...a31b60 | 933,31K | 0,93% |
| 5 | 0xb4b0...cb8812 | 671,43K | 0,67% |
| - | Diğerleri | 62.178,28K | 62,2% |
II. GAI'nin Gelecekteki Fiyatını Belirleyen Temel Faktörler
Arz Mekanizması
- Merkez Bankası Altın Alımları: Merkez bankaları altın rezervlerini artırmayı sürdürerek fiziksel talebi güçlendiriyor ve piyasaya olumlu sinyaller veriyor.
- Tarihsel Eğilim: Geçmişte merkez bankası altın varlıklarındaki artışlar genellikle altın fiyatlarını yukarı çekmiştir.
- Mevcut Etki: Merkez bankalarının altın birikimi eğilimi, altın fiyatlarına uzun vadeli destek sunması beklenmektedir.
Kurumsal ve Büyük Yatırımcı Dinamikleri
- Kurumsal Varlıklar: Altın ETF varlıkları artmakta olup, dünyanın en büyük altın ETF’si son üç yılın en yüksek seviyesine ulaşmıştır; bu, Avrupa ve ABD fonlarından artan girişleri göstermektedir.
- Ulusal Politikalar: Özellikle ABD’de korumacı ticaret politikaları uygulanmakta; bu politikalar küresel ticaret yapısını ve ekonomik istikrarı etkiliyor.
Makroekonomik Ortam
- Para Politikası Etkisi: ABD Merkez Bankası’nın Eylül 2025’te faiz indirimi başlatması bekleniyor; bu adım ABD dolarını zayıflatabilir ve altın fiyatlarını destekleyebilir.
- Enflasyona Karşı Koruma: Altın, potansiyel stagflasyon risklerine karşı koruma aracı olarak değerlendiriliyor; yüksek enflasyon ve yavaş ekonomik büyüme öngörülüyor.
- Jeopolitik Faktörler: Jeopolitik gerilimler, ticaret çatışmaları ve bölgesel anlaşmazlıklar altının güvenli liman özelliğini güçlendiriyor.
Teknolojik Gelişim ve Ekosistem Oluşumu
- De-dolarizasyon Eğilimi: Küresel ölçekte ABD dolarına bağımlılığın azalması, altının krediye dayalı olmayan güvenli liman ve değer saklama aracı olarak rolünü artırıyor.
III. 2025-2030 İçin GAI Fiyat Tahminleri
2025 Görünümü
- Temkinli tahmin: 0,13621 - 0,20 dolar
- Tarafsız tahmin: 0,20 - 0,30 dolar
- İyimser tahmin: 0,30 - 0,36751 dolar (piyasa toparlanması ve benimsenme artışı gerektirir)
2027-2028 Görünümü
- Piyasa aşaması beklentisi: Benimsenmenin arttığı büyüme dönemi
- Fiyat aralığı tahmini:
- 2027: 0,27728 - 0,52459 dolar
- 2028: 0,27428 - 0,643 dolar
- Temel katalizörler: Teknolojik ilerlemeler, daha geniş sektör entegrasyonu ve olumlu regülasyonlar
2029-2030 Uzun Vadeli Görünüm
- Temel senaryo: 0,54632 - 0,60642 dolar (istikrarlı piyasa büyümesi ve projenin gelişimi varsayımıyla)
- İyimser senaryo: 0,60642 - 0,66651 dolar (hızlı benimsenme ve pozitif piyasa koşulları varsayımıyla)
- Dönüştürücü senaryo: 0,66651 - 0,70 dolar (çığır açan inovasyonlar ve ana akım benimsenme varsayımıyla)
- 2030-12-31: GAI 0,63674 dolar (yıl sonu konsolidasyon öncesi potansiyel zirve)
| Yıl | Tahmini En Yüksek Fiyat | Tahmini Ortalama Fiyat | Tahmini En Düşük Fiyat | Değişim Oranı |
|---|---|---|---|---|
| 2025 | 0,36751 | 0,257 | 0,13621 | 0 |
| 2026 | 0,43716 | 0,31226 | 0,18111 | 20 |
| 2027 | 0,52459 | 0,37471 | 0,27728 | 44 |
| 2028 | 0,643 | 0,44965 | 0,27428 | 73 |
| 2029 | 0,66651 | 0,54632 | 0,51901 | 110 |
| 2030 | 0,63674 | 0,60642 | 0,33959 | 134 |
IV. GAI için Yatırım Stratejileri ve Risk Yönetimi
GAI Yatırım Yöntemi
(1) Uzun Vadeli Tutma Stratejisi
- Kimler için uygun: Yapay zekâ ve blokzincir entegrasyonuna inanan uzun vadeli yatırımcılar
- Uygulama önerileri:
- Piyasa düşüşlerinde GAI token biriktirin
- Kısmi kâr için fiyat hedefleri oluşturun
- Tokenlerinizi güvenli, saklama hizmeti sunmayan cüzdanlarda saklayın
(2) Aktif Alım-Satım Stratejisi
- Teknik analiz araçları:
- Hareketli Ortalamalar: Kısa ve uzun vadeli eğilimleri takip edin
- RSI: Aşırı alım ve aşırı satım seviyelerini belirleyin
- Dalgalı alım-satım için kilit noktalar:
- Kritik direnç seviyeleri üzerinde kırılmaları izleyin
- Zarar-durdur emirleriyle aşağı yönlü riski yönetin
GAI Risk Yönetimi Çerçevesi
(1) Varlık Dağılımı İlkeleri
- Temkinli yatırımcılar: Kripto portföyünün %1-3’ü
- Aggresif yatırımcılar: Portföyün %5-10’u
- Profesyonel yatırımcılar: Portföyün en fazla %15’i
(2) Riskten Korunma Çözümleri
- Çeşitlendirme: GAI’yi diğer kripto varlıklarla dengeleyin
- Zarar-durdur emirleri: Potansiyel kayıpları sınırlamak için otomatik satış emirleri kullanın
(3) Güvenli Saklama Çözümleri
- Saklama hizmeti sunmayan cüzdan önerisi: Gate Web3 Cüzdan
- Donanım cüzdan seçeneği: Uzun vadeli tutum için soğuk depolama
- Güvenlik önlemleri: İki aşamalı doğrulama kullanın, güçlü şifreler tercih edin
V. GAI için Olası Riskler ve Zorluklar
GAI Piyasa Riskleri
- Dalgalanma: Kripto piyasasındaki oynaklık GAI fiyatını etkileyebilir
- Rekabet: Yeni yapay zekâ-blokzincir projeleri ortaya çıkabilir
- Benimsenme: Yapay zekâ entegrasyonunun yavaş ilerlemesi talebi azaltabilir
GAI Regülasyon Riskleri
- Düzenleyici belirsizlik: Değişen kripto regülasyonları GAI’yi etkileyebilir
- Sınır ötesi kısıtlamalar: Uluslararası regülasyonlar kullanımı sınırlayabilir
- Yapay zekâ düzenlemeleri: Gelecekteki regülasyonlar GraphAI’nin faaliyetlerine etki edebilir
GAI Teknik Riskleri
- Akıllı sözleşme açıkları: GAI tokeninde güvenlik riskleri oluşabilir
- Ölçeklenebilirlik zorlukları: GraphEngine ölçeklenme sorunlarıyla karşılaşabilir
- Yapay zekâ entegrasyonu karmaşıklığı: Blokzincir ve yapay zekâ birleşiminde beklenmeyen engeller çıkabilir
VI. Sonuç ve Eylem Önerileri
GAI Yatırım Değeri Analizi
GAI, yapay zekâ ve blokzincir kesişiminde benzersiz bir değer önerisi sunuyor. Uzun vadeli potansiyeli yüksek olsa da, kısa vadede oynaklık ve benimsenme riskleri devam etmektedir.
GAI Yatırım Tavsiyeleri
✅ Yeni başlayanlar: Küçük, uzun vadeli pozisyon alın ve maliyet ortalaması uygulayın
✅ Deneyimli yatırımcılar: Dengeli ve aktif yönetim stratejisi kullanın
✅ Kurumsal yatırımcılar: Stratejik ortaklıklar ve büyük pozisyonları değerlendirin
GAI Alım-Satım Katılım Yöntemleri
- Spot işlem: Gate.com üzerinden GAI token alın ve tutun
- Staking: GAI staking programlarına katılım sağlayın
- DeFi entegrasyonu: GAI’yi merkeziyetsiz finans uygulamalarında değerlendirin
Kripto para yatırımları son derece yüksek risk taşır; bu makale yatırım tavsiyesi değildir. Yatırımcılar, kendi risk toleranslarına göre dikkatli karar vermeli ve profesyonel finans danışmanlarından destek almalıdır. Asla kaybetmeyi göze alabileceğinizden fazlasını yatırmayın.
Share
Content
Giriş: GAI’nin Piyasa Konumu ve Yatırım Potansiyeli
I. GAI Fiyat Geçmişi ve Güncel Piyasa Durumu
II. GAI'nin Gelecekteki Fiyatını Belirleyen Temel Faktörler
III. 2025-2030 İçin GAI Fiyat Tahminleri
IV. GAI için Yatırım Stratejileri ve Risk Yönetimi
V. GAI için Olası Riskler ve Zorluklar
VI. Sonuç ve Eylem Önerileri
How to Buy Cryptocurrency


Trending Cryptocurrencies


Flock.io (FLOCK) yatırım için uygun mu? Bu yeni kripto projesinin potansiyeli ve riskleri nasıl değerlendirilmeli?
Sahara AI (SAHARA) iyi bir yatırım mı?: Bu yükselen yapay zeka kripto parasının potansiyelini ve risklerini inceliyoruz

Trusta.AI (TA) Yatırım İçin Uygun mu?: AI Güvenlik Token’inin Piyasa Potansiyeli ve Uzun Vadeli Büyüme Perspektiflerinin Analizi

2025 VADER Fiyat Tahmini: Kripto Para Dünyasında Piyasa Trendleri ve Potansiyel Büyüme Faktörlerinin Analizi

2025 MASA Fiyat Tahmini: Piyasa Trendleri ve Olası Büyüme Faktörlerinin Analizi
2025 AI16Z Fiyat Tahmini: Dalgalı Piyasalarda Yapay Zeka Destekli Kripto Paraların Geleceğinde Yol Almak
OpenEden Gerçek Dünya Varlık Tokenizasyon Platformu ve EDEN Token Ekonomisi
Anoma Ağı Niyet Odaklı Dağıtık İşletim Sistemi Çoklu Zincir Birlikte Çalışabilirlik
Aster Merkeziyetsiz Sürekli Sözleşme ve Çok Zincirli Türevler Ticaret Platformu
Web3 dünyasında NFT dijital sanatına yönelik önde gelen platformları keşfetmek

Kriptoda Farcaster Protokolü’nü Anlamak
