2025 DOT Fiyat Tahmini: Polkadot, Artan Benimsenmeyle 100 Dolar Seviyesine Ulaşacak mı?


Giriş: DOT'un Piyasa Konumu ve Yatırım Potansiyeli
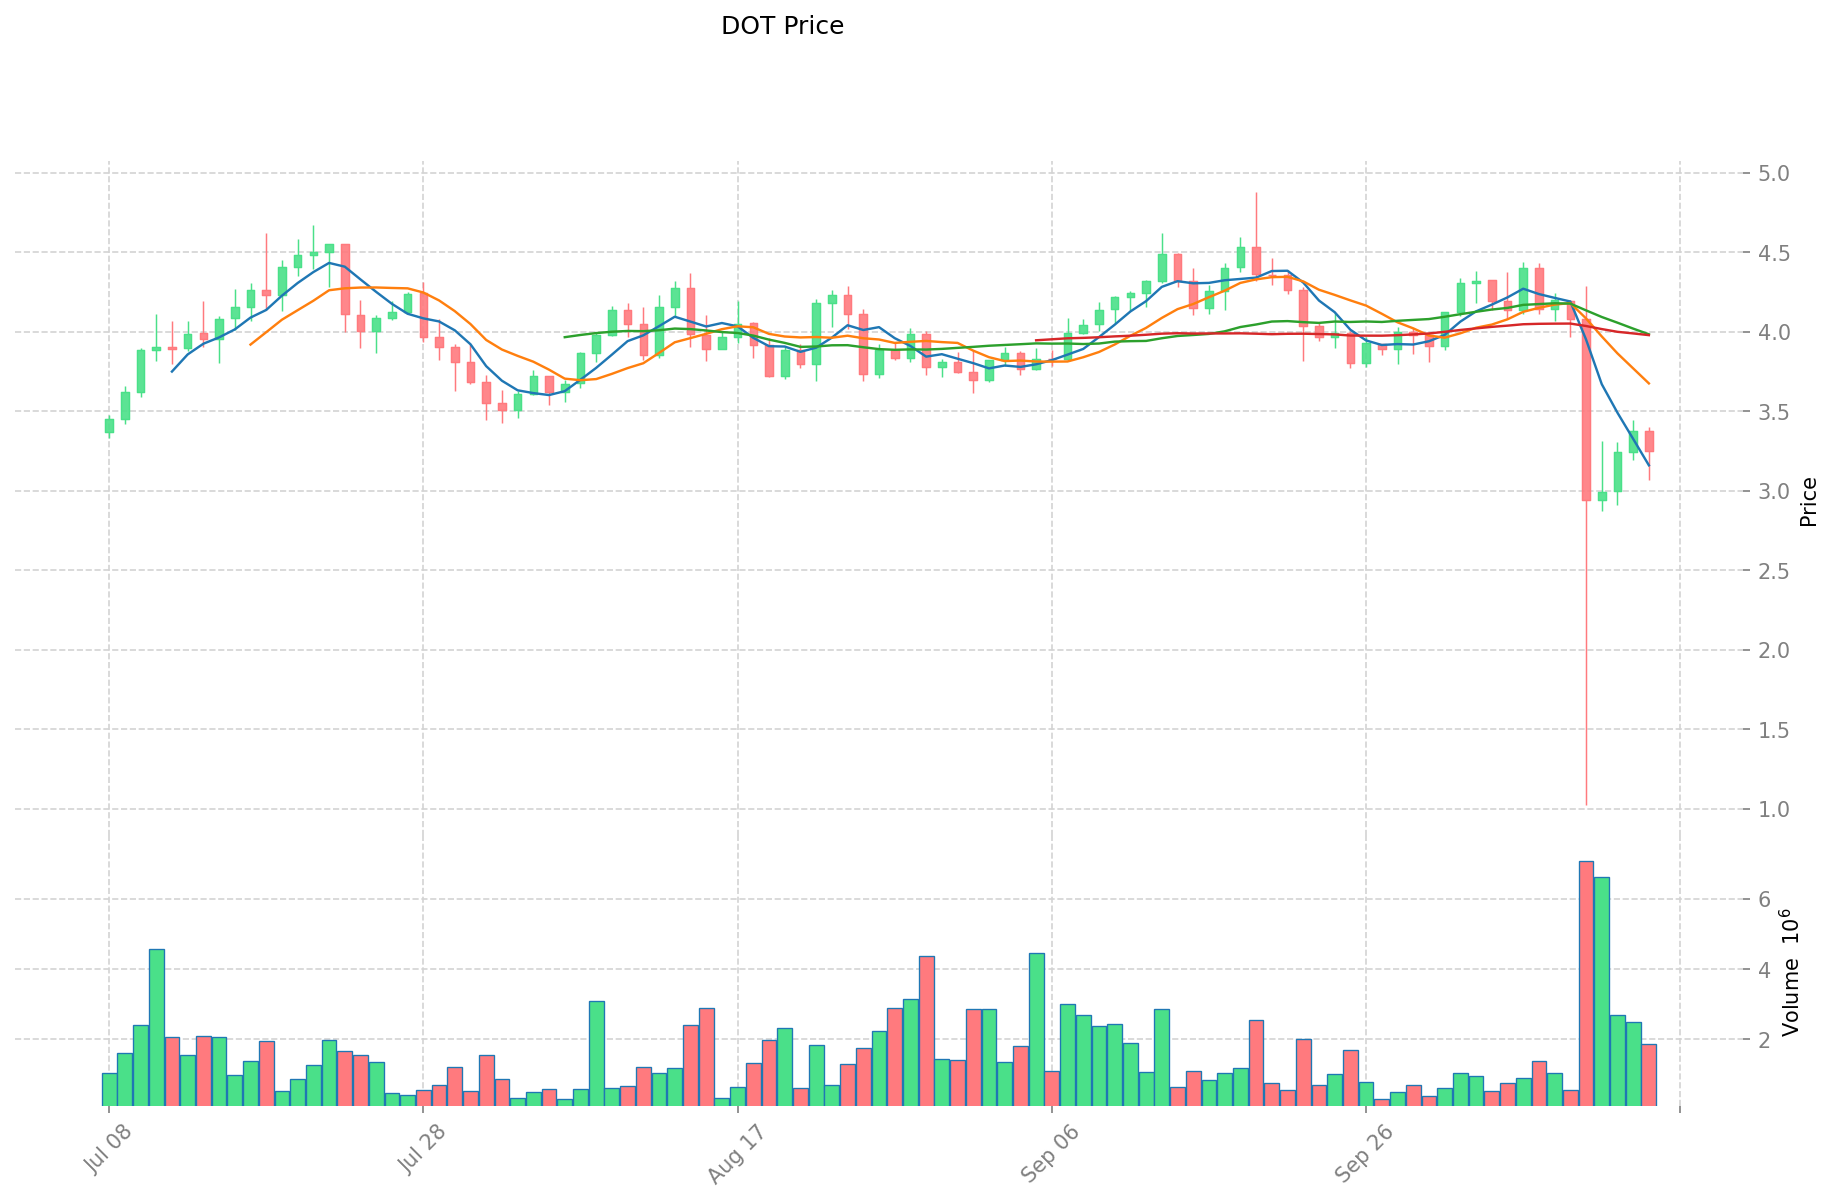
Polkadot (DOT), blokzincirler arası etkileşimde lider bir platform olarak, 2020 yılındaki başlangıcından bu yana önemli başarılar elde etti. 2025 itibarıyla Polkadot'un piyasa değeri $4.921.489.404,98'e ulaştı; yaklaşık 1.522.267.060 dolaşımdaki token mevcut ve fiyatı $3,233 civarında seyrediyor. "Blokzincirlerin İnterneti" olarak bilinen bu varlık, farklı blokzincir ağlarının birbirine bağlanmasında ve zincirler arası iletişimin kolaylaştırılmasında giderek daha önemli bir rol üstleniyor.
Bu makalede, Polkadot'un 2025-2030 yılları arasındaki fiyat hareketleri; geçmiş performanslar, arz-talep dengesi, ekosistem gelişimi ve makroekonomik etkenler ışığında detaylı şekilde incelenecek, yatırımcılara profesyonel fiyat tahminleri ve uygulanabilir yatırım stratejileri sunulacaktır.
I. DOT Fiyat Geçmişi ve Mevcut Piyasa Durumu
DOT Tarihsel Fiyat Seyri
- 2020: Polkadot ana ağ lansmanı, fiyat $1,76'dan başladı
- 2021: Boğa piyasası zirvesi, 4 Kasım'da $54,98 ile tüm zamanların en yüksek fiyatı
- 2025: Ayı piyasası, 11 Ekim'de $2,13 ile tüm zamanların en düşük seviyesi
DOT Mevcut Piyasa Görünümü
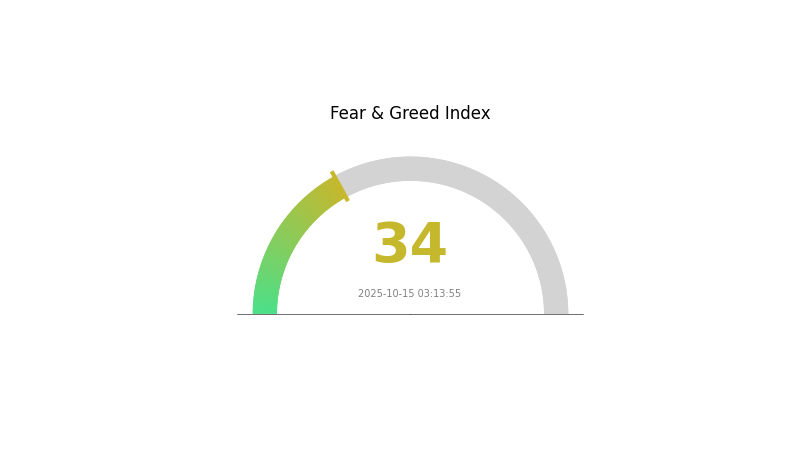
15 Ekim 2025 itibarıyla DOT, $3,233 seviyesinden işlem görüyor; piyasa değeri $4.921.489.404 ile kripto para sıralamasında 33. sırada yer alıyor. Son 24 saatte %2,16 gerileyen tokenın işlem hacmi $5.848.938 oldu. DOT fiyatı şu anda zirve fiyatının %94,12 altında, dip fiyatının ise %51,78 üzerinde. Piyasa duyarlılık endeksi 34 ile "Korku" seviyesinde, yatırımcıların temkinli hareket ettiğini gösteriyor. Son bir haftada DOT %22,11 değer kaybetti, son 30 gün ve 1 yıl performansında ise sırasıyla %24,99 ve %25,83 düşüş yaşandı.
Güncel DOT piyasa fiyatı için tıklayın
DOT Piyasa Duyarlılık Endeksi
2025-10-15 Korku ve Açgözlülük Endeksi: 34 (Korku)
Güncel Korku & Açgözlülük Endeksi için tıklayın
DOT için piyasa duyarlılığı hâlâ "Korku" bölgesinde ve endeks 34 seviyesinde. Bu durum, yatırımcıların dikkatli davrandığını gösteriyor. Bazı yatırımcılar, "diğerleri açgözlü olduğunda kork, korkanlar olduğunda açgözlü ol" yaklaşımını benimseyerek bu dönemi alım fırsatı olarak değerlendirebilir. Yine de, yatırım kararı almadan önce kapsamlı araştırma yapılmalı ve çok yönlü faktörler dikkate alınmalıdır. Gate.com, bu belirsiz dönemde yatırımcılara detaylı piyasa verileri ile destek olur.
DOT Varlık Dağılımı
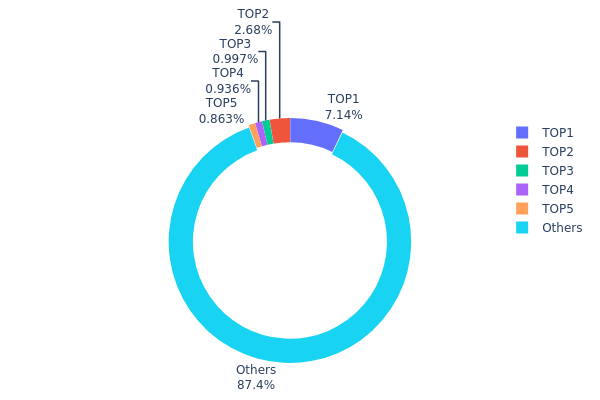
Adres bazlı varlık dağılımı verileri, DOT tokenlarının hangi adreslerde yoğunlaştığını gösterir. Veriler, ilk 5 adresin toplam DOT arzının %12,58'ini elinde tuttuğunu ve en büyük adresin %7,13 paya sahip olduğunu ortaya koyuyor. Bu tablo, orta düzeyde bir yoğunlaşmaya işaret ederken, tokenların %87,42'sinin ilk 5 adres dışında tutulduğunu gösteriyor.
En üstteki adreslerde belli bir yoğunlaşma olsa da bu oran aşırı değildir. Dağılım, genellikle piyasa istikrarı için olumlu kabul edilen dengeli bir sahiplik yapısı sunar. Ancak, tek bir adresin %7'den fazla arzı elinde bulundurması, büyük işlemler yapıldığında piyasa üzerinde etki oluşturabilir. Dağılım modeli, Polkadot'un yönetim yapısı ve ekosistem hedefleriyle uyumludur ve makul bir merkezsizleşme seviyesine işaret eder.
Genel olarak, bu varlık dağılımı; etkili paydaşlar ile geniş bir yatırımcı tabanını dengeleyen bir piyasa yapısı sunar. Bu denge, ağın dayanıklılığını artırır ve piyasa manipülasyonu riskini azaltır; yine de büyük sahiplerin hareketleri dikkatle izlenmelidir.
Güncel DOT Varlık Dağılımı için tıklayın
| Üst | Adres | Varlık Miktarı | Varlık (%) |
|---|---|---|---|
| 1 | 16ZL8y...9czzBD | 116.103,16K | 7,13% |
| 2 | 13Z7Kj...iPz8JT | 43.597,45K | 2,67% |
| 3 | 12ouvK...TRs1ab | 16.230,00K | 0,99% |
| 4 | 112RLy...Wz5Xui | 15.225,62K | 0,93% |
| 5 | 11yLs2...yDWQjc | 14.044,27K | 0,86% |
| - | Diğerleri | 1.421.941,40K | 87,42% |
II. DOT'un Gelecek Fiyatını Etkileyecek Temel Unsurlar
Arz Mekanizması
- Token Yakımı: Polkadot ağı periyodik olarak DOT token yakımı yaparak arzı azaltıp kıtlığı artırıyor.
- Tarihsel Desen: Önceki yakım işlemleri genellikle kısa vadeli fiyat artışlarına yol açtı.
- Güncel Etki: Yaklaşan token yakımları, DOT fiyatında yukarı yönlü baskı oluşturabilir.
Kurumsal ve Büyük Yatırımcı Dinamikleri
- Kurumsal Varlıklar: Büyük finans kuruluşlarının DOT varlıklarını artırması, projeye olan güvenin arttığını gösteriyor.
- Kurumsal Benimseme: Fortune 500 şirketleri Polkadot teknolojisini blokzincirler arası çözümler için araştırıyor.
Makroekonomik Çevre
- Para Politikası Etkisi: Merkez bankalarının gevşek politika eğilimleri, DOT gibi alternatif varlıklara olan talebi artırabilir.
- Enflasyon Koruma Özelliği: DOT, yüksek enflasyon dönemlerinde yatırımcı ilgisiyle enflasyon koruması potansiyeli göstermektedir.
Teknolojik Gelişmeler ve Ekosistem Büyümesi
- Polkadot 2.0: Yaklaşan büyük güncelleme, ölçeklenebilirlik ve birlikte çalışabilirlikte ciddi ilerleme hedefliyor ve DOT'un değerini destekleyebilir.
- Parachain Genişlemesi: Yeni parachain eklemeleri, DOT'un işlevselliğini ve talebini artırıyor.
- Ekosistem Uygulamaları: Polkadot üzerinde büyüyen DeFi ve NFT projeleri, DOT için yeni kullanım alanları yaratarak değerini yükseltebilir.
III. DOT Fiyat Tahmini (2025-2030)
2025 Görünümü
- Temkinli tahmin: $1,77 - $3,23
- Tarafsız tahmin: $3,23 - $4,00
- İyimser tahmin: $4,00 - $4,59 (güçlü piyasa toparlanması ve artan benimseme ile)
2027-2028 Görünümü
- Piyasa fazı: Potansiyel boğa döngüsü
- Fiyat aralığı:
- 2027: $4,15 - $5,48
- 2028: $4,50 - $6,93
- Önemli katalizörler: Ekosistem büyümesi, artan parachain faaliyetleri ve blokzincir benimsemesinin yaygınlaşması
2029-2030 Uzun Vadeli Görünüm
- Temel senaryo: $5,93 - $7,30 (istikrarlı büyüme ve benimseme ile)
- İyimser senaryo: $7,30 - $8,67 (hızlı ekosistem genişlemesiyle)
- Dönüştürücü senaryo: $8,67 - $10,74 (çığır açan uygulamalar ve kitlesel benimseme ile)
- 2030-12-31: DOT $10,74 (olumlu piyasa koşullarında olası zirve)
| Yıl | Tahmini En Yüksek Fiyat | Tahmini Ortalama Fiyat | Tahmini En Düşük Fiyat | Değişim Oranı |
|---|---|---|---|---|
| 2025 | 4,58802 | 3,231 | 1,77705 | 0 |
| 2026 | 4,92598 | 3,90951 | 3,08851 | 20 |
| 2027 | 5,47801 | 4,41775 | 4,15268 | 36 |
| 2028 | 6,92703 | 4,94788 | 4,50257 | 52 |
| 2029 | 8,66868 | 5,93745 | 3,68122 | 82 |
| 2030 | 10,73551 | 7,30306 | 6,28064 | 125 |
IV. Profesyonel DOT Yatırım Stratejileri ve Risk Yönetimi
DOT Yatırım Yaklaşımı
(1) Uzun Vadeli Tutma Stratejisi
- Uygun yatırımcı profili: Sabırlı, uzun vadeli bakış açısına sahip olanlar
- Uygulama önerileri:
- Zaman içinde düzenli alımlarla DOT maliyetini ortalamak
- Piyasa döngüleri boyunca tutmak, temellere odaklanmak
- Varlığı güvenli, gözetimsiz bir cüzdanda saklamak
(2) Aktif Alım-Satım Stratejisi
- Teknik analiz araçları:
- Hareketli ortalamalar: Trend ve destek/direnç seviyelerini saptamak için
- RSI: Aşırı alım/aşırı satım durumlarını izlemek için
- Swing trade için önemli noktalar:
- Net giriş ve çıkış noktaları belirlemek
- Risk yönetimi için zarar durdur kullanmak
DOT Risk Yönetim Çerçevesi
(1) Varlık Dağılımı Prensipleri
- Temkinli yatırımcılar: Portföyün %1-3'ü DOT'a ayrılmalı
- Aggresif yatırımcılar: Portföyün %5-10'u
- Profesyonel yatırımcılar: Portföyün %15'ine kadar DOT bulundurabilir
(2) Riskten Korunma Çözümleri
- Çeşitlendirme: Birden fazla kripto para varlığına yaymak
- Opsiyon stratejileri: Düşüş riskine karşı put opsiyonları kullanmak
(3) Güvenli Saklama Çözümleri
- Donanım cüzdanı tavsiyesi: Gate Web3 Wallet
- Yazılım cüzdanı alternatifi: Resmi Polkadot cüzdanı
- Güvenlik tedbirleri: 2FA kullanmak, yedek anahtarları güvenli şekilde muhafaza etmek
V. DOT için Olası Riskler ve Zorluklar
DOT Piyasa Riskleri
- Yüksek oynaklık: Kripto piyasalarında sert fiyat dalgalanmaları
- Rekabet: Diğer layer-1 blokzincirlerin pazar payı için yarışması
- Piyasa duyarlılığı: Genel kripto piyasa trendlerinden etkilenme
DOT Regülasyon Riskleri
- Belirsiz mevzuat: Olumsuz regülasyon olasılığı
- Sınır ötesi uyum: Farklı ülkelerde değişen düzenlemeler
- Menkul kıymet sınıflandırılması: Menkul kıymet olarak nitelendirilme riski
DOT Teknik Riskler
- Akıllı kontrat açıkları: Parachain kodunda istismar riski
- Ölçeklenebilirlik zorlukları: Ağ büyüdükçe performansı koruma gerekliliği
- Birlikte çalışabilirlik sorunları: Zincirler arası iletişimde teknik güçlükler
VI. Sonuç ve Eylem Önerileri
DOT Yatırım Değeri Analizi
Polkadot, blokzincirler arası etkileşimde uzun vadeli potansiyel sunarken kısa vadede oynaklık ve rekabet baskısı ile karşı karşıya. Eşsiz parachain modeli ve güçlü geliştirici topluluğu, büyüme için sağlam bir temel oluşturuyor.
DOT Yatırım Tavsiyeleri
✅ Yeni başlayanlar: Küçük ve düzenli yatırım ile alım pozisyonu oluşturun
✅ Deneyimli yatırımcılar: Ana portföy varlığı olarak tutup aktif yönetim uygulayın
✅ Kurumsal yatırımcılar: Staking ve parachain fırsatlarıyla getiri arayın
DOT Alım-Satım Katılım Yöntemleri
- Spot alım-satım: Gate.com'da DOT alıp tutmak
- Staking: Ağa katkı sağlayıp ödül kazanmak
- Parachain açık artırmaları: Polkadot üzerinde projeleri desteklemek
Kripto para yatırımları yüksek risk içerir. Bu makale yatırım tavsiyesi değildir. Yatırımcılar kendi risk toleranslarına göre dikkatli karar vermeli, profesyonel finans danışmanlarından yardım almalıdır. Kaybedebileceğinizden fazlasını yatırmayınız.
SSS
DOT $100'a ulaşır mı?
Mevcut tahminlere göre DOT'un $100 seviyesine çıkması olası görünmemektedir. 2030 için DOT'un en yüksek fiyat öngörüsü sadece $1,61 olup, $100 seviyesinden çok uzaktır.
2025 DOT fiyat tahmini nedir?
Mevcut projeksiyonlara göre, 2025 yılında DOT fiyatı $4,01 ile $13,90 arasında değişebilir ve piyasada önemli dalgalanmalar yaşanabilir.
Polkadot $50'a ulaşabilir mi?
Evet, Polkadot'un $50 seviyesine çıkma potansiyeli var. Analistlere göre piyasa koşulları uygun olduğunda bu hedef yakın zamanda gerçekleşebilir.
Beş yıl sonra bir DOT'un değeri ne olur?
Mevcut öngörülere göre, 5 yıl sonra DOT yaklaşık $7,10 değerinde olabilir. Bu tahmin, Polkadot ekosistemindeki potansiyel büyüme ve teknolojik gelişmeleri dikkate almaktadır.
Share
Content
Giriş: DOT'un Piyasa Konumu ve Yatırım Potansiyeli
I. DOT Fiyat Geçmişi ve Mevcut Piyasa Durumu
II. DOT'un Gelecek Fiyatını Etkileyecek Temel Unsurlar
III. DOT Fiyat Tahmini (2025-2030)
IV. Profesyonel DOT Yatırım Stratejileri ve Risk Yönetimi
V. DOT için Olası Riskler ve Zorluklar
VI. Sonuç ve Eylem Önerileri
SSS
How to Buy Cryptocurrency


Trending Cryptocurrencies


2025 LUNC Fiyat Tahmini: Terra Luna Classic’in Çöküş Sonrası Dönemde Potansiyel Toparlanma ve Piyasa Görünümünün Analizi

2025 HBAR Fiyat Tahmini: Hedera Hashgraph, Kripto Piyasasında Yeni Zirvelere Ulaşabilir mi?

2025 CFX Fiyat Tahmini: Conflux Network İçin Piyasa Trendleri ve Olası Büyüme Faktörlerinin Analizi
2025 SMARTPrice Tahmini: Yatırım Portföyü Optimizasyonu İçin Gelişmiş Yapay Zekâ Destekli Piyasa Analitikleri
2025 NANO Fiyat Tahmini: Dijital Para Birimi İçin Piyasa Analizi ve Büyüme Potansiyeli

2025 FTN Fiyat Tahmini: Piyasa Trendleri, Tokenomik ve FTN’nin Gelecek Boğa Döngüsündeki Büyüme Potansiyeli Analizi

Metaverse'te Sanal Arazi Satın Alma Rehberi

2024 yılında yatırım için göz önünde bulundurabileceğiniz en önemli NFT'ler

Yeni başlayanlar için uygun başlıca kripto madencilik havuzları
ERC20 Standardını Anlamak: Tanımı ve İşlevselliği
Dijital varlıkların güvenli şekilde alım satımı için tercih edilen en iyi platformlar