Futures
Access hundreds of perpetual contracts
TradFi
Gold
One platform for global traditional assets
Options
Hot
Trade European-style vanilla options
Unified Account
Maximize your capital efficiency
Demo Trading
Introduction to Futures Trading
Learn the basics of futures trading
Futures Events
Join events to earn rewards
Demo Trading
Use virtual funds to practice risk-free trading
Launch
CandyDrop
Collect candies to earn airdrops
Launchpool
Quick staking, earn potential new tokens
HODLer Airdrop
Hold GT and get massive airdrops for free
Pre-IPOs
Unlock full access to global stock IPOs
Alpha Points
Trade on-chain assets and earn airdrops
Futures Points
Earn futures points and claim airdrop rewards
The key game after BTC surpasses 75,000: Break new highs or lure traders with high positions? We'll find out tonight!
Current Price: 75,023
Structurally, BTC has already completed a round of rapid V-shaped reversal and entered a high-level consolidation zone. Now there’s only one core question in the market:
Above 75,000, is it trend continuation, or a stage top?
Below, we break it down across three timeframes.
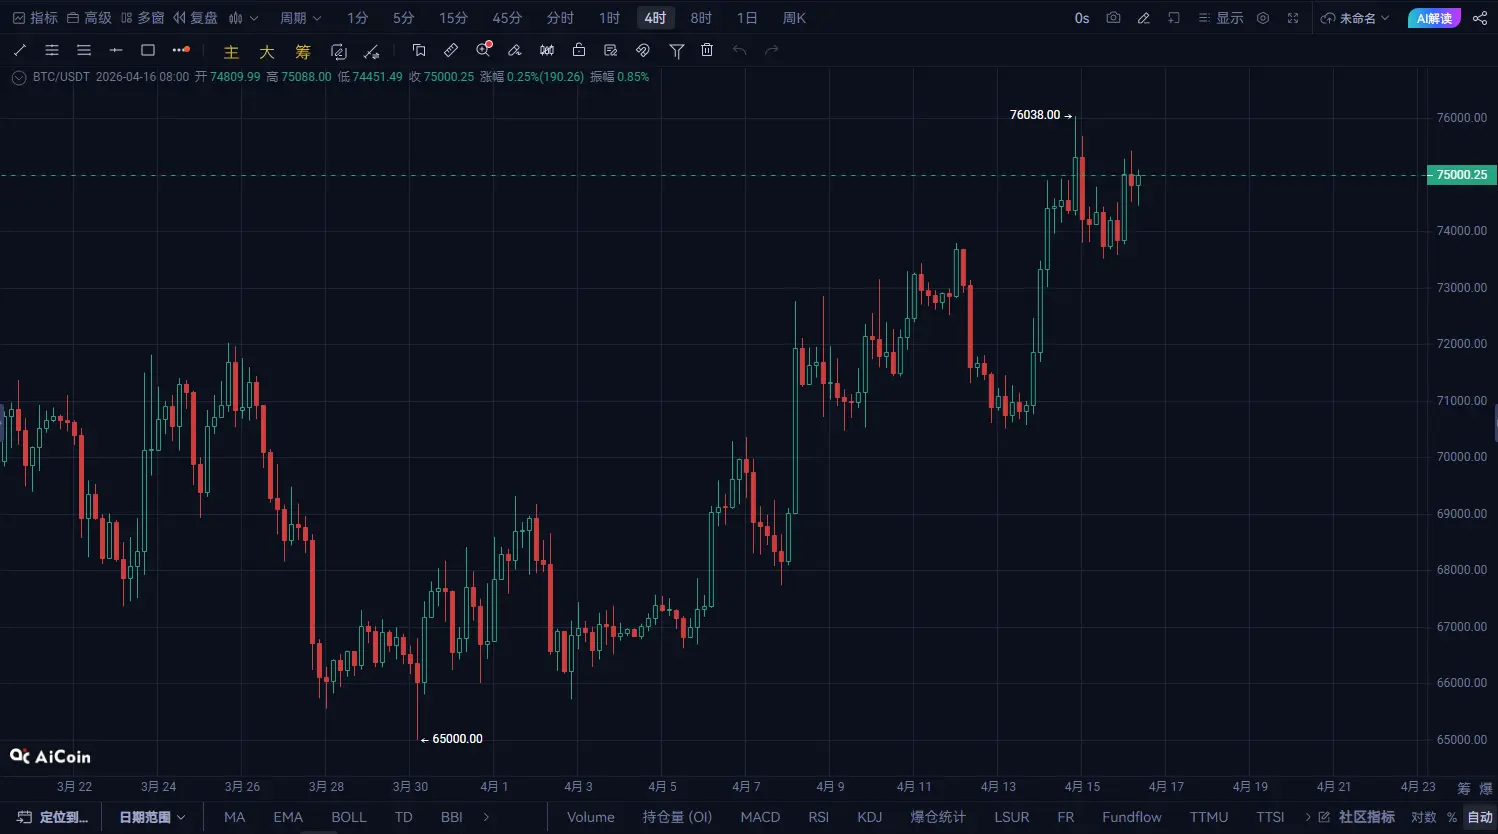
Overall, the daily structure is still healthy:
The earlier formation of a base was completed around 70,000
Then it rapidly surged and regained lost ground
After touching a high of 76,038, it pulled back
This shows:
👉 The bullish trend is still intact
👉 But it has entered the prior high-pressure area
What around 76,000 essentially means is:
Trapped positions from earlier are being released
Short-term profit-taking is being realized
Daily conclusion:
Trend: Bullish trend not broken
State: High-level consolidation
Key levels:
Support: 73,500 / 72,000
Resistance: 76,000 / 78,000
The four-hour structure is very important:
The lows keep getting raised (71,000 → 73,000 → 74,000)
The highs are being pressured at 76,000
Pullbacks haven’t broken down
This shows:
👉 The bulls are still in control
👉 The main force is “controlling the pace and rotating positions” at high levels
But note:
👉 Every push higher is being suppressed
👉 There is clearly selling pressure overhead
Four-hour conclusion:
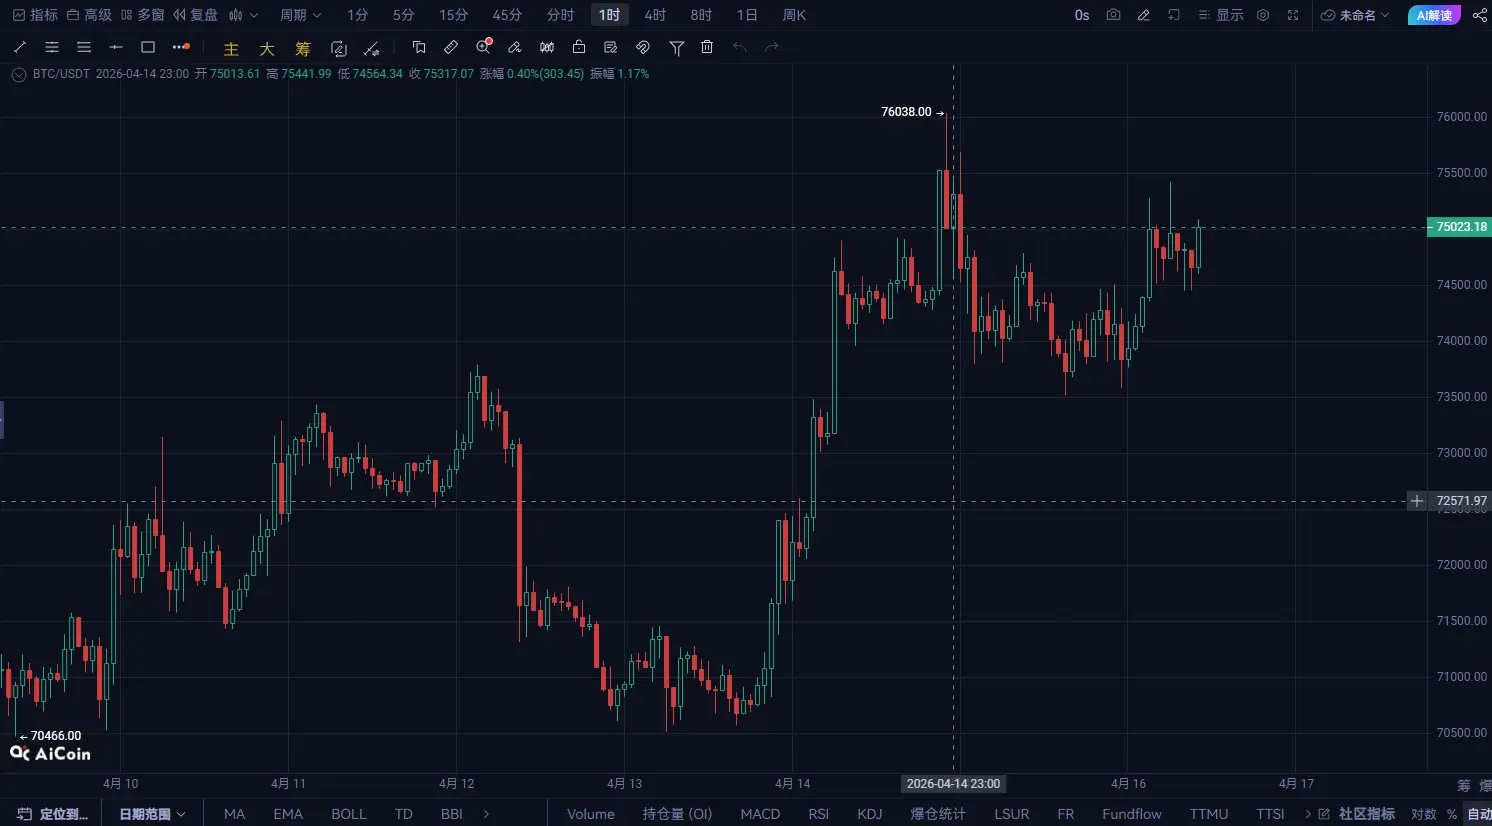
The upward-oscillation structure is still intact; the trend leans bullish, but the upside is limited
From a short-term perspective:
Range: 74,500 - 75,500
Multiple tests of 75,000
No breakout with volume
This is a typical:
👉 Sideways accumulation before a regime change
Key trigger points:
To the upside:
Break above 75,500 and hold
➡️ Look to 76,000 → 78,000
To the downside:
Break below 74,500
➡️ Look to 73,500 → 72,000
Current market status:
Daily: In an uptrend
Four-hour: Oscillating upward
One-hour: Waiting for a breakout
👉 Conclusion:
The larger direction is bullish, but the short term is in a decision phase
1️⃣ Long strategy (priority)
Go long in the direction of the breakout if it clears 75,500
Or buy the dips at 73,500-74,000 low entries
Stop-loss:
Exit if it drops below 73,000
2️⃣ Short strategy (short-term)
Short around 76,000 where there is pressure
Stop-loss:
Above 76,500
Targets:
74,500 → 73,500
👉 Only take short trades in the short term; don’t go against the trend
3️⃣ Risk control focus
Don’t open trades randomly in the middle zone around 75,000
Control position size
Wait until key levels to take action
This wave of market action isn’t the end—it’s:
👉 A high-level position rotation phase
The real direction isn’t here; it’s after the breakout.