Share crypto content and earn up to 60% commissions through content mining.
placeholder
gatefun
Analysis: Dovish signals from the Bank of Japan eliminate a key risk for Bitcoin’s rebound
PANews April 14, according to CoinDesk, ahead of the April 28 policy meeting, Bank of Japan Governor Ueda Kazuo released dovish signals, stating that with the impact of the Iran war on the Japanese economy uncertain, he would take a more cautious stance, which helped Bitcoin break through $74,000. On August 5, 2024, the Bank of Japan’s unexpected rate hike triggered the unwinding of the yen carry trade, causing Bitcoin to drop from $64,000 to $49,000 within 48 hours. A dovish Bank of Japan that keeps the
BTC4,7%
View Original
post-image
  • Reward
  • Comment
  • Repost
  • Share
BTC,ETH,GT Market Analysis
gate liveLIVE
518
  • Reward
  • Comment
  • Repost
  • Share
#ETH 1916 continues to attempt to hold. As long as it stays above, the upward movement may continue.
However, if it breaks the important resistance zone of 2380-2475 with volume, the rise could persist.
If there is a close above 2475 on the 4-hour chart, the first sign that the upward trend may continue will be confirmed.
The weekly formation of an upward Libra pattern still remains a possibility.
The target of the pattern is the 4956 peak, but during the rise, the 3445 peak is an important resistance. If rejected, it may fall again without reaching the target.
The stop level of the p
ETH7,78%
View Original
post-image
  • Reward
  • Comment
  • Repost
  • Share
$PI Oh, missed another 😣
PI-1,06%
View Original
post-image
  • Reward
  • Comment
  • Repost
  • Share
Bitcoin rebounds strongly to 73.000.with the tug of war between bulls and bears heating up again
gate liveLIVE
505
  • Reward
  • Comment
  • Repost
  • Share
#Gate广场四月发帖挑战
Content Convergence Phase in High-Engagement Campaigns: Strategic Analysis of the Gate Square April Posting Challenge
Identifying the Saturation Threshold in Digital Engagement Systems
Within large-scale engagement ecosystems, a predictable phase emerges where content diversity declines and structural similarity increases. In the context of the #GateSquareAprilPostingChallenge, this phase can be defined as the “content convergence point,” where a significant portion of user-generated posts begin to reflect similar formats, themes, and engagement strategies. This is not an indica
post-image
post-image
post-image
post-image
post-image
  • Reward
  • Comment
  • Repost
  • Share
Is there really such a coincidence in the world!
I just took out 2万 u from my investment to get ready to buy zama
Fifteen seconds after I withdrew the money, it suddenly started exploding upward
I 🌿🌿🌿🌿
ZAMA8,37%
View Original
post-image
  • Reward
  • Comment
  • Repost
  • Share
#ETH #RAVE
Ethereum has started to strengthen, reaching a new high. As a trend indicator for altcoins, Ethereum's strength suggests that a wave of altcoin season is about to begin!
The spot positions we previously arranged have also seen very good gains, with a 150% increase in half a month, and RAVE needs no mention, already 40 times! Yesterday, the small test of Light surged nearly 30% in a short time, it was just too explosive!
The focus moving forward will be on spot positions, riding a small altcoin season bull market!
ETH7,78%
RAVE61,99%
LIGHT15,11%
View Original
post-image
  • Reward
  • Comment
  • Repost
  • Share
Education: Triple Top Pattern
An in-depth analysis of a powerful trend reversal structure. The triple top is a solid signal that buyers have completely exhausted their strength and surrendered. This is an ideal opportunity to capture substantial profits during a market plunge.
What it looks like on the chart:
1. Pattern formation: Price touches the same strong resistance level three times. Each time, buyers are fiercely pushed back to support (the neckline). Three clear peaks are formed.
2. Decreasing volume: Each attempt to break through the high is accompanied by shrinking volume. When the t
View Original
post-image
post-image
post-image
[The user has shared his/her trading data. Go to the App to view more.]
  • Reward
  • Comment
  • Repost
  • Share
Hyperliquid, built by Jeffrey Yan, reportedly generated over $900M in profit with just 11 employees, making it one of the most profitable startups per employee globally.
post-image
post-image
  • Reward
  • Comment
  • Repost
  • Share
#CryptoMarketRecovery The 2026 Market Dynamics
1. Why the "Wait and See" approach is different this time
In previous cycles, a Bitcoin recovery almost instantly triggered an "Alt-season." In 2026, we are seeing a fragmented market. Capital is no longer flowing into everything; it is becoming highly selective.
Institutional Filter: Institutions are now the primary drivers. They aren't buying random small-caps; they are sticking to regulated ETPs (Exchange Traded Products) for BTC and ETH.
The "Lindy Effect": Projects that survived the 2024-2025 volatility are now seen as "blue chips." This is w
BTC4,68%
ETH7,78%
SOL4%
BNB2,67%
post-image
  • Reward
  • 2
  • Repost
  • Share
AylaShinex:
To The Moon 🌕
View More
📝 April 14 Morning Market Analysis: The Islamabad Observation Period's Independent Verification Phase is steadily progressing! The limited navigation of the Hormuz Strait remains orderly + toll collection implementation is on track, with normal pace, and geopolitical risk pricing continues to follow the "data verification-led narrow range balance" pattern!
Trump's final ultimatum has lasted over 180 hours, and Truth Social remains silent in the early trading session. The Iran-U.S. delegation contacts in Islamabad are progressing independently during the observation period, with no signs of
BTC4,68%
ETH7,78%
RAVE61,99%
View Original
post-image
post-image
  • Reward
  • 1
  • Repost
  • Share
BurningGoldToForgeShadows:
Steadfast HODL💎
$btc $eth There might be a false breakout, pushing the shorts in before dropping again.
The second half of the bear market begins the dollar-cost averaging mode.
BTC4,68%
ETH7,78%
View Original
post-image
  • Reward
  • Comment
  • Repost
  • Share
Will crude oil still rise? Can cryptocurrencies continue to surge? The key factor this time depends on one variable!
All current market issues can actually be boiled down to one variable:
— Will the situation escalate?
If it doesn't escalate:
✔ Crude oil remains volatile at high levels
✔ Cryptocurrencies continue to recover
✔ Gold stabilizes and returns to normal
If it escalates:
✔ Crude oil keeps pushing higher
✔ Risk assets come under pressure
✔ Gold strengthens
So the key is not to judge whether prices will go up or down, but to judge—
the probability.
Currently, the
View Original
post-image
post-image
  • Reward
  • 19
  • Repost
  • Share
SpicyHandCoins:
Get in quickly!🚗
View More
Can $PI be connected?
PI-1,06%
View Original
post-image
  • Reward
  • 16
  • Repost
  • Share
GateUser-0f4acc33:
Open your eyes and see the hundred flowers blooming outside. Why are you staring at it? You're a worthless piece of trash.
View More
Old friend #RIVER has reached 8.68. I reminded everyone at 7 last night! Are there any friends who have bought in? Haha! 😄
Last night’s lowest was 6.96, now up 24.82%, with countless trapped orders above! Everyone, be sure to set stop-loss to protect your principal! $RIVER
View Original
post-image
post-image
飞鱼2026祝福版
The charm of knockoffs #RIVER is back to the 70s. Previously, it went from the 70s all the way to 88. Along the way, everyone said they missed the boat and patted their thighs. Now it's back again. Do you dare to get on? 😏 $RIVER
repost-content-media
  • Reward
  • Comment
  • Repost
  • Share
#Gate广场四月发帖挑战 Cryptocurrencies are generally halved; what is their current position?
In April, the cryptocurrency market is in a state that makes people both anxious and conflicted. Bitcoin has fallen from its October 2025 all-time high of $126,080 down to around $70,000, a retracement of nearly 47%. Altcoins are even more brutal—Ethereum dropped to about $2,200, Ripple to $1.33, Solana to $82, and the GMCI30 index tracking the top 30 cryptocurrencies worldwide remains at a low level. Faced with this "halving" market, the most concerned question for investors is: Have we reached the bottom? Is
BTC4,68%
ETH7,78%
XRP2,54%
View Original
post-image
post-image
post-image
ShizukaKazu
#Gate广场四月发帖挑战 Cryptocurrencies are generally halved; what is their current position now?
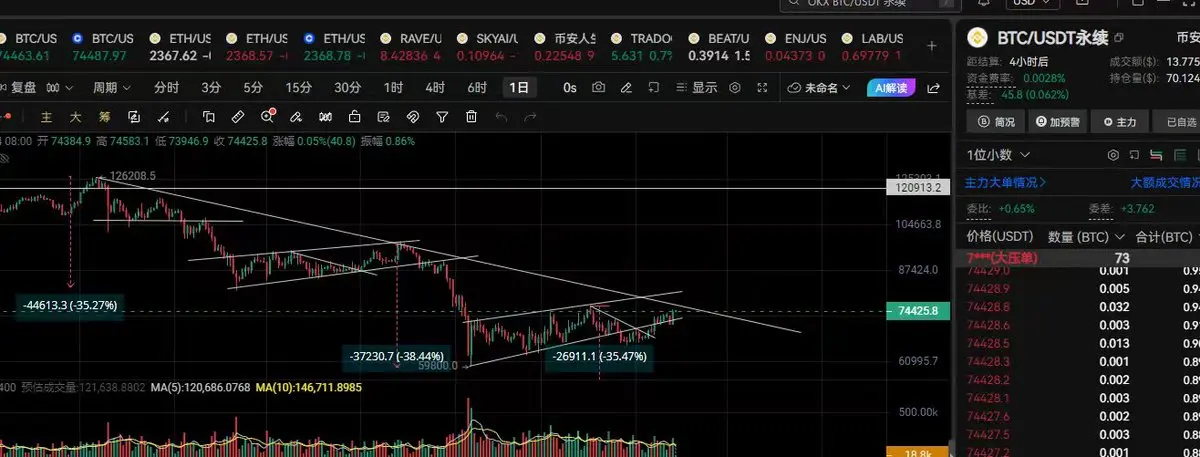
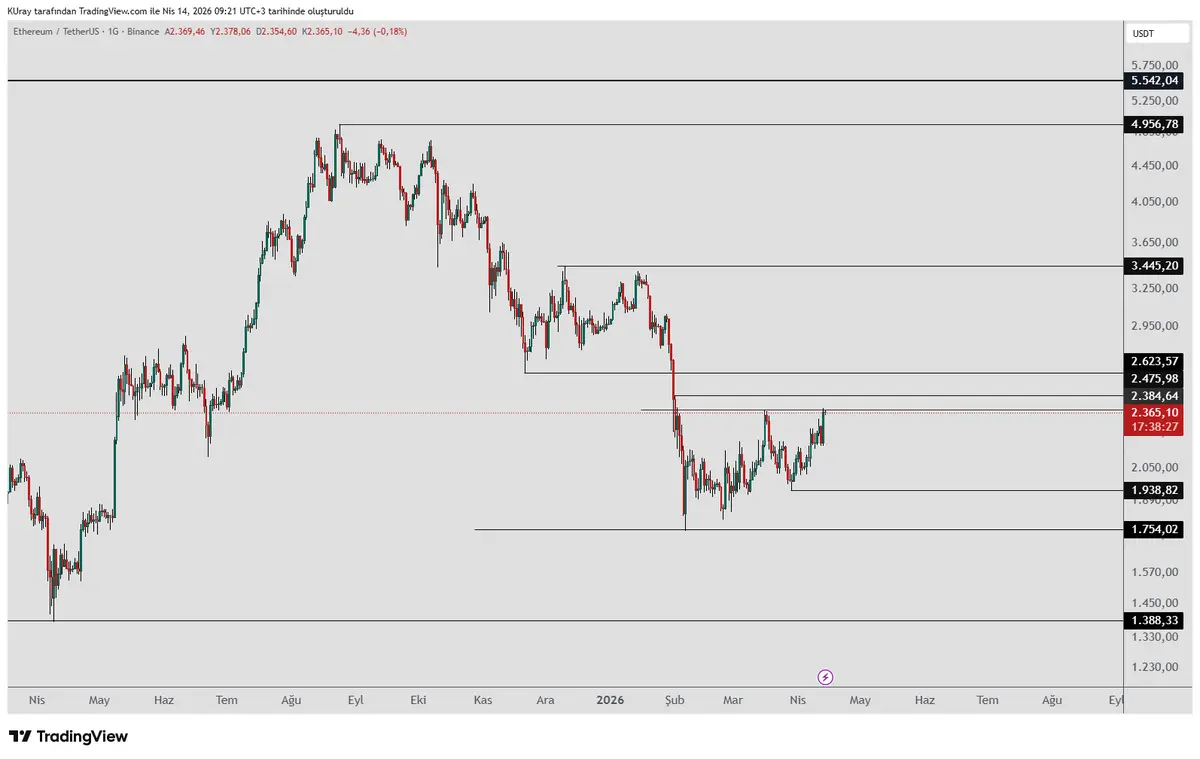
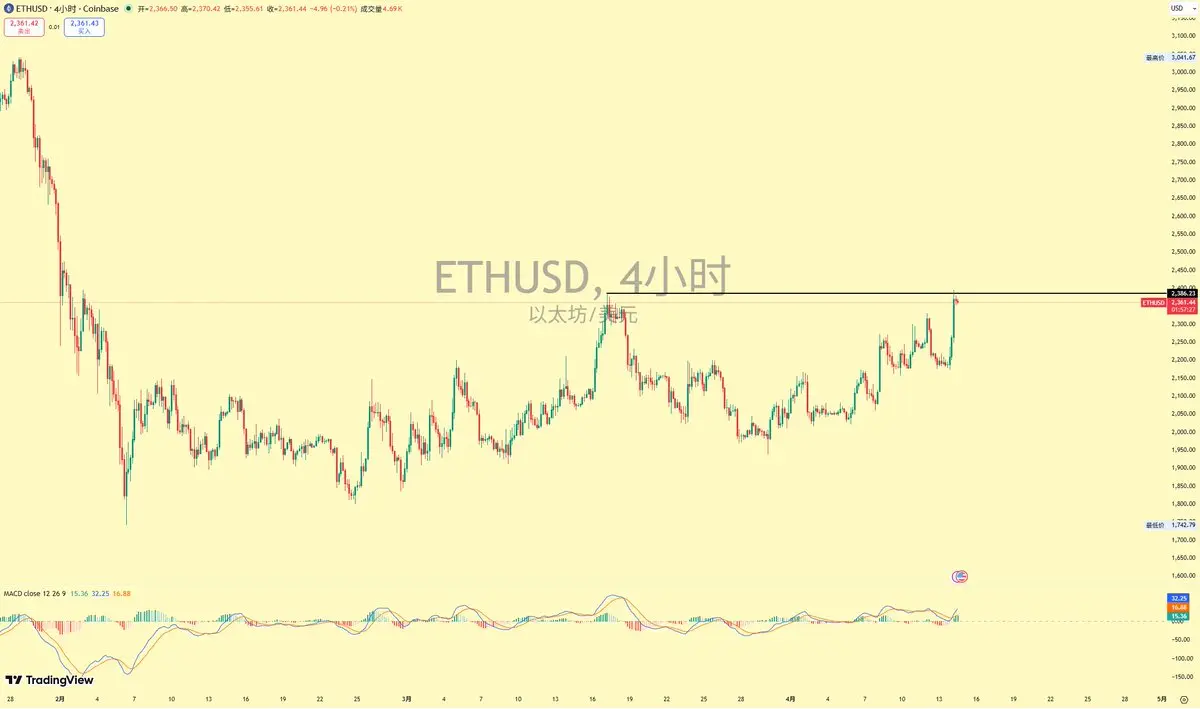
In April, the cryptocurrency market is at a point that makes people both anxious and conflicted. Bitcoin has fallen from its October 2025 all-time high of $126,080 down to around $70,000, a retracement of nearly 47%. Altcoins are even more brutal—Ethereum dropped to about $2,200, Ripple to $1.33, Solana to $82, and the GMCI30 index tracking the top 30 cryptocurrencies worldwide remains at a low level. Faced with this “halving” market, the most pressing question for investors is: Have we reached the bottom? Is now the time to buy-in, or should we continue to wait and see?
01 Divergence of Bulls and Bears: Where exactly is the market?
The current conflicting signals in the market can be summarized in one sentence—institutions are buying, retail investors are panicking, technicals are signaling a reversal, and macro factors are exerting pressure.
On the bullish side, big players like Goldman Sachs are standing behind. Goldman Sachs analyst James Yaro explicitly stated in a research report in early April that the crypto market “may have already touched the cycle bottom.” His core argument is that after four consecutive months of net outflows, $1.32 billion of institutional funds flowed back into Bitcoin spot ETFs in March, indicating a shift from speculative selling to long-term capital accumulation. Yaro defines the $68,000 to $71,000 range as Bitcoin’s support zone and believes leverage liquidations have largely been completed.
Meanwhile, on-chain data is also signaling a bottom. The MVRV Z-Score is compressing, a metric historically highly correlated with major cycle lows; the 720-day Bitcoin indicator (TBBI) has fallen below 20, also indicating the end of a long-term downtrend. The number of Bitcoins held by accumulation addresses has surged from 2 million at the start of 2024 to 4.37 million on April 7, showing long-term holders are continuing to buy amid market panic.
Bitcoin reserves on exchanges have fallen to a two-year low, with institutions continuously “buying the dip” in panic.
But the bearish voices cannot be ignored either. Veteran trader Peter Brandt pointed out that Bitcoin’s current price structure is incomplete, and the market still needs to go through a downward shakeout. He expects the price to fall below $66k to clear out bullish liquidity before a meaningful rebound can occur.
CryptoQuant analyst oro_crypto also warned that the recent rebound from $66,000 to $72k was entirely driven by futures leverage and lacked spot buying support—an “unfunded water” situation. Some analysts, based on historical cycle patterns, believe it’s still too early. Crypto analyst @CryptoTice_ pointed out that, based on the patterns of the past four halving cycles, the true bottom usually forms between 800 and 950 days after the halving, which points to Q4 2026 rather than the current stage. He emphasized that a real bottom would require a complete collapse of market confidence and participants capitulating, whereas currently, some are still actively buying and expecting a short-term rebound.
02 Macro Environment: Hawkish Fed and Geopolitical Pressures
The macro environment in 2026 is not friendly to cryptocurrencies. The Federal Reserve’s benchmark interest rate remains between 3.50% and 3.75%, with inflation expectations still above the 2% target. March’s CPI rose 3.3% year-over-year, and although core CPI was below the expected 2.7%, market expectations for rate cuts continue to be delayed—Polymarket’s probability of no rate cut in 2026 has surged from about 2.9% in mid-January to 35.9%. More troubling, CME interest rate swaps show an 87.6% chance of holding rates steady in April, but the rate hike expectation has doubled to 12.4% since the beginning of the month.
A new Fed paper even found that since 2021, Bitcoin and Ethereum increasingly track macro signals like U.S. inflation and employment data, showing high correlation with risk assets. After ETF launches, the correlation between Bitcoin and Fed policy has reversed, with institutional investors now pricing in rate changes 6 to 12 months in advance.
On the geopolitical front, the Iran-U.S. talks in Islamabad broke down after 21 hours, the U.S. announced a blockade of the Strait of Hormuz, and Brent crude oil surged to $98 per barrel. Following the news, Bitcoin dropped about 3% within 24 hours to around $70,600. For cryptocurrencies, geopolitical conflicts are now an unavoidable influence—they are no longer “digital gold” safe havens but are highly correlated with risk sentiment. As BTC Markets analysts noted, current geopolitical news is dominating short-term crypto market movements.
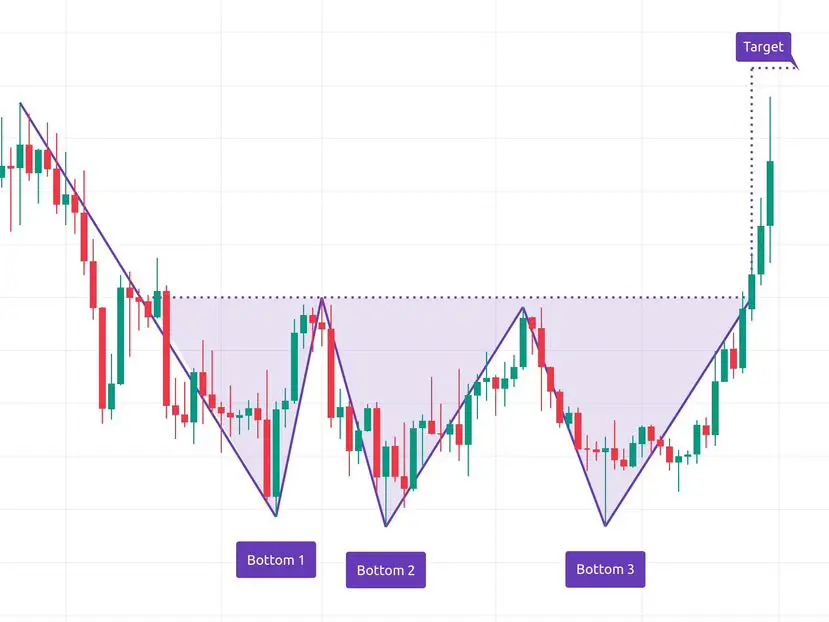
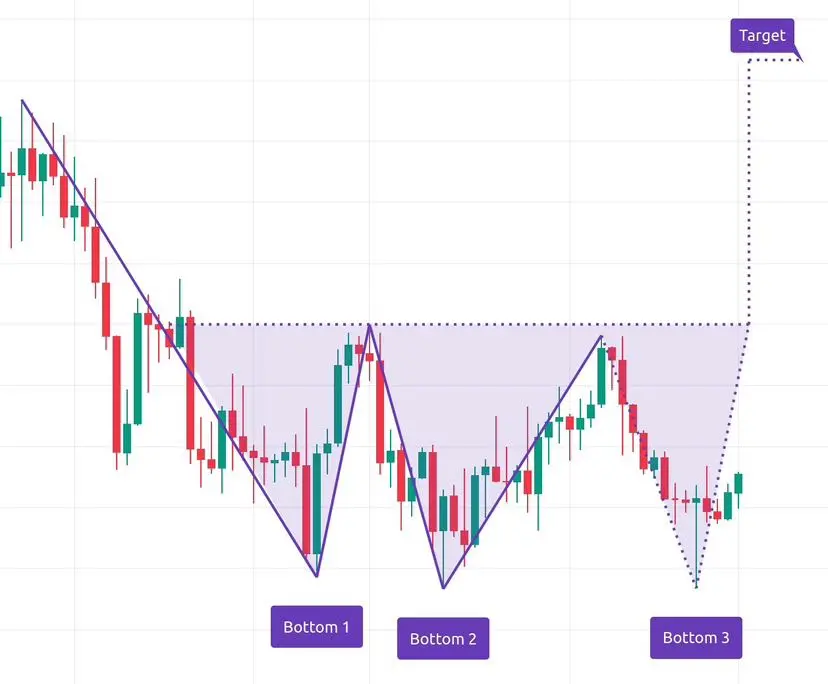
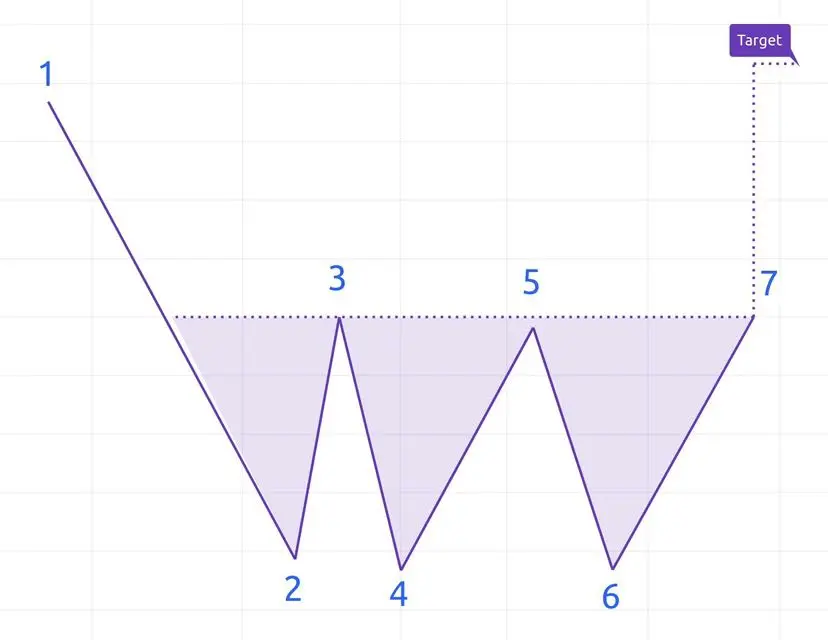
03 Technical Analysis: Cup-and-Handle Formation, but Momentum in Doubt
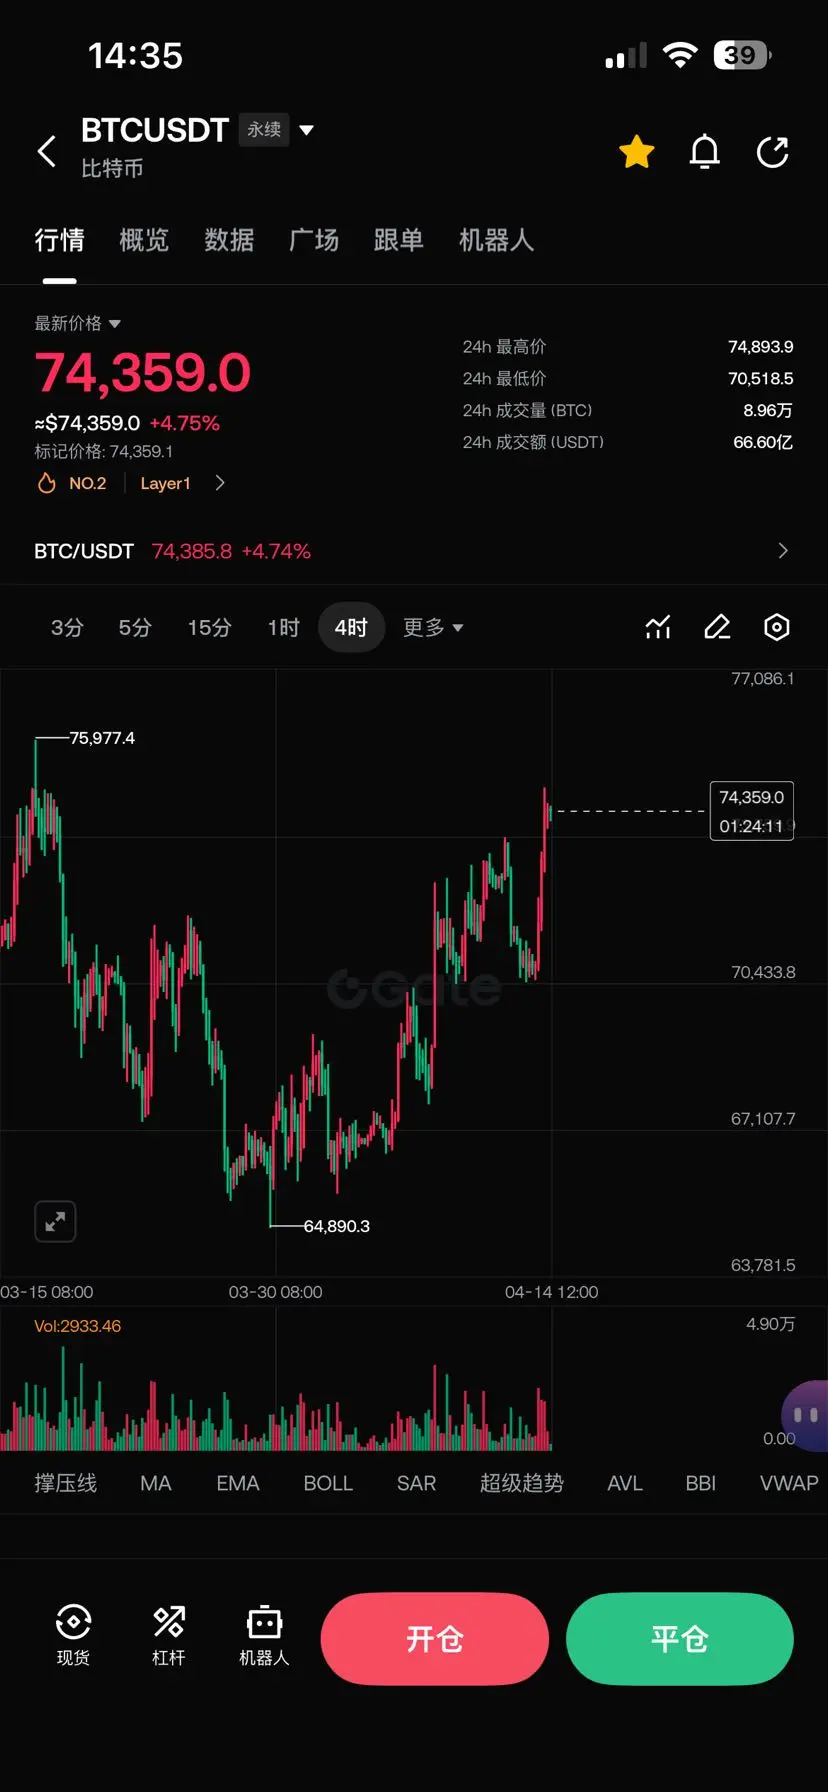
From a technical perspective, Bitcoin’s daily chart is forming a classic cup-and-handle pattern. The neckline is between $73,151 and $73,240. If the price can close above this level, the measured move target is about 11%, potentially reaching around $81,720. However, there are concerns. The RSI (Relative Strength Index) shows a “hidden bearish divergence”—from March 4 to April 9, Bitcoin made lower highs while RSI formed higher highs, suggesting the downtrend may not be over yet, and the current rebound might still need further consolidation.
Key support is testing the 50-day exponential moving average at around $70,700. Resistance is at the $73,750 to $74,400 zone. If the price falls below the 50-day EMA, it could further retrace toward $60,000. The negative funding rate (-6%) and high short positions increase the risk of a short squeeze—once the price breaks resistance, a large number of short positions could be liquidated, pushing for a rapid rebound.
04 Market Liquidity: Stablecoin Inflows and ETF Funds Hit Three-Month Highs
The most recent and notable signals come from market liquidity. During the week of April 6–12, the market saw $2.56 billion in stablecoin inflows, with spot and perpetual contract trading volumes on centralized exchanges both increasing week-over-week. On-chain data shows funds are gradually flowing back from stablecoins into Bitcoin. Institutional inflows are also a positive sign. The U.S. spot Bitcoin ETF recorded a net inflow of $786 million last week, the strongest since February; on April 13, there was a single-day net inflow of $471 million—the largest in about three months. Strategy firms bought 13,927 Bitcoins during this period, worth about $1 billion. The rising share of institutional holdings and CME Bitcoin futures open interest surpassing $66k indicate a shift from retail-driven speculation to a more institutional, structural environment.
05 Institutional Views: Optimism from the Bulls, Caution from the Skeptics
Reviewing recent institutional and analyst opinions, the bullish camp includes: Goldman Sachs, which believes the market may have already hit the cycle bottom; Bernstein maintaining a $150k Bitcoin target by the end of 2026; and Tom Lee of Fundstrat, who estimates Bitcoin could reach $200k to $250k.
But cautious voices also warn investors: Bitf warns April will be a critical month for whether rate expectations can be maintained; several institutional analysts point out that resolving the U.S.-Iran conflict and whether Bitcoin can return to its historical highs are necessary conditions for the next bull run. ZFX Shanhai Securities offers a more moderate view, suggesting Bitcoin is currently in a low-volatility consolidation phase, with short-term sentiment neutral to slightly weak but with potential for a rebound. Multiple perspectives converge on one conclusion: the current position shows characteristics of a bottom zone, but the ultimate direction depends on whether macro variables can improve substantially. As André Dragosch, head of European research at Bitwise, put it, Bitcoin’s risk-reward ratio is “significantly tilted in favor,” but this depends on geopolitical and macroeconomic conditions aligning.
Conclusion: How to navigate the current bottom game? Returning to the initial question: after the widespread halving of cryptocurrencies, is this the bottom?
Objectively, signals supporting the formation of a bottom are increasing—ongoing institutional inflows, accelerated on-chain accumulation, stablecoin fund reflows, and gradually improving technical patterns. But uncertainties are equally prominent—unclear macro rate-cut paths, unresolved geopolitical conflicts, and insufficient short-term momentum for a rebound. For ordinary investors, the following variables are worth continuous monitoring:
Can ETF inflows sustain—this is the most direct indicator of institutional sentiment;
The evolution of U.S.-Iran tensions—geopolitical conflicts are the biggest short-term disruptors;
The Fed’s statements at the April FOMC meeting—interest rate decisions will directly impact risk asset valuations;
Whether Bitcoin can hold above $70,000—this is a key technical signal for a potential bullish reversal.
As many analysts have said, the April 2026 crypto market is in a “test of discipline” phase. The market’s bottom is never a single price point but a range; confirming the bottom is not based on any single indicator but on the resonance of multiple signals.
repost-content-media
  • Reward
  • 8
  • Repost
  • Share
Ryakpanda:
DYOR 🤓
View More
DeFi suddenly explodes? This isn’t accidental—it’s funds “testing the waters”!
When the DeFi sector suddenly climbs by 5%, many people will think:
Is this the start of a new market cycle?
But the more real situation is—
funds are probing.
Why choose DeFi?
Because it’s the most sensitive to liquidity.
Once the market feels “risk has gone down,” funds will flow first into high-volatility (high-elasticity) sectors.
It’s like testing the water temperature:
First, put one toe in.
So what’s the core of the Iran issue?
It’s not the protocol—it’s “stable expectations.”
As long as the market believes t
View Original
post-image
post-image
  • Reward
  • 20
  • Repost
  • Share
CoinWay:
Hop in the car!🚗
View More
$BLESS ‌USDT 🚀 Clean recovery structure forming after heavy dump — momentum slowly building for next breakout leg
Trade Plan 📈📉
Entry: 0.0205–0.0213
Stop Loss: 0.0188
TP1: 0.0238
TP2: 0.0275
TP3: 0.0310
Price rejected hard from 0.037 and dumped to 0.017, now holding strong base and printing higher lows on lower TF. Short MA reclaim shows early bullish intent. If price breaks 0.022 with volume, continuation move toward resistance zones likely. Solid scalp + intraday opportunity with controlled risk.
Smart traders wait, confirm, then execute — this setup can pay. Wait confirm 🚀
Tap to trade
BTC4,68%
ETH7,78%
BLESS123,37%
post-image
post-image
  • Reward
  • 1
  • Repost
  • Share
KingTraders:
Hey guys like and share my content if you read 😉
Yesterday, I saw Huihui mention that recently, these explosive knockoff coins share a few characteristics
Opening price breaks below the initial price
There is a head-and-shoulders pattern
Long periods of washout
KOLs come out to induce shorting
Rapid rise and sharp decline
Based on these features, I looked for other similar coins that haven't yet experienced a big surge in this round. These are all pump-and-dump coins, not relying on community fundamentals or favorable market conditions. To put it plainly, they are pure gambling, and it's uncertain how long the washout will last.
RAVE63,32%
BLESS123,01%
View Original
post-image
post-image
post-image
  • Reward
  • 1
  • Repost
  • Share
TalkingAboutAGoodHarvestAmidst:
MYX
Load More