Futures
Access hundreds of perpetual contracts
TradFi
Gold
One platform for global traditional assets
Options
Hot
Trade European-style vanilla options
Unified Account
Maximize your capital efficiency
Demo Trading
Introduction to Futures Trading
Learn the basics of futures trading
Futures Events
Join events to earn rewards
Demo Trading
Use virtual funds to practice risk-free trading
Launch
CandyDrop
Collect candies to earn airdrops
Launchpool
Quick staking, earn potential new tokens
HODLer Airdrop
Hold GT and get massive airdrops for free
Launchpad
Be early to the next big token project
Alpha Points
Trade on-chain assets and earn airdrops
Futures Points
Earn futures points and claim airdrop rewards
More
Zhang Yaoxi: The U.S. side is expected to suspend the ceasefire for one month, and the rebound in gold prices has increased bullish expectations
Zhang Yaoxi: U.S. Expected to Halt Fire for One Month, Gold Prices Rebound with Increased Bullish Sentiment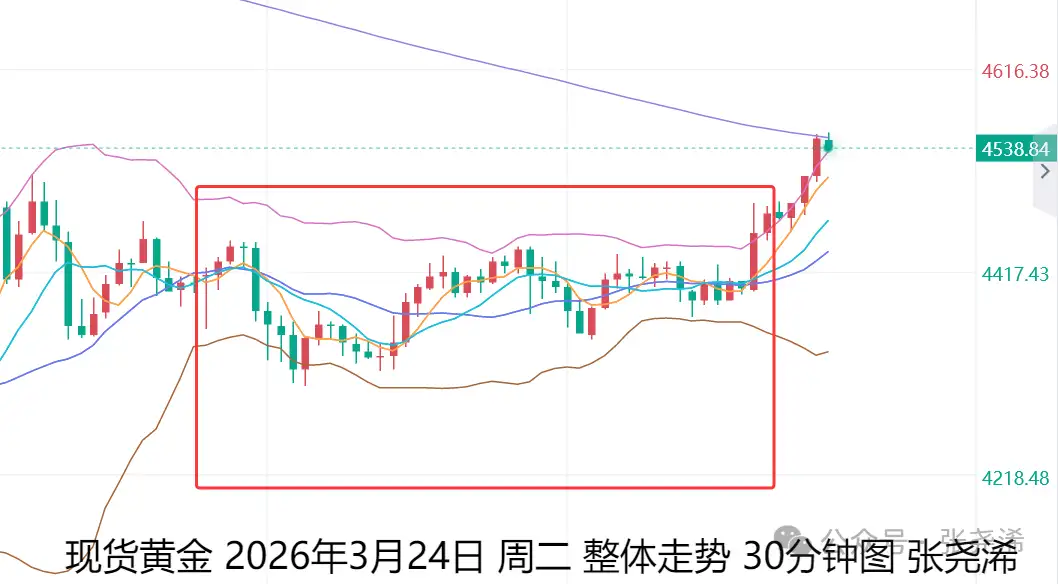
On the previous trading day, Tuesday (March 24): International gold prices bottomed out and closed higher. Amid reports that the U.S. plans to establish a one-month ceasefire, gold prices surged in the late session. They closed above the 144-day moving average and showed consecutive long lower shadows, indicating a clear bottoming pattern. This suggests that the recent decline has likely bottomed out, and the market may see a rebound, with targets potentially reaching $4,700 or $5,100.
In terms of specific movement, gold opened at $4,412.83 per ounce during Asian trading, briefly dipped to an intraday low of $4,305.98, then stabilized and gradually rose. In the early morning hours, it quickly broke through intraday resistance and the opening price, reaching an intraday high of $4,484.03. It ultimately closed at $4,474.34, with a daily range of $178.05, up $61.51, a 1.39% increase.
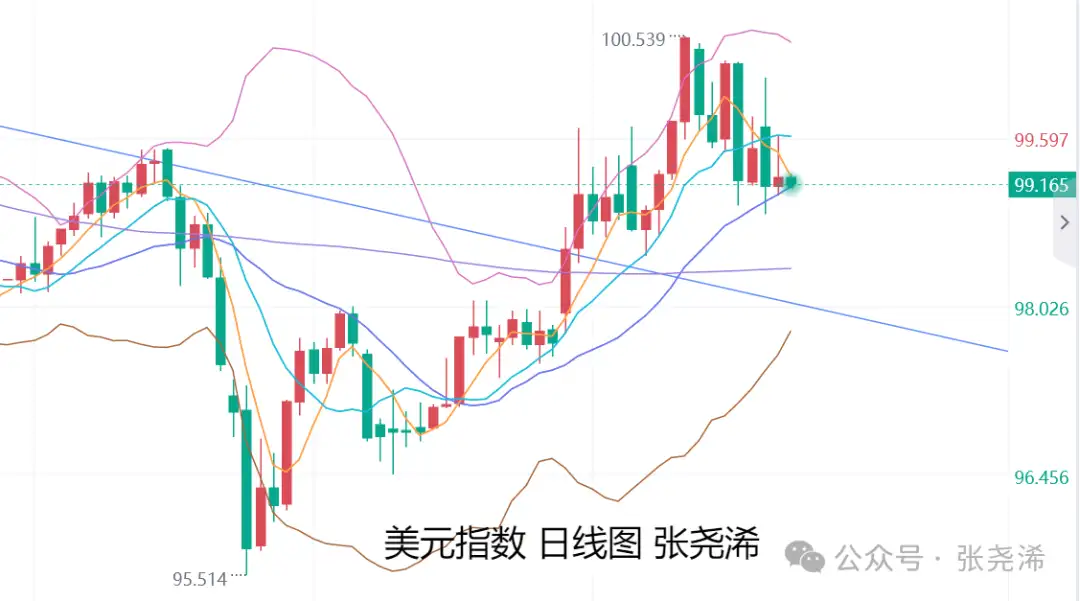
Looking ahead to today, Wednesday (March 25): International gold continued its overnight rebound at the open, strengthening further. The U.S. dollar index and crude oil prices were initially weak, providing some support. Additionally, mediators from Turkey, Egypt, and Pakistan are pushing for a meeting between U.S. and Iranian officials within the next 48 hours. The U.S. is also considering a one-month ceasefire proposal to discuss a 15-point agreement aimed at ending the conflict with Iran, which has shifted geopolitical risks and supported gold prices.
However, these factors are only expectations. Until substantial negotiations produce concrete results, gold’s rebound is likely limited, and prices may remain in a consolidation phase with oscillations.
Recently, the blockade of the Strait of Hormuz has driven oil prices higher, reigniting inflation concerns and shifting market expectations from rate cuts to possible rate hikes within the year. With the dollar and U.S. Treasury yields rising, gold’s safe-haven appeal has temporarily diminished. Although it has stabilized after a sharp decline and rebounded somewhat, it still faces significant pressure from high interest rates. The short-term trend heavily depends on the next developments in Middle Eastern tensions.
In the longer term, the worst-case scenario is a complete blockade of the strait, but this is unlikely because Iran lacks the economic resilience for sustained blockade and faces international countermeasures. The most probable scenario is phased disruptions and selective navigation bans until the U.S.-Israel-Iran conflict de-escalates.
Thus, the worst outcome has already materialized. For gold, the downside has been reached; further declines could present better entry points. Even if oil prices continue to rise, it will create greater momentum for a larger bull market in the future.
Compared to the oil price doubling rallies from July 2007 to August 2008 and between 2020 and 2022, gold has historically entered bull markets afterward. Therefore, the current oil price increase is also setting the stage for a bull run in the second half of this year or next year.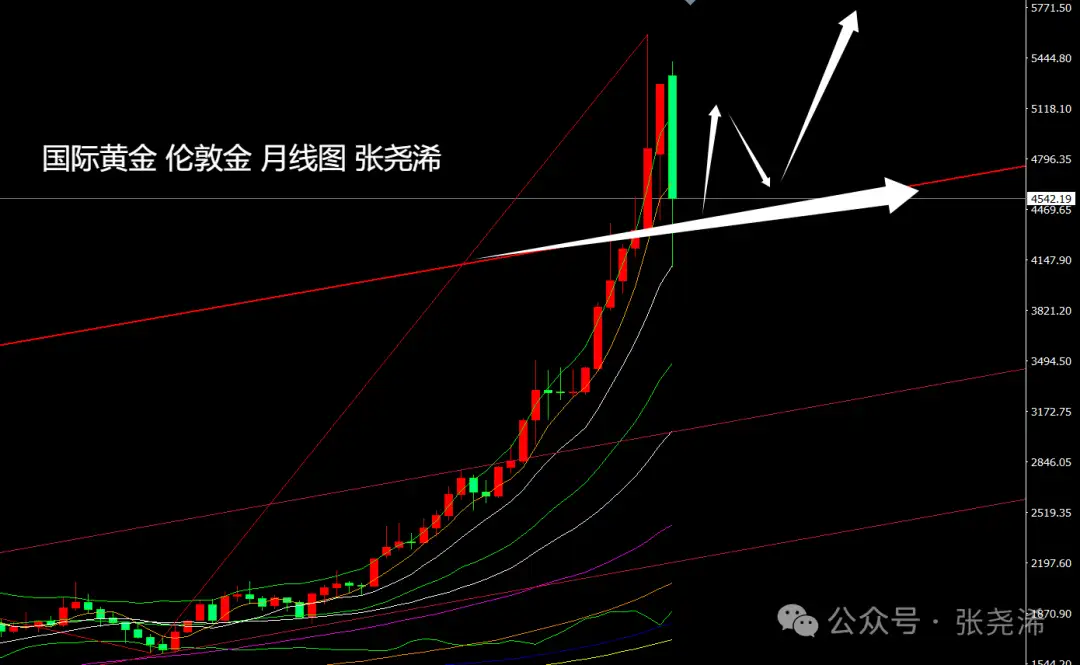
Regarding Federal Reserve monetary policy expectations, recent speeches from multiple officials suggest that while rate hikes are not entirely ruled out, there is a consensus that no hikes will occur this year, and rate cuts are still expected. Some forecasts even project four rate cuts by 2026. As gold prices have sharply retreated, this is already pricing in rate hike expectations, and with the current rate-cut cycle, gold remains bullish. Paying attention to the current low points for potential entry is a good strategy for positioning ahead of a possible surge past $6,000 in the second half.
On the technical side, the monthly chart shows that gold has been weakening this month, temporarily recovering some of the gains from the previous three months, hinting at a potential reversal to a bull trend. However, it has not yet broken below the previous upward trendline support and has rebounded back above it. If the month closes above this support, the outlook will favor continued consolidation and subsequent upward movement.
On the weekly chart, after further declines, gold has bottomed and begun to rebound. If this pattern holds through the week’s close, a move back above $5,000 is possible.
On the daily chart, gold again formed a bottoming and rebound pattern yesterday. The open today continues this momentum, but resistance from multiple moving averages remains. If it reaches these resistance levels, caution is needed for potential pullbacks. A breakout above resistance would turn the outlook bullish and strengthen the rebound.
Gold: support around $4,440 or $4,400; resistance near $4,600 or $4,715;
Silver: support around $70.80 or $68.20; resistance near $74.85 or $77.60;
Note:
Gold TD = (International gold price × exchange rate) / 31.1035
A $1 fluctuation in international gold prices roughly equals a $0.25 change in Gold TD (theoretical).
U.S. futures gold price = London spot price × (1 + gold swap rate × days to expiry / 365)
Follow me to make your gold trading ideas clearer!
Reviewing historical causes and effects, interpreting the current environment, and projecting future trends—adopting bold predictions and cautious trading principles. – Zhang Yaoxi
The above opinions and analyses are solely the author’s personal views, for reference only, and do not constitute trading advice. Operate at your own risk.
You decide your own money.