Trade
Trading Type
Spot
Trade crypto freely
Alpha
Points
Get promising tokens in streamlined on-chain trading
Pre-Market
Trade new tokens before they are officially listed
Margin
Magnify your profit with leverage
Convert & Block Trading
0 Fees
Trade any size with no fees and no slippage
Leveraged Tokens
Get exposure to leveraged positions simply
Futures
Futures
Hundreds of contracts settled in USDT or BTC
Options
HOT
Trade European-style vanilla options
Unified Account
Maximize your capital efficiency
Demo Trading
Futures Kickoff
Get prepared for your futures trading
Futures Events
Participate in events to win generous rewards
Demo Trading
Use virtual funds to experience risk-free trading
Earn
Launch
CandyDrop
Collect candies to earn airdrops
Launchpool
Quick staking, earn potential new tokens
HODLer Airdrop
Hold GT and get massive airdrops for free
Launchpad
Be early to the next big token project
Alpha Points
NEW
Trade on-chain assets and enjoy airdrop rewards!
Futures Points
NEW
Earn futures points and claim airdrop rewards
Investment
Simple Earn
Earn interests with idle tokens
Auto-Invest
Auto-invest on a regular basis
Dual Investment
Buy low and sell high to take profits from price fluctuations
Soft Staking
Earn rewards with flexible staking
Crypto Loan
0 Fees
Pledge one crypto to borrow another
Lending Center
One-stop lending hub
VIP Wealth Hub
Customized wealth management empowers your assets growth
Private Wealth Management
Customized asset management to grow your digital assets
Quant Fund
Top asset management team helps you profit without hassle
Staking
Stake cryptos to earn in PoS products
BTC Staking
HOT
Stake BTC and earn 10% APR
GUSD Minting
Use USDT/USDC to mint GUSD for treasury-level yields
More
2100NEWS WEEKLY CRYPTO REPORT Dec-19
The NWST1100 index fell 3.18% last week; Sky (SKY), a large-cap Ethereum-based Token, has made the most significant leap in rank within the NWSL100 crypto index on a biweekly basis.
*Below, we present a standardized weekly report and next week’s outlook, prepared based on the Theory Swingtum of intelligent finance. We gauge the crypto market’s breadth and direction by showing the 2100NEWS Digital Assets Total Index (NWST1100), which measures the performance of 1100 (by market capitalization) significant crypto assets. The information-laden chart is complex to read initially, but it effectively displays essential price information, key decision-making levels, momentum, trading volumes, and crypto market breadth. Monitoring Market Sentiment and Breadth is necessary to detect early signs of trend reversals or continued strength.
The NWST1100 index declined 3.18%, experiencing elevated volatility and predominantly bearish sentiment. The NWST1100 index started the week marginally positive but quickly slipped into a phase of accelerated declines after multiple failed upside breakouts. Selling pressure intensified mid-week, reflecting fragile confidence and repeated rejection patterns across major indices. After a brief FOMC-related rebound on December 15 and a V-shaped recovery attempt on December 16, the market failed to sustain upside momentum. Renewed rejections on December 17 and 18 pushed prices lower once again. A decisive shift occurred on December 19, when the market executed a convincing breakout from a falling wedge, triggering a reversal higher.
According to the chart on the right, across all major segments (NWST1100, NWSET100, NWSL100, NWSCo100), A50R readings — the share of assets trading above their 50-day EMAs — have rebounded to levels from 7% to 14%. Ethereum Tokens (NWSET100) cohort remains the weakest, with only 7% of its constituents above their 50-day averages. Overall, the breadth structure signals the absence of broad participation behind the rebound.
*This breadth indicator is essential in measuring the internal strength or weakness of the underlying index. Looking at the chart on the right side, we can see the A50R lines for four different categories of digital assets:
📉 Summary
Despite a strong upside reversal on December 19, the crypto market remains in a corrective phase. The week was dominated by volatility, failed breakouts, and renewed selling pressure before a late-week technical breakout shifted sentiment modestly higher. Momentum is stabilizing but still weak, and breadth remains deeply oversold. Leadership is narrow, with Ether outperforming Bitcoin and broader indices. The market has transitioned from capitulation toward tentative stabilization, not yet a confirmed trend reversal.
Outlook for the Week Ahead
This section provides a probabilistic assessment of the cryptocurrency market’s short-term trajectory. While markets remain inherently unpredictable, cyclical patterns in price behavior and momentum often reveal recurring structures that help identify the next likely phase of development.
📌 Target and Scenario Considerations:
Most likely scenario: The cryptocurrency market is in a controlled rebound within the descending channel, driven by momentum relief, tentative breadth stabilization, and seasonal support. A sustained breakout would still require confirmation through stronger participation and follow-through beyond key resistance zones.
📍 Key Levels to Watch:
Investors and traders often rely on historical performance data to make informed decisions about their cryptocurrency holdings. After analyzing the table data, it is evident that the crypto market declined; the overall index fell by 3.18% over the last week.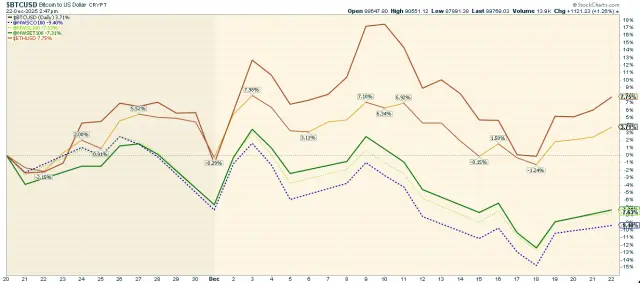 The accompanying chart highlights the performance of key cryptocurrencies, including Bitcoin and Ether, alongside the 2100NEWS Indices, which track Ethereum-based tokens (NWSET100), large caps (NWSL100), and coins (NWSCo100). Among these, Ether stood out, outperforming other segments with a 7.75% gain over the past thirty days.
While the broader market has advanced, different segments and individual cryptocurrencies exhibit different performance dynamics.
Performance Trends by Market Segment:
✔ Bitcoin, Ether, NWS30, and NWSBE****led the market,
✔ NWSET100 (Ethereum-based tokens), NWSCo100 (Coins) and NWSL100 (Large Caps) lagged.
Investors and traders might use this information to adjust their portfolios, possibly shifting focus toward assets with stronger relative momentum while being cautious about those in the Weakening quadrant.
*RRG® charts show the relative strength and momentum of groups of digital assets. Those with strong relative strength and momentum appear in the green Leading quadrant. As relative momentum fades, they typically move into the yellow Weakening quadrant. If relative strength then fades, they move into the red Lagging quadrant. Finally, when momentum picks up again, they shift into the blue Improving quadrant.
Crypto (Digital Assets) compared with global equity
This report offers a comprehensive analysis comparing the performance of digital assets, as represented by the NWST1100 index, with that of shares on global capital markets, as measured by the Dow Jones Global W1Dow index. We draw insights into historical achievements and potential future trends by examining their performances over various time frames.
Let’s break down the key observations and implications:
The recent pullback highlights a fundamental truth in crypto investing: market swings define opportunity. Historically, digital assets have significantly outperformed global equities, but their returns often come in concentrated bursts that follow periods of pessimism and capitulation. Prices have fallen below the 143-day EMA, positioning the market at a technically and psychologically critical juncture. While caution remains warranted, current price levels could present compelling opportunities for disciplined investors preparing for the next leg in crypto’s broader market cycle.
*The box in the middle of the chart shows the original NWST1100 price; at the bottom is W1Dow
Indices Revision 12-19-2025
Following the latest biweekly revision, the Sky and Midnight improved their rankings and were added to the NWSL100 index. On the other hand, JasmyCoin and Pendle were removed from the NWSL100 index. Meanwhile, several adjustments were made to the mid-cap index (NWSM200), with new projects introduced and weaker ones removed, reflecting the ongoing dynamism of that segment. The new mid-cap assets, including Stable, Venom, Ultima, and others, have been added to the NWSM200 index. Each index’s presentation provides more details on additions and deletions across the broader 2100NEWS index family.
Winning member
Congratulations to Sky (SKY) on achieving a significant milestone: being recognized as the winning member of the NWSL100 crypto index, marking a crucial leap in the ranking of index constituents.
*We elect the member of the NWSL100 crypto index with the most significant jump in our ranking. We will examine how the market rates the project’s progress in case of price changes. It seems important to us whether the project is out of the ordinary tide of crypto project prices. Peer comparisons should be efficient and effective, from an investor’s perspective
SKY, a large-cap Ethereum-based Token, is ranked 93rd in the 2100NEWS ranking. It is an Index member: NWST1100, NWSL100, NWSTo100, NWSET100
2100NEWS DA Orderbook Quality Evaluation Grade: Extremely weak, Score: 5.7, (Average for Large-caps: 17.3)
Over the past week, the average market capitalization was $1,452.8 million, and the average daily trading volume was $20.1 million.
Sky (SKY) is the decentralized protocol that emerged from MakerDAO’s 2024 rebrand, designed to scale DeFi while strengthening governance and user autonomy. At its core is USDS, an upgraded successor to DAI that preserves 1:1 redeemability while offering a built-in Sky Savings Rate of roughly 4–4.5% through non-custodial smart contracts. Built on Ethereum and extended via Layer-2 integrations, Sky emphasizes modularity through independent sub-ecosystems called Sky Stars, such as Spark (lending) and Grove (credit), which innovate while sharing common infrastructure. The SKY token replaces MKR as the sole governance asset, enabling onchain voting, staking rewards, and deflationary buybacks funded by protocol revenue. Sky positions itself as institutional-grade DeFi infrastructure, balancing scalability, transparency, and decentralized governance.