Trade
Trading Type
Spot
Trade crypto freely
Alpha
Points
Get promising tokens in streamlined on-chain trading
Pre-Market
Trade new tokens before they are officially listed
Margin
Magnify your profit with leverage
Convert & Block Trading
0 Fees
Trade any size with no fees and no slippage
Leveraged Tokens
Get exposure to leveraged positions simply
Futures
Futures
Hundreds of contracts settled in USDT or BTC
Options
HOT
Trade European-style vanilla options
Unified Account
Maximize your capital efficiency
Demo Trading
Futures Kickoff
Get prepared for your futures trading
Futures Events
Participate in events to win generous rewards
Demo Trading
Use virtual funds to experience risk-free trading
Earn
Launch
CandyDrop
Collect candies to earn airdrops
Launchpool
Quick staking, earn potential new tokens
HODLer Airdrop
Hold GT and get massive airdrops for free
Launchpad
Be early to the next big token project
Alpha Points
NEW
Trade on-chain assets and enjoy airdrop rewards!
Futures Points
NEW
Earn futures points and claim airdrop rewards
Investment
Simple Earn
Earn interests with idle tokens
Auto-Invest
Auto-invest on a regular basis
Dual Investment
Buy low and sell high to take profits from price fluctuations
Soft Staking
Earn rewards with flexible staking
Crypto Loan
0 Fees
Pledge one crypto to borrow another
Lending Center
One-Stop Lending Hub
VIP Wealth Hub
Customized wealth management empowers your assets growth
Private Wealth Management
Customized asset management to grow your digital assets
Quant Fund
Top asset management team helps you profit without hassle
Staking
Stake cryptos to earn in PoS products
BTC Staking
HOT
Stake BTC and earn 10% APR
GUSD Minting
Use USDT/USDC to mint GUSD for treasury-level yields
More


- Trending TopicsView More
256.23K Popularity
49.21K Popularity
5.6K Popularity
7.39K Popularity
7.31K Popularity
- Hot Gate FunView More
- MC:$3.65KHolders:30.05%
- MC:$3.79KHolders:40.67%
- MC:$3.6KHolders:10.00%
- MC:$3.61KHolders:10.00%
- MC:$3.67KHolders:20.04%
- Pin
November 25 | BTC trend analysis
Core Insights
Current Price: $87,800 (as of November 25, 10:24 AM Beijing Time)
Short-term Outlook: Cautiously optimistic, there are rebound opportunities in the short term. The daily chart shows severe overselling (RSI 32), but the 4-hour chart is beginning to show positive signals. On-chain data indicates that short-term holders are capitulating, which typically marks the formation of a cyclical bottom. Social media sentiment has shifted from panic to cautious optimism, and institutional fund outflows have slowed, laying the groundwork for a potential rebound.
Key Support:
Key Resistance:
Technical Pattern Analysis
Multiple Time Frame Signals
BTC is currently at a critical turning point, with significant divergence in signals across multiple time frames. The 1-hour chart shows a neutral stance, with an RSI of 52, and the price fluctuating between the EMA moving averages. The 4-hour chart presents a mild bullish signal, with the MACD histogram turning positive and the price approaching the upper Bollinger Band. However, the daily chart remains weak, with the RSI deeply oversold at 32, and the MACD continuing to weaken.
Key price level breakthrough conditions
The technical analysis shows that a breakthrough of $88,800 will confirm a short-term rebound, targeting $89,500. If it falls below $87,000, it may accelerate the decline towards the strong support area near $85,000.
On-chain Data Pivot
capital flow characteristics
In the past 24 hours, on-chain activity for BTC shows positive signals. A net outflow of 1,889 BTC from exchanges indicates that investors are moving Bitcoin to cold wallets for long-term holding. The exchange reserves have decreased from 2.41 million BTC to 1.84 million BTC in 30 days, a drop of 24%, which creates potential support for the price due to this supply tightening.
Holder Behavior Analysis
Short-term holders are going through a capitulation process, with over 63,000 BTC transferred from long-term holders to new buyers. This pattern has historically appeared at cyclical bottoms. At the same time, large transactions (over $1 million) reached 29,000 this week, possibly marking the most active whale trading week of 2025, indicating that big capital is repositioning.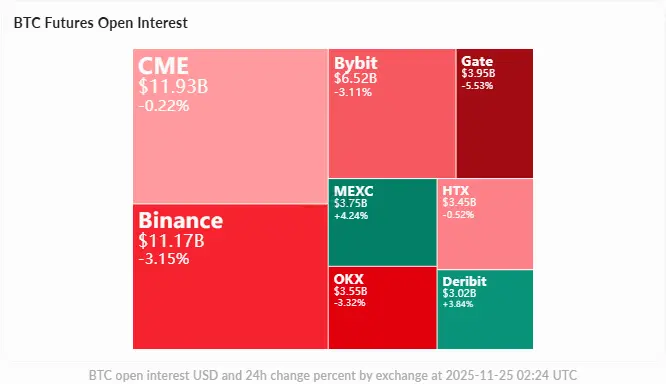
Derivatives Market Status
Position and Liquidation Risk
The total open interest is $59.7 billion, down 1.12% in the last 24 hours, indicating that leverage is decreasing. The funding rates have turned negative (Binance -0.0034%, Bybit -0.0047%), with shorts paying longs, providing support for price stability or an increase.
The liquidation risk chart shows an asymmetric distribution: around $85,040, there is a concentration of $1.6 billion in long liquidations, while above $90,620, there is only $983 million in short liquidations, suggesting a greater risk of a downward breakout. However, if the key support is maintained, the upward resistance is relatively small.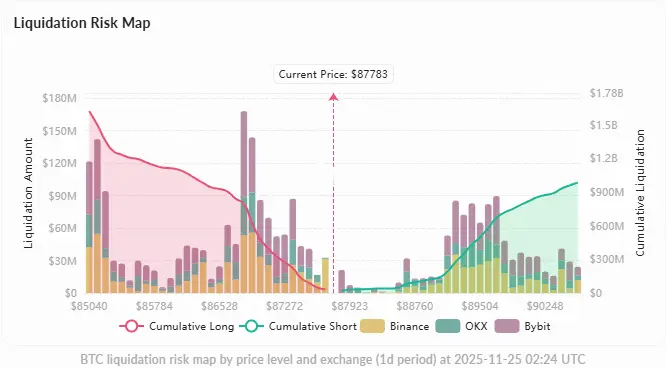
Impact of the Macroeconomic Environment
Recently, the BTC trend has been significantly influenced by macro factors, with a net outflow of $3.5 billion in ETFs in November, setting a historical record. However, this process of institutional deleveraging may be nearing its end, and market panic has reached its lowest level in nearly two years, often indicating a reversal opportunity.
The Federal Reserve's interest rate cut expectations (67% probability in December) and the upcoming economic data (retail sales, PPI) will provide important catalysts for short-term trends.
Overall Assessment
Considering the overall technical analysis, on-chain data, and market sentiment, BTC is currently in a key support zone and has conditions for a short-term rebound. The oversold state on the daily chart, combined with the continuous outflow of funds from exchanges, provides a basis for a fluctuating rebound in the $87,000-$89,000 range. Investors should closely monitor the effectiveness of the $87,000 support, and a breakout above $88,800 will confirm the short-term rebound trend.