Trade
Trading Type
Spot
Trade crypto freely
Alpha
Points
Get promising tokens in streamlined on-chain trading
Pre-Market
Trade new tokens before they are officially listed
Margin
Magnify your profit with leverage
Convert & Block Trading
0 Fees
Trade any size with no fees and no slippage
Leveraged Tokens
Get exposure to leveraged positions simply
Futures
Futures
Hundreds of contracts settled in USDT or BTC
Options
HOT
Trade European-style vanilla options
Unified Account
Maximize your capital efficiency
Demo Trading
Futures Kickoff
Get prepared for your futures trading
Futures Events
Participate in events to win generous rewards
Demo Trading
Use virtual funds to experience risk-free trading
Earn
Launch
CandyDrop
Collect candies to earn airdrops
Launchpool
Quick staking, earn potential new tokens
HODLer Airdrop
Hold GT and get massive airdrops for free
Launchpad
Be early to the next big token project
Alpha Points
NEW
Trade on-chain assets and enjoy airdrop rewards!
Futures Points
NEW
Earn futures points and claim airdrop rewards
Investment
Simple Earn
Earn interests with idle tokens
Auto-Invest
Auto-invest on a regular basis
Dual Investment
Buy low and sell high to take profits from price fluctuations
Soft Staking
Earn rewards with flexible staking
Crypto Loan
0 Fees
Pledge one crypto to borrow another
Lending Center
One-Stop Lending Hub
VIP Wealth Hub
Customized wealth management empowers your assets growth
Private Wealth Management
Customized asset management to grow your digital assets
Quant Fund
Top asset management team helps you profit without hassle
Staking
Stake cryptos to earn in PoS products
BTC Staking
HOT
Stake BTC and earn 10% APR
GUSD Minting
Use USDT/USDC to mint GUSD for treasury-level yields
More


- Trending TopicsView More
250.38K Popularity
42.04K Popularity
3.73K Popularity
6.61K Popularity
6.21K Popularity
- Hot Gate FunView More
- MC:$3.71KHolders:20.00%
- MC:$3.86KHolders:21.01%
- MC:$4.07KHolders:22.86%
- MC:$3.66KHolders:10.00%
- MC:$3.65KHolders:10.00%
- Pin
November 20 | BTC Trend Analysis
Core Insights
Current Price: $91,804 ( as of November 20, 09:10 Beijing Time )
Short-term Outlook: Neutral to cautiously optimistic
Key Support:
Key Resistance:
Technical Analysis
multi-timeframe evaluation
The short-term technical analysis shows that the MACD histogram on the 1-hour and 4-hour levels has turned positive, indicating a weakening of bearish momentum. The daily chart is severely oversold, creating conditions for a rebound, but the price remains below all major moving averages.
Derivatives Data
The total market open interest is $6.711 billion, with a 24-hour increase of 2.52%. The funding rate remains slightly positive at ( Binance 0.0034%, Bybit/OKX 0.01%), indicating a relatively balanced long and short position, with no extreme sentiment.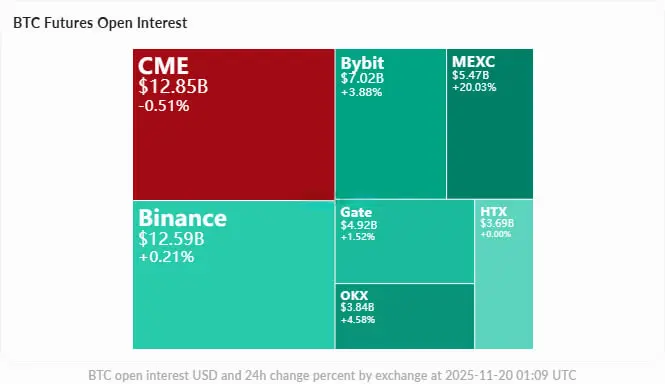
On-chain Analysis
Exchange liquidity
The continued net outflow indicates that long-term holders are accumulating, reducing the selling pressure on exchanges. The exchange's BTC reserves have fallen to 2.37 million coins, a multi-month low.
Whale Movement
This week, whale trading activity reached a new high in 2025, with over 102,900 large transactions exceeding 100,000 USD. Key findings:
Market Sentiment
( social media sentiment
The sentiment in the Twitter/X community is relatively cautious, with major viewpoints diverging:
) ETF trends impact
Severe outflow for Bitcoin spot ETF in the US:
Risk Assessment
Upside Catalyst:
Downside Risk:
Trading Strategy Reference
Rebound Trading: Current position long, target $96,384, stop loss $88,870, risk-reward ratio 1.22 Risk Control: If it falls below the strong support of $88,870, be wary of further declines to the $83,000-$84,000 range.
Probability Assessment: Short-term rebound probability 60%, further decline probability 30%, sideways consolidation 10%
Summary
BTC is currently in a key support area, with technical oversold conditions combined with on-chain accumulation signals creating conditions for a rebound. Whether it can stabilize above $92,400 and launch an attack towards $96,400 in the short term will largely depend on changes in macro sentiment and ETF fund flows. It is recommended to pay attention to U.S. employment data and speeches from Federal Reserve officials as important references for judging the next direction.