Futures
Access hundreds of perpetual contracts
TradFi
Gold
One platform for global traditional assets
Options
Hot
Trade European-style vanilla options
Unified Account
Maximize your capital efficiency
Demo Trading
Introduction to Futures Trading
Learn the basics of futures trading
Futures Events
Join events to earn rewards
Demo Trading
Use virtual funds to practice risk-free trading
Launch
CandyDrop
Collect candies to earn airdrops
Launchpool
Quick staking, earn potential new tokens
HODLer Airdrop
Hold GT and get massive airdrops for free
Launchpad
Be early to the next big token project
Alpha Points
Trade on-chain assets and earn airdrops
Futures Points
Earn futures points and claim airdrop rewards
More
Understanding the MVRV Z-Score Indicator in Crypto Analysis
Understanding the MVRV Z-Score Indicator
The MVRV Z-Score is a powerful tool for assessing Bitcoin’s market valuation. This indicator compares Bitcoin’s current market capitalization to its realized capitalization, helping identify potential market tops and bottoms. Currently, the MVRV Z-Score hovers between 2 and 3, placing it in a “neutral” zone. This suggests that the market is not overheated, as it remains far from the “red” zone (7 to 9) typically associated with market peaks.
Historical Context and Market Cycles
During previous bull market peaks, the MVRV Z-Score has historically climbed above 7. For instance, in early 2021, when Bitcoin’s price reached $60,000 to $65,000, the indicator surpassed 7. Conversely, during the 2022 bear market, the indicator dipped below 0, entering the “green” zone and signaling an oversold market.
Current Market Positioning
With the MVRV Z-Score slightly above 2, in the blue/yellow zone, Bitcoin’s price is not considered expensive by historical standards. This positioning suggests significant room for upward movement before the end of the current market cycle. Even if Bitcoin were to reach $100,000 to $110,000, it would not be deemed “expensive” according to MVRV standards.
Future Potential and Price Projections
If Bitcoin follows historical patterns, the MVRV Z-Score could potentially climb to 5-7 or higher, implying substantial growth potential for the market. Based on historical trends, Bitcoin’s peak price could significantly exceed $100,000, possibly even reaching beyond $200,000, depending on changes in realized market capitalization in the coming months.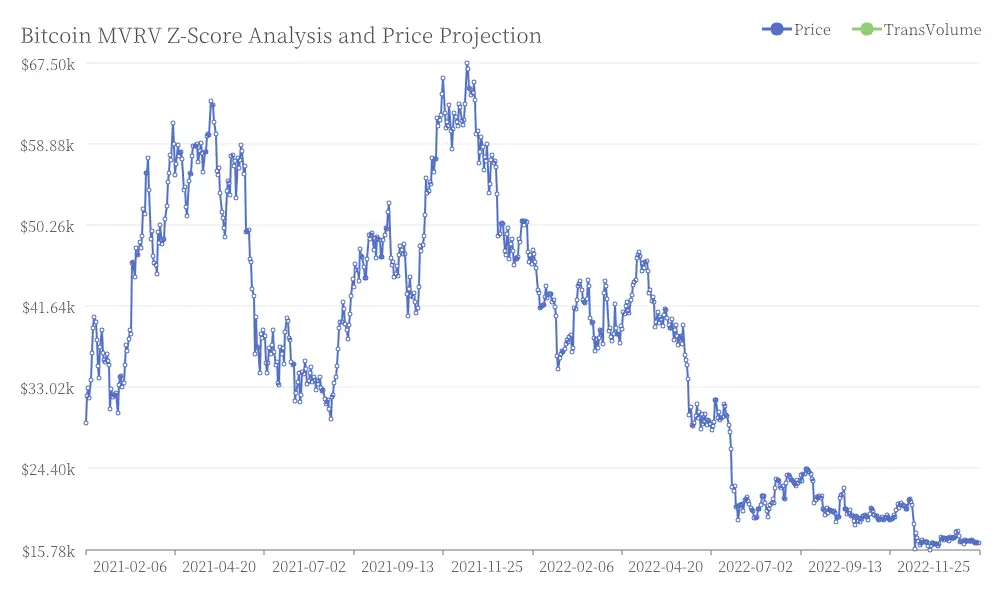 Bitcoin MVRV Z-Score Analysis and Price Projection
Implications for Investors
Understanding the MVRV Z-Score provides valuable insights for cryptocurrency investors. While the current neutral positioning suggests room for growth, investors should remember that market dynamics can change rapidly. This indicator should be used as part of a comprehensive analysis strategy that considers market sentiment, regulatory developments, and macroeconomic conditions.
The Evolution of On-Chain Metrics
As the cryptocurrency market matures, on-chain metrics like the MVRV Z-Score continue to evolve, offering increasingly sophisticated ways to analyze market behavior and valuation. However, it’s crucial to acknowledge the limitations of any single indicator and to adapt analysis methods as the market landscape changes.
Looking Ahead
While the MVRV Z-Score currently suggests potential for further price appreciation, investors should remain vigilant as market conditions can shift quickly. Past performance does not guarantee future results, so thorough research and a balanced approach to risk management remain essential when navigating the dynamic cryptocurrency market.