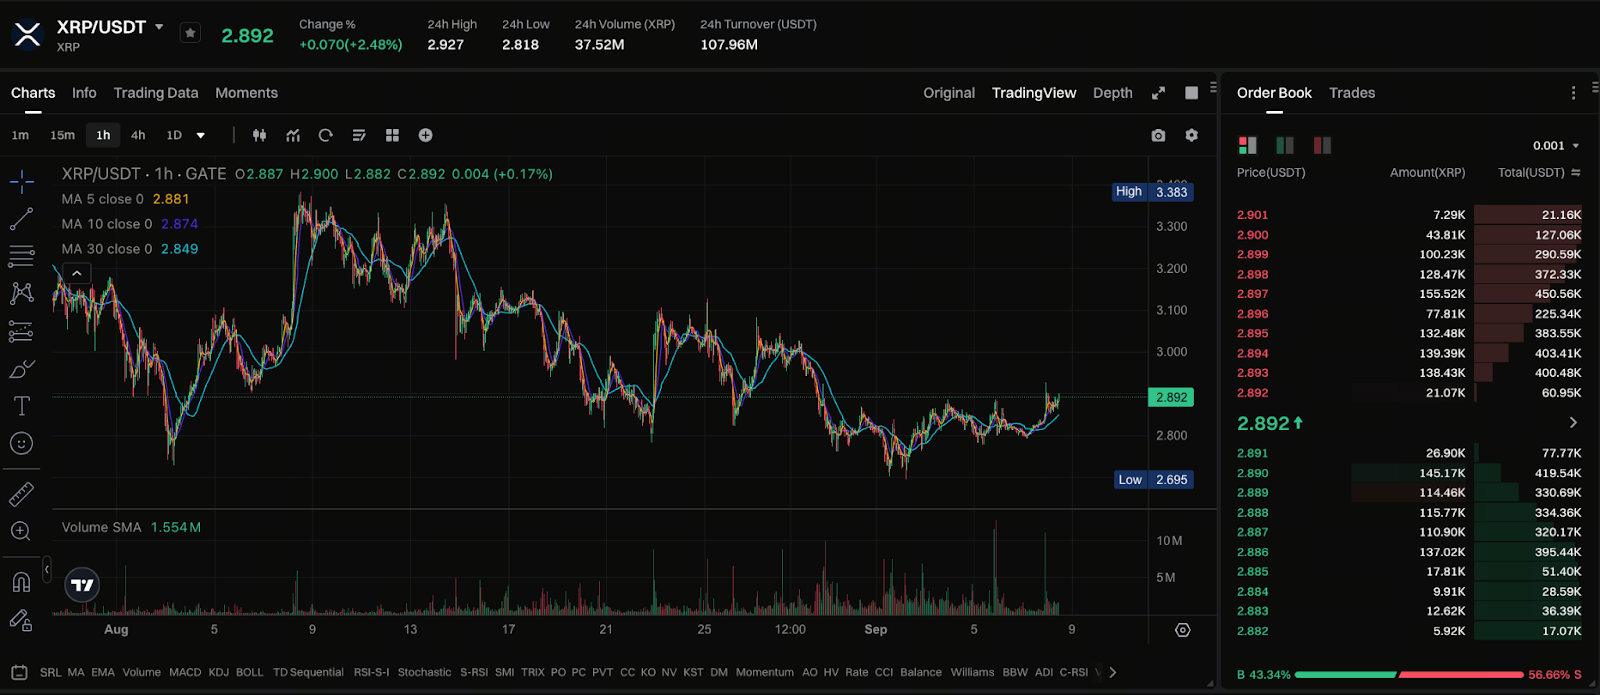
XRP Forms Double Bottom at $2.7, Analysts Identify Level as Oversold Zone
What Is a Double Bottom Pattern?
A double bottom is a widely recognized technical analysis pattern that usually appears at the end of a prolonged downtrend, indicating a potential market reversal. This pattern is defined by two low points (troughs) with a peak (intervening high) in between. When the price breaks above the level of the intervening peak, it is commonly viewed as a buy signal.
Double Bottom Formation in XRP

Chart: https://www.gate.com/trade/XRP_USDT
XRP recently formed a double bottom pattern at $2.70. Analysts highlight that this area may represent an oversold zone, suggesting a potential price rebound. If XRP surpasses the current resistance at $2.83, further upside could follow.
Market Outlook
Analyst Oscar Ramos points out that September is typically a weak month for the cryptocurrency market, whereas October and November tend to demonstrate stronger price appreciation. He also notes that several market catalysts are anticipated in the coming months, including Federal Reserve meetings and the release of key economic indicators, both of which could influence XRP’s price.
Conclusion
The double bottom pattern formed by XRP at $2.70 may serve as a technical buy signal. Should the price break above the current resistance at $2.83, additional gains may be possible. Nonetheless, investors should remain aware of market uncertainty and conduct comprehensive risk assessments before making investment decisions.
Related Articles

2025 BTC Price Prediction: BTC Trend Forecast Based on Technical and Macroeconomic Data

Flare Crypto Explained: What Is Flare Network and Why It Matters in 2025

Pi Coin Transaction Guide: How to Transfer to Gate.com

How to Use a Crypto Whale Tracker: Top Tool Recommendation for 2025 to Follow Whale Moves

What is N2: An AI-Driven Layer 2 Solution


