Where might ETH Top?
Hello readers,
Tom Lee just floated an “intermediate” ETH target of $60k and suggested Ethereum is in a 10-15 year supercycle at the Korea Blockchain Week.
If he’s right, this will play out in waves. Across multiple cycles. With bull and bear markets.
Today, we’re in a bull market. But it won’t last forever.
Given that ETH dropped 94% in 2018 and 80% in 2022, we should anticipate another sharp downturn.
We don’t know when that will occur.
But we do know the levels that ETH reached in past cycles, relative to several important KPIs we track.
This week, we share our analysis, which is designed to help you anchor to potential outcomes and plan accordingly.
Disclaimer: Views expressed are the author’s personal views and should not be relied upon as investment advice.

The DeFi Report is powered by BIT Digital, the leading global platform for high-performance computing infrastructure and one of the largest ETH treasury firms. NASDAQ: BTBT
Let’s go.
KPI Analysis & Price Targets
200 Week Moving Average
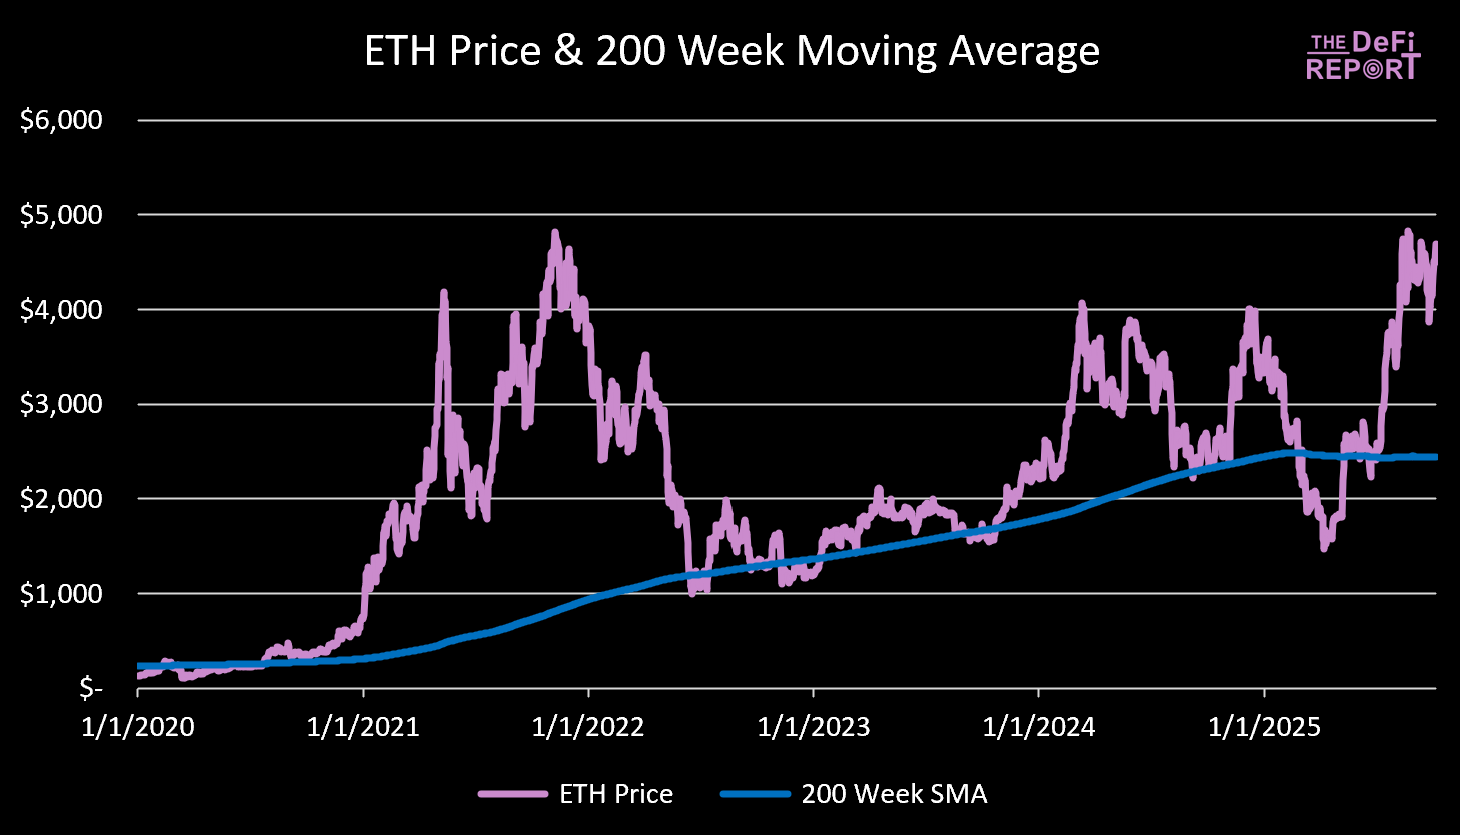
Data: The DeFi Report
ETH is currently trading at a level 92% above its 200-week moving average of $2.4k.
In the ‘21 cycle, the market peaked when ETH was trading 492% above its 200-week moving average.
Scenario Analysis:
- 200% above the 200 WMA: $7.3k
- 250% above the 200 WMA: $8.5k
- 300% above the 200 WMA: $9.8k
- 350% above the 200 WMA: $11k
- 400% above the 200 WMA: $12.2k
*The 200 WMA is a moving target; however, with each passing day, we are replacing ETH’s prices from roughly 4 years ago, when the price was in the $3-$4k range. Therefore, we expect minimal movement in the 200 WMA through the end of the year.
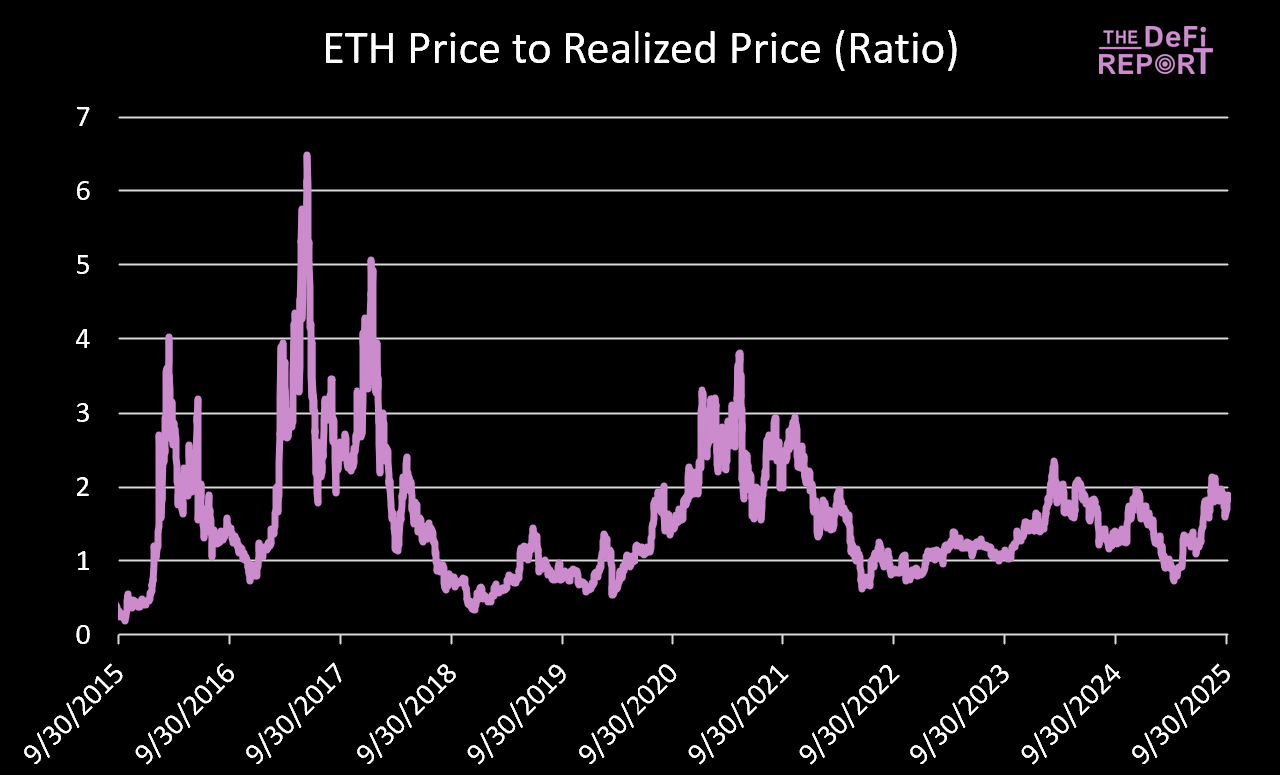
ETH Price to Realized Price
Data: The DeFi Report, Glassnode
The average ratio between ETH’s price and Realized Price (proxy for cost basis) since 1/1/17 is 1.6.
The current ratio is 1.9.
In the ‘17 cycle, we peaked at a ratio of 5.
Last cycle we peaked at 3.5 (April top) and 2.9 (Nov. top).
Scenario Analysis (assumes we reach a ratio of 2.9):
- $3k Realized Price = $8.7k ETH
- $3.5k Realized Price = $10.2k ETH
- $4k Realized Price = $11.6k ETH
*Requires the ratio to rise by 1, which has happened twice over a 3-6 month period since 1/1/23.
MVRV Z-Score
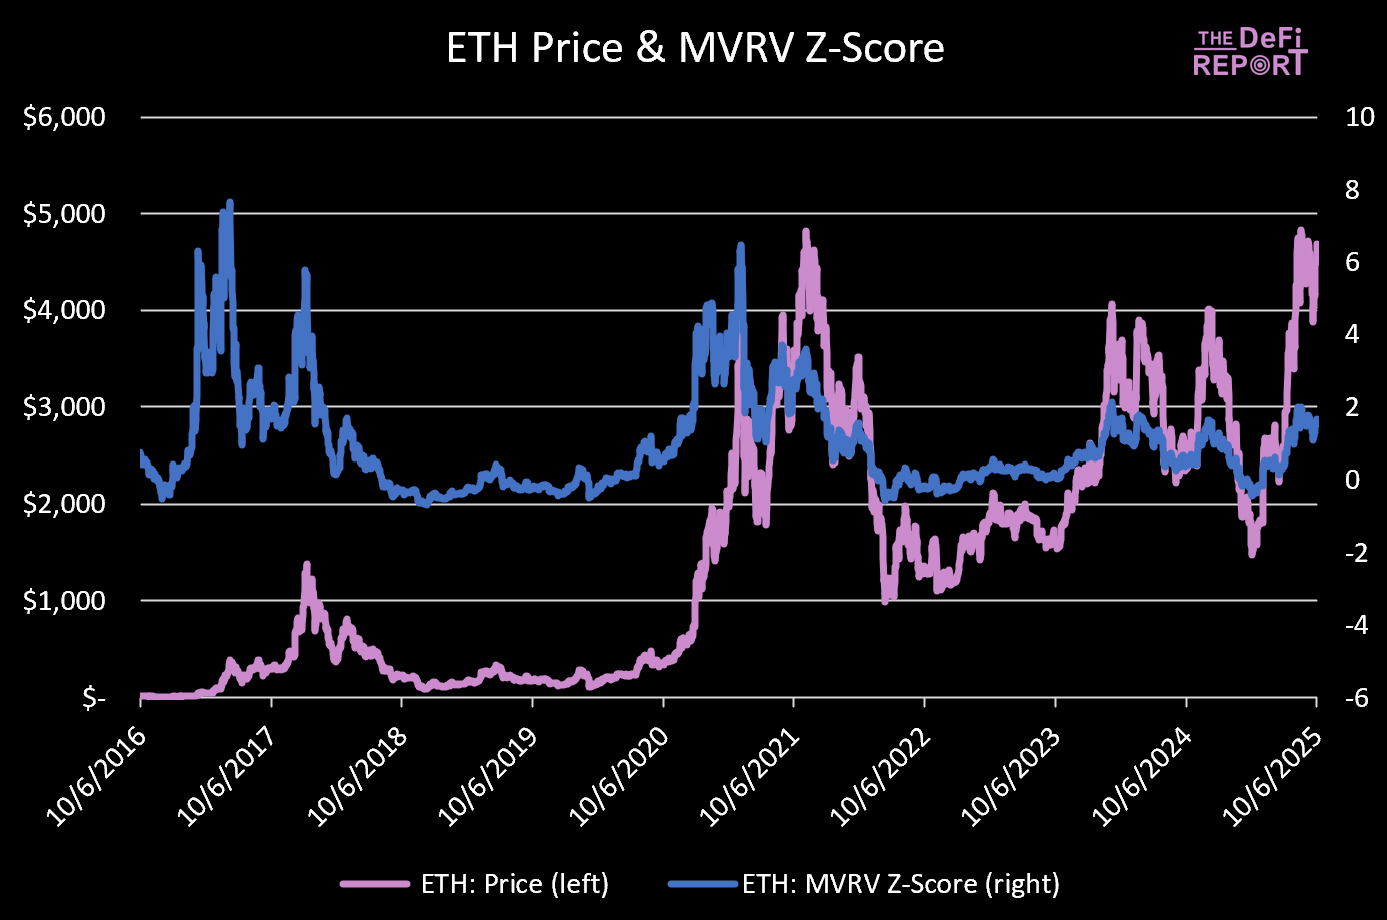
Data: The DeFi Report, Glassnode
The Z-score tells us how many “volatility units” the market cap sits above or below onchain cost basis. High values indicate statistically overheated conditions. Negative values flag undervaluation.
ETH’s average Z-score since 1/1/17 is .99 — indicating a bias toward optimism (market value higher than realized value).
The current value is 1.66 (above historical averages, but not excessively “overheated”).
We peaked at 6.5 (April top) and 3.48 (November top) last cycle.
Scenario Analysis:
- Z-score of 2.21: $7k ETH
- Z-score of 2.77: $8k ETH
- Z-score of 3.33: $9k ETH
- Z-score of 3.9: $10k ETH
*Assumes the Realized Price rises 22% by year-end (to $3k). For reference, it has risen 24% from April to today.
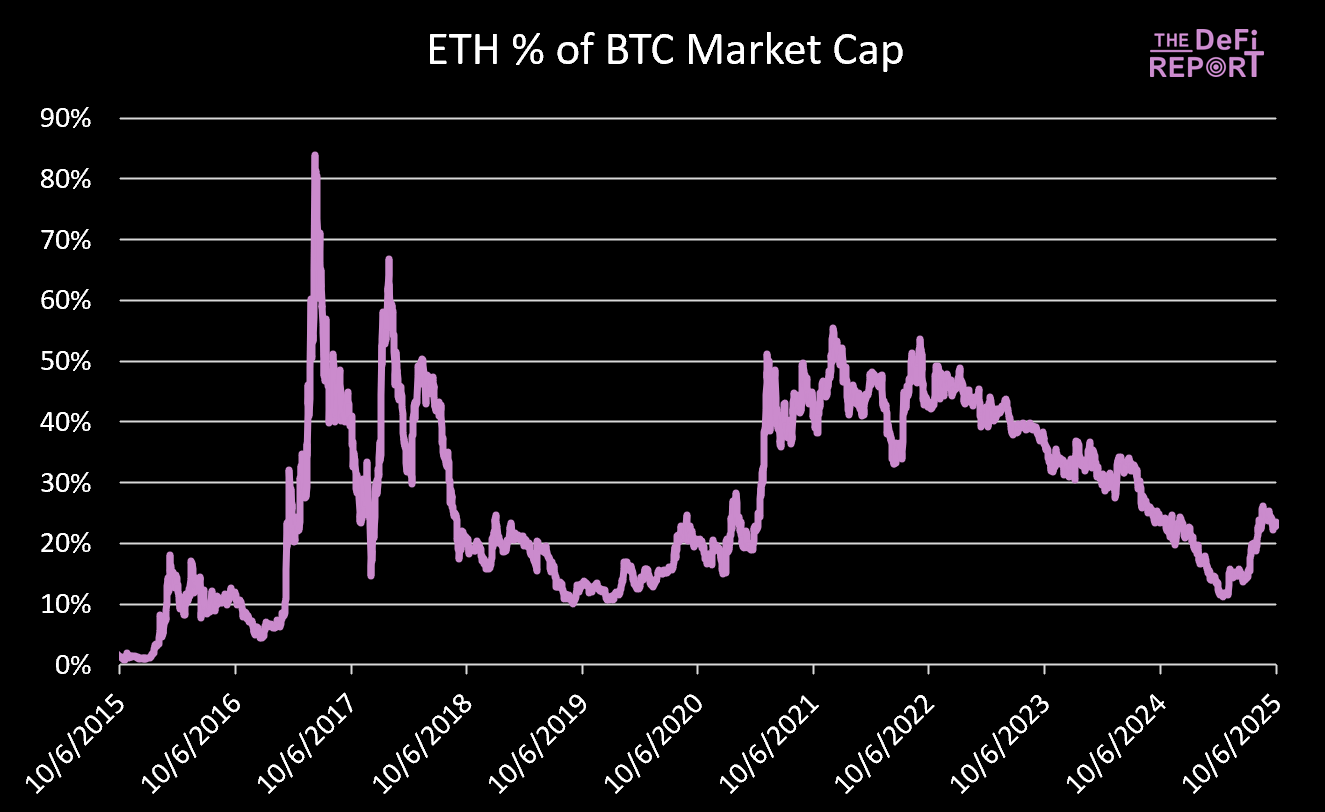
ETH vs BTC
Data: The DeFi Report
ETH is currently trading at 23.4% of BTC’s market cap.
In November 2021, ETH’s market cap peaked at 55.5% of BTC’s market cap.
If BTC reaches $150k (a 23% increase from today), this would put the BTC market cap at $3 trillion.
Scenario Analysis:
- At 35% of BTC’s market cap: $1.05 trillion, or $8,658/ETH
- At 45% of BTC’s market cap: $1.35 trillion, or $11,132/ETH
- At 55% of BTC’s market cap: $1.64 trillion, or $13,559/ETH
The key questions are whether we will see a significant move from BTC, and whether ETH’s move relative to BTC is muted or explosive compared to the last cycle.
ETH vs Nasdaq
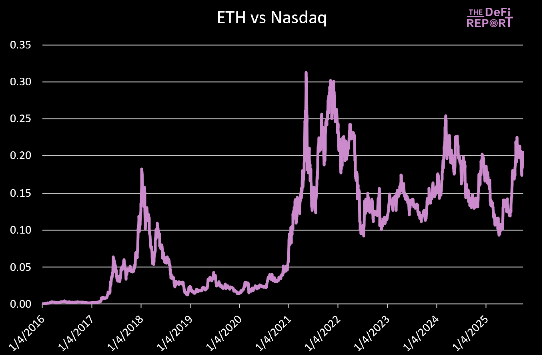
Data: The DeFi Report
The ETH/Nasdaq ratio peaked at .31 in May of ‘21 and .30 in Nov. ‘21
The current ratio is .20, with the Nasdaq trading at 22,788.
If it gains 5% by year’s end (ending the year up 23%), this puts the Nasdaq at 23,927
Scenario Analysis for ETH:
- .25 Ratio = $5,981
- .30 Ratio = $7,178
- .35 Ratio = $8,374
- .40 Ratio = $9,570
Our base case is that the cycle-to-cycle trend of increasing ETH/Nasdaq ratio continues, and we establish a new high (above .30) this cycle.
Closing Thoughts
Our base case is the following:
- ETH trades 250% above its 200 WMA ($8.5k)
- The Realized Price gets to $3k ($8.7k ETH, assuming a ratio of 2.9)
- ETH gets to 35% of BTC’s market cap. At $150k BTC, this gets ETH to $8.6k.
- ETH establishes a new high relative to the Nasdaq. .35 ratio = $8.3k ETH.
The bull case would send ETH to $10k+. The bear case would be a muted peak for BTC extending to ETH.
Meanwhile, as sentiment heats up, we’re seeing more and more “cycle extension” commentary in the market.
It reminds me of the “supercycle” narrative that was taking hold at the same stage of the ‘21 cycle.
As we’ve stated, our base case remains that we top this quarter.
Disclaimer:
- This article is reprinted from [Thedefireport]. All copyrights belong to the original author [Thedefireport]. If there are objections to this reprint, please contact the Gate Learn team, and they will handle it promptly.
- Liability Disclaimer: The views and opinions expressed in this article are solely those of the author and do not constitute any investment advice.
- Translations of the article into other languages are done by the Gate Learn team. Unless mentioned, copying, distributing, or plagiarizing the translated articles is prohibited.
Related Articles

What Is Ethereum 2.0? Understanding The Merge

Reflections on Ethereum Governance Following the 3074 Saga

What is Neiro? All You Need to Know About NEIROETH in 2025

Our Across Thesis

An Introduction to ERC-20 Tokens
