YFI vs ENJ: Kripto Para Arenasında DeFi Devlerinin Mücadelesi


Giriş: YFI ile ENJ Yatırımı Karşılaştırması
Kripto para piyasasında YearnFinance (YFI) ile Enjin Coin (ENJ) karşılaştırması, yatırımcıların göz ardı edemediği bir başlıktır. İki varlık; piyasa değeri sıralaması, kullanım alanları ve fiyat performansı açısından belirgin farklılıklar gösterirken, kripto varlık konumlandırması bakımından da birbirinden ayrılır.
YearnFinance (YFI): 2020’de piyasaya sürüldüğünden bu yana, kredi platformlarına getiri çıktısı sunan verileri toplayan bir agregasyon platformu olarak piyasanın takdirini kazanmıştır.
Enjin Coin (ENJ): 2017’de piyasaya çıkarılmıştır ve blokzincir tabanlı oyun alanında öncü olarak görülmekte; özellikle oyunlar için sanal varlıklar ve topluluk değeri oluşturmaya odaklanmaktadır.
Bu makalede, YFI ile ENJ’nin yatırım değerleri; geçmiş fiyat hareketleri, arz mekanizmaları, kurumsal benimseme, teknik ekosistemler ve gelecek öngörüleri bakımından kapsamlı şekilde analiz edilecek ve yatırımcıların en çok merak ettiği şu soruya yanıt aranacaktır:
"Şu anda hangisi daha avantajlı bir alım?"
I. Fiyat Geçmişi ve Güncel Piyasa Durumu Karşılaştırması
YFI ile ENJ Geçmiş Fiyat Hareketleri
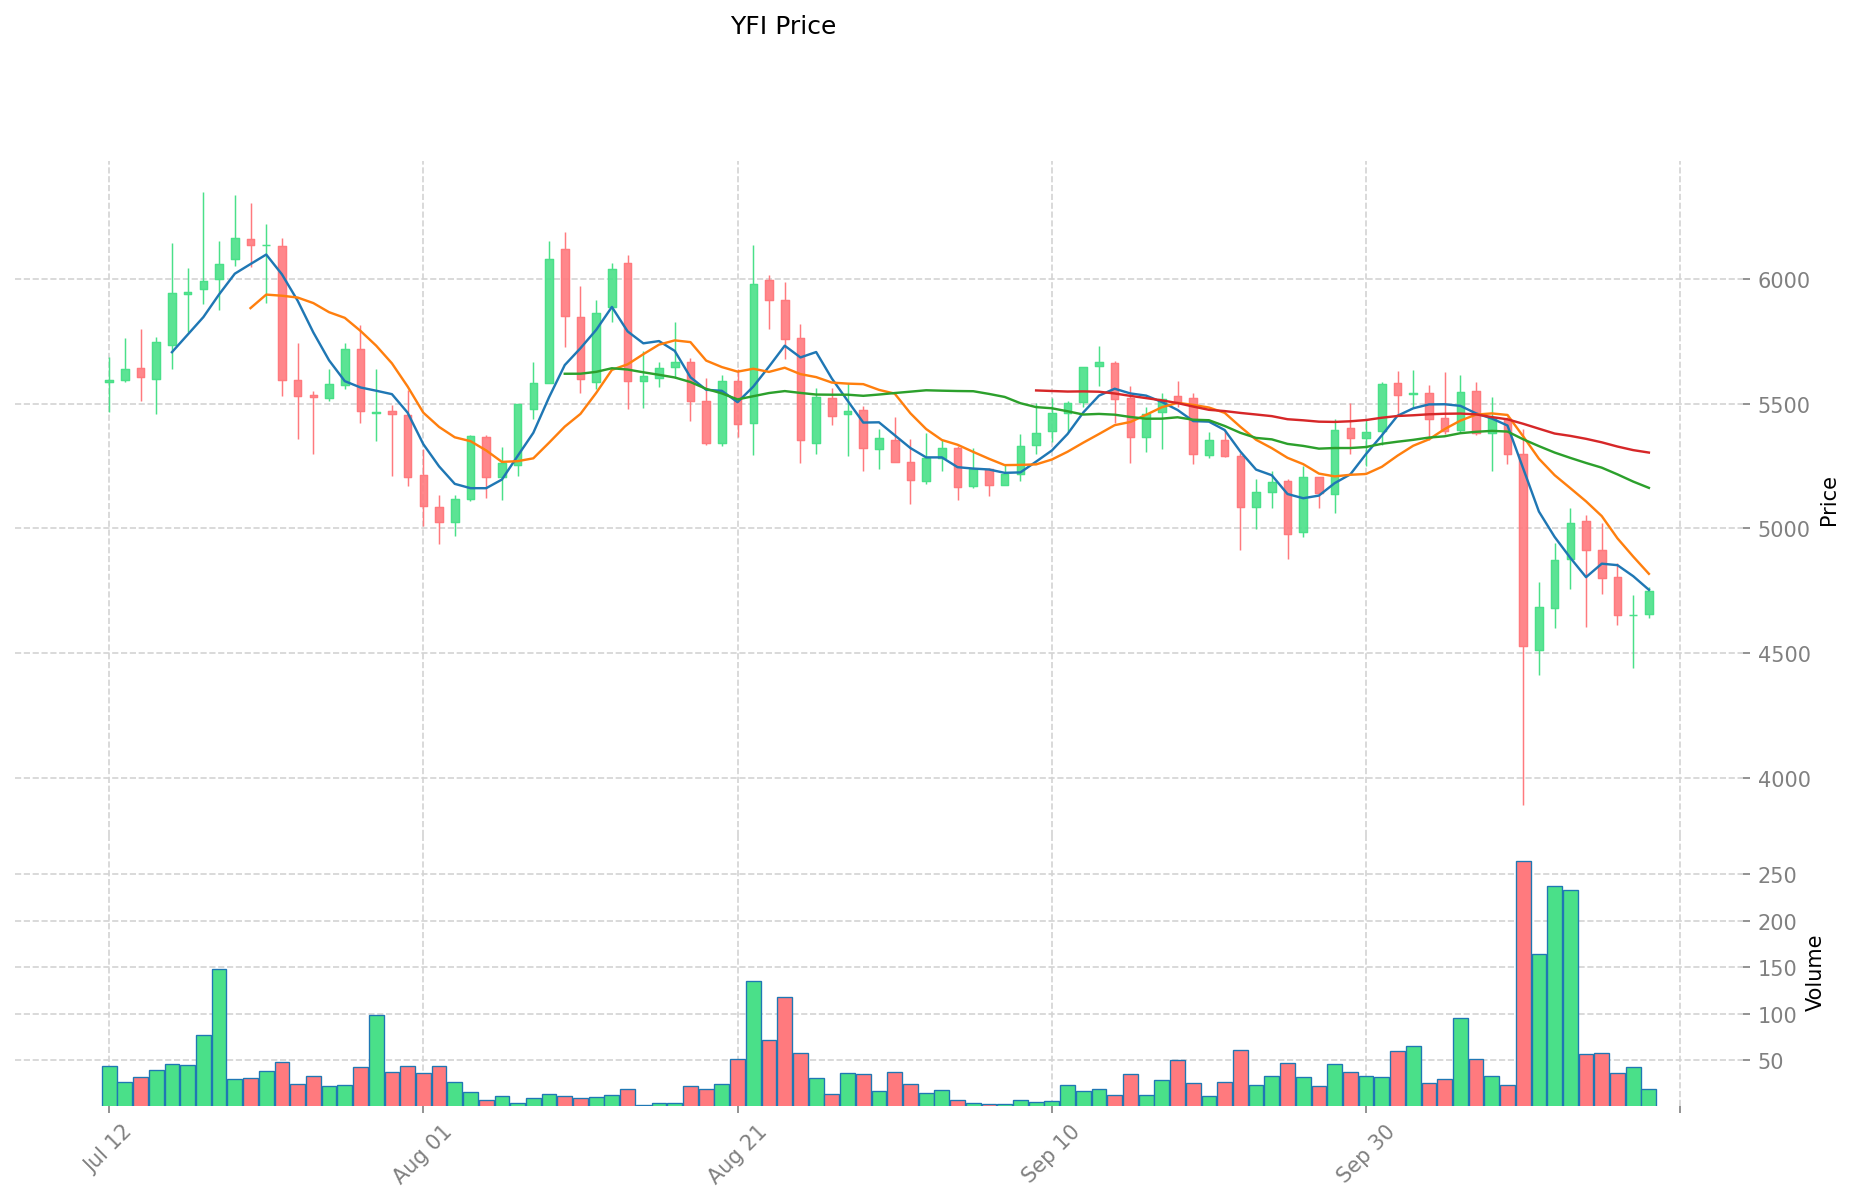
- 2021: YFI, 12 Mayıs 2021’de 90.787 dolar ile tüm zamanların en yüksek seviyesine ulaştı.
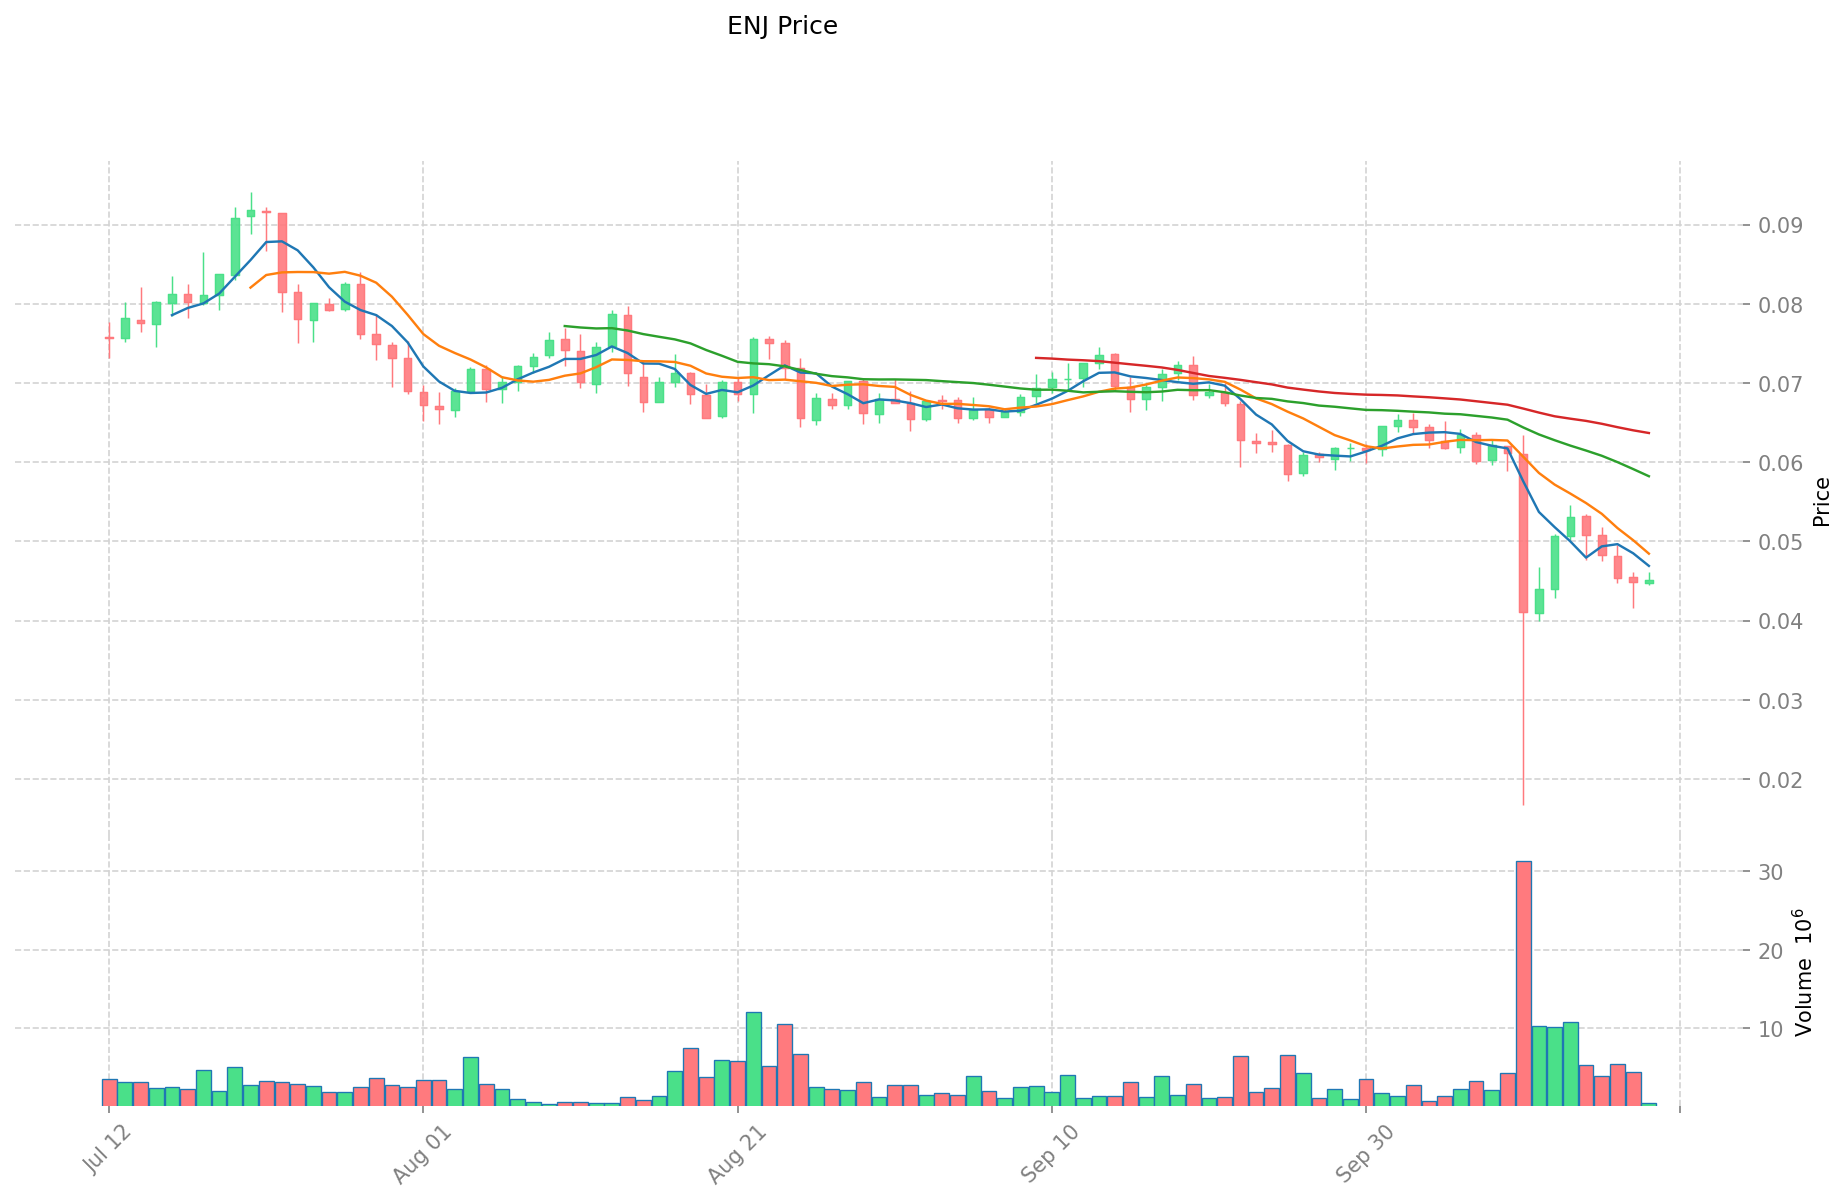
- 2021: ENJ, 25 Kasım 2021’de 4,82 dolar ile zirve yaptı.
- Karşılaştırma: YFI, zirvesinden 90.787 dolardan 4.733 dolara gerilerken; ENJ ise 4,82 dolardan 0,04493 dolara düştü.
Güncel Piyasa Durumu (19 Ekim 2025)
- YFI mevcut fiyatı: 4.733 dolar
- ENJ mevcut fiyatı: 0,04493 dolar
- 24 saatlik işlem hacmi: YFI 91.766,94536 dolar; ENJ 21.106,0028501 dolar
- Piyasa Duyarlılık Endeksi (Korku & Açgözlülük Endeksi): 23 (Aşırı Korku)
Canlı fiyatları görmek için tıklayın:
- YFI güncel fiyatı Piyasa Fiyatı
- ENJ güncel fiyatı Piyasa Fiyatı
II. YFI ile ENJ’nin Yatırım Değerine Etki Eden Temel Unsurlar
Arz Mekanizması Karşılaştırması (Tokenomik)
- YFI: 36.666 adet sabit arz limiti; tüm tokenler önceden üretilmiş
- ENJ: 1 milyar ENJ maksimum arz ve dijital varlıklarda token kilitleme ile deflasyonist mekanizma
- 📌 Geçmişte: YFI’nın sınırlı arzı, yüksek fiyat dalgalanmasına yol açarken; ENJ’nin deflasyonist modeli, varlık üretimiyle dolaşımdan sürekli token çıkışı sağlar.
Kurumsal Benimseme ve Piyasa Uygulamaları
- Kurumsal portföyler: YFI, DeFi yönetim tokeni olarak kurumsal ilgi görürken; ENJ, esas olarak oyun şirketleri ile NFT geliştiricileri tarafından tercih ediliyor
- Kurumsal kullanım: YFI, DeFi protokollerinde getiri optimizasyonu için yönetim tokeni olarak görev yaparken; ENJ, oyun varlıklarının üretimi ve NFT altyapısı için kullanılıyor
- Düzenleyici bakış açısı: Her iki token da farklı ülkelerde regülasyona tabi; oyun odaklı ENJ, DeFi odaklı YFI’ya göre daha az düzenleyici engelle karşılaşabilir
Teknik Gelişim ve Ekosistem Oluşumu
- YFI teknik güncellemeleri: v3 kasalar ile getiri stratejileri ve risk yönetimi iyileştirildi
- ENJ teknik ilerleme: Enjin Beam ile temassız blokzincir deneyimi ve NFT’lere özel Polkadot parachain’i Efinity geliştirildi
- Ekosistem karşılaştırması: YFI, DeFi getiri optimizasyonunda çoklu kasa stratejileriyle güçlü konumunu korurken; ENJ, oyun ve NFT sektörlerinde geliştiricilere blokzincir entegrasyonu sunan araçlarla yer edinmiştir
Makroekonomik Etkiler ve Piyasa Döngüleri
- Enflasyon dönemlerinde performans: YFI, getiri stratejileriyle enflasyona karşı koruma sunabilir
- Makro para politikası: Her iki token da piyasa genelindeki para politikaları ve likiditeye bağlı olarak etkilenir; YFI ve benzeri DeFi tokenleri, likidite şartlarına daha hassastır
- Jeopolitik etkiler: Oyun odaklı ENJ, DeFi regülasyonuna yönelik baskılardan YFI’ya göre daha az etkilenebilir
III. 2025-2030 Fiyat Tahmini: YFI ile ENJ
Kısa Vadeli Tahmin (2025)
- YFI: Muhafazakar 2.601,83 - 4.730,6 | İyimser 4.730,6 - 6.575,534
- ENJ: Muhafazakar 0,0345961 - 0,04493 | İyimser 0,04493 - 0,0507709
Orta Vadeli Tahmin (2027)
- YFI, büyüme dönemine girerek 3.721,69665945 - 8.388,5861213 dolar arası fiyat öngörüleriyle değerlendiriliyor
- ENJ, istikrarlı büyüme ile 0,04260604068 - 0,05224312131 dolar arası bir fiyat aralığına sahip olabilir
- Başlıca etkenler: Kurumsal sermaye girişi, ETF gelişmeleri, ekosistem büyümesi
Uzun Vadeli Tahmin (2030)
- YFI: Temel senaryo 5.166,2175695892762 - 9.935,033787671685 | İyimser senaryo 9.935,033787671685 - 11.623,98953157587145
- ENJ: Temel senaryo 0,037808600499432 - 0,059075938280362 | İyimser senaryo 0,059075938280362 - 0,064983532108398
Feragatname
YFI:
| Yıl | Tahmini En Yüksek | Tahmini Ortalama | Tahmini En Düşük | Değişim Oranı |
|---|---|---|---|---|
| 2025 | 6.575,534 | 4.730,6 | 2.601,83 | 0 |
| 2026 | 6.161,84303 | 5.653,067 | 4.126,73891 | 19 |
| 2027 | 8.388,5861213 | 5.907,455015 | 3.721,69665945 | 24 |
| 2028 | 10.436,110029499 | 7.148,02056815 | 3.931,4113124825 | 51 |
| 2029 | 11.078,00227651887 | 8.792,0652988245 | 4.923,55656734172 | 85 |
| 2030 | 11.623,98953157587145 | 9.935,033787671685 | 5.166,2175695892762 | 109 |
ENJ:
| Yıl | Tahmini En Yüksek | Tahmini Ortalama | Tahmini En Düşük | Değişim Oranı |
|---|---|---|---|---|
| 2025 | 0,0507709 | 0,04493 | 0,0345961 | 0 |
| 2026 | 0,053592504 | 0,04785045 | 0,025839243 | 6 |
| 2027 | 0,05224312131 | 0,050721477 | 0,04260604068 | 12 |
| 2028 | 0,0535415911212 | 0,051482299155 | 0,0422154853071 | 14 |
| 2029 | 0,065639931422625 | 0,0525119451381 | 0,030982047631479 | 16 |
| 2030 | 0,064983532108398 | 0,059075938280362 | 0,037808600499432 | 31 |
IV. Yatırım Stratejisi Karşılaştırması: YFI ile ENJ
Uzun Vadeli ve Kısa Vadeli Yatırım Stratejisi
- YFI: DeFi getiri optimizasyonu ve yönetim potansiyeline odaklanan yatırımcılar için ideal
- ENJ: Oyun ve NFT ekosisteminin büyümesine odaklanan yatırımcılar için uygun
Risk Yönetimi ve Varlık Dağılımı
- Temkinli yatırımcılar için: YFI %30, ENJ %70
- Agresif yatırımcılar için: YFI %60, ENJ %40
- Korumalı portföy araçları: Stablecoin tahsisi, opsiyonlar, çapraz para portföyleri
V. Olası Risk Karşılaştırması
Piyasa Riski
- YFI: Sınırlı arz ve DeFi piyasasının dalgalanması nedeniyle yüksek volatilite
- ENJ: Oyun sektörü trendleri ve NFT piyasası duyarlılığına bağlı risk
Teknik Risk
- YFI: Akıllı kontrat açıkları, ölçeklenebilirlik kısıtları
- ENJ: Ağ tıkanıklığı, birlikte çalışabilirlik sorunları
Düzenleyici Risk
- Küresel regülasyonlar, DeFi odaklı YFI üzerinde daha etkili olabilirken; ENJ, oyun ve NFT alanında daha az denetime tabidir
VI. Sonuç: Hangisi Daha Avantajlı Alım?
📌 Yatırım Değeri Özeti:
- YFI avantajları: DeFi getiri optimizasyonunda güçlü, sınırlı arz, yüksek getiri potansiyeli
- ENJ avantajları: Oyun ve NFT sektörlerinde yerleşik, deflasyonist tokenomik, daha geniş benimsenme potansiyeli
✅ Yatırım Tavsiyesi:
- Yeni yatırımcılar: Oyun sektöründe daha belirgin kullanım nedeniyle ENJ ağırlıklı dengeli bir portföy tercih edilebilir
- Tecrübeli yatırımcılar: DeFi büyüme potansiyeli için YFI’ya yüksek ağırlık, ENJ ile çeşitlendirme sağlanabilir
- Kurumsal yatırımcılar: Hem YFI ile DeFi’ye hem de ENJ ile oyun/NFT sektörüne stratejik portföy oluşturulmalı
⚠️ Risk Uyarısı: Kripto para piyasası son derece oynaktır, bu makale yatırım tavsiyesi içermez. None
VII. Sıkça Sorulan Sorular
S1: YFI ile ENJ arasındaki temel fark nedir? C: YFI, 36.666 tokenlik sınırlı arz ile DeFi getiri optimizasyonuna odaklanır; ENJ ise 1 milyar maksimum arz ve deflasyonist mekanizma ile oyun ve NFT alanına yöneliktir.
S2: Geçmişte hangi token daha iyi fiyat performansı sergiledi? C: YFI, Mayıs 2021’de 90.787 dolar ile daha yüksek bir zirveye ulaştı; ENJ ise Kasım 2021’de 4,82 dolara çıktı. Her ikisi de zirveden bu yana ciddi düşüşler yaşadı.
S3: YFI ile ENJ’nin arz mekanizmaları nasıl ayrışıyor? C: YFI’nın sabit 36.666 token arzı mevcut ve tüm tokenler basıldı. ENJ; 1 milyar maksimum arz ve dijital varlıklarda token kilitleme ile deflasyonist mekanizmaya sahip.
S4: YFI ile ENJ’nin yatırım değerine etki eden başlıca faktörler neler? C: Arz mekanizmaları, kurumsal benimseme, teknik gelişim, ekosistem oluşturma, enflasyon ve para politikası gibi makroekonomik etkenler öne çıkıyor.
S5: 2030’a kadar YFI ve ENJ için uzun vadeli fiyat tahminleri nedir? C: YFI için temel senaryo 5.166,22 - 9.935,03 dolar, iyimser senaryo 9.935,03 - 11.623,99 dolar; ENJ için temel senaryo 0,038 - 0,059 dolar, iyimser senaryo 0,059 - 0,065 dolardır.
S6: YFI ile ENJ için yatırım stratejileri nasıl ayrışıyor? C: YFI, DeFi getiri ve yönetim odaklı yatırımcılar için; ENJ ise oyun ve NFT ekosistemine ilgi duyan yatırımcılar için uygundur. Temkinli yatırımcılar YFI’ya %30, ENJ’ye %70; agresif yatırımcılar YFI’ya %60, ENJ’ye %40 ağırlık verebilir.
S7: YFI ile ENJ’ye yatırımda başlıca riskler nelerdir? C: YFI, sınırlı arz ve DeFi dalgalanmalarıyla yüksek volatiliteye sahip; ENJ ise oyun sektörü ve NFT piyasası trendlerine duyarlı. Her iki token, akıllı kontrat riskleri ve düzenleyici baskılarla karşı karşıya; YFI, DeFi odağı nedeniyle daha fazla regülasyon riski taşır.
Share
Content
Giriş: YFI ile ENJ Yatırımı Karşılaştırması
I. Fiyat Geçmişi ve Güncel Piyasa Durumu Karşılaştırması
II. YFI ile ENJ’nin Yatırım Değerine Etki Eden Temel Unsurlar
III. 2025-2030 Fiyat Tahmini: YFI ile ENJ
IV. Yatırım Stratejisi Karşılaştırması: YFI ile ENJ
V. Olası Risk Karşılaştırması
VI. Sonuç: Hangisi Daha Avantajlı Alım?
VII. Sıkça Sorulan Sorular
How to Buy Cryptocurrency


Trending Cryptocurrencies


HIFI vs ENJ: NFT Ekosisteminde Önde Gelen İki Dijital Varlık Platformunun Karşılaştırılması
Aavegotchi (GHST) Yatırım İçin Uygun mu?: NFT Oyun Tokeni Pazarında Potansiyel Büyüme ve Risklerin Değerlendirilmesi

LISTA ve FLOW: Seyrek Sinyal Kurtarımı İçin İki Yinelemeli Optimizasyon Algoritmasının Karşılaştırılması

GAME2 ve DYDX: Merkeziyetsiz Türev Piyasalarda Liderlik Yarışı
2025 SUPER Fiyat Tahmini: Dijital Varlık Ekosisteminde Piyasa Trendleri ve Yatırım Potansiyelinin Analizi
Dego Finance (DEGO) Yatırıma Değer mi?: NFT Oyun Ekosisteminde Olası Getiri ve Risklerin Değerlendirilmesi
Kripto paralarda arz kavramının ne olduğunu anlamak
Merkeziyetsiz Blockchain Teknolojisinin Temel İlkelerini Anlamak
Ethereum'da Gas Ücretleri: Ayrıntılı Bir Rehber
Bored Ape NFT Koleksiyonu Üzerine İnceleme: Detaylı Bir Kılavuz
Simüle Edilmiş Kripto Para Ticareti: Yeni Başlayanlar için Kapsamlı Rehber