XR vs ZIL: Exploring the Future of Immersive Technologies in Enterprise Solutions
Introduction: Investment Comparison of XR vs ZIL
In the cryptocurrency market, the comparison between XRADERS vs Zilliqa has been an unavoidable topic for investors. The two not only show significant differences in market cap ranking, application scenarios, and price performance, but also represent different positioning in crypto assets.
XRADERS (XR): Since its launch, it has gained market recognition for its decentralized expert curation platform designed to empower investors.
Zilliqa (ZIL): Since 2018, it has been hailed as a high-throughput public blockchain platform, aiming to solve transaction speed and scalability issues.
This article will comprehensively analyze the investment value comparison between XRADERS and Zilliqa, focusing on historical price trends, supply mechanisms, institutional adoption, technological ecosystems, and future predictions, attempting to answer the question investors are most concerned about:
"Which is the better buy right now?"
I. Price History Comparison and Current Market Status
XRADERS (XR) and Zilliqa (ZIL) Historical Price Trends
- 2024: XR launched at $0.35, reaching an all-time high of $0.8758 in November.
- 2025: ZIL experienced significant volatility, dropping from its all-time high of $0.255376 in 2021.
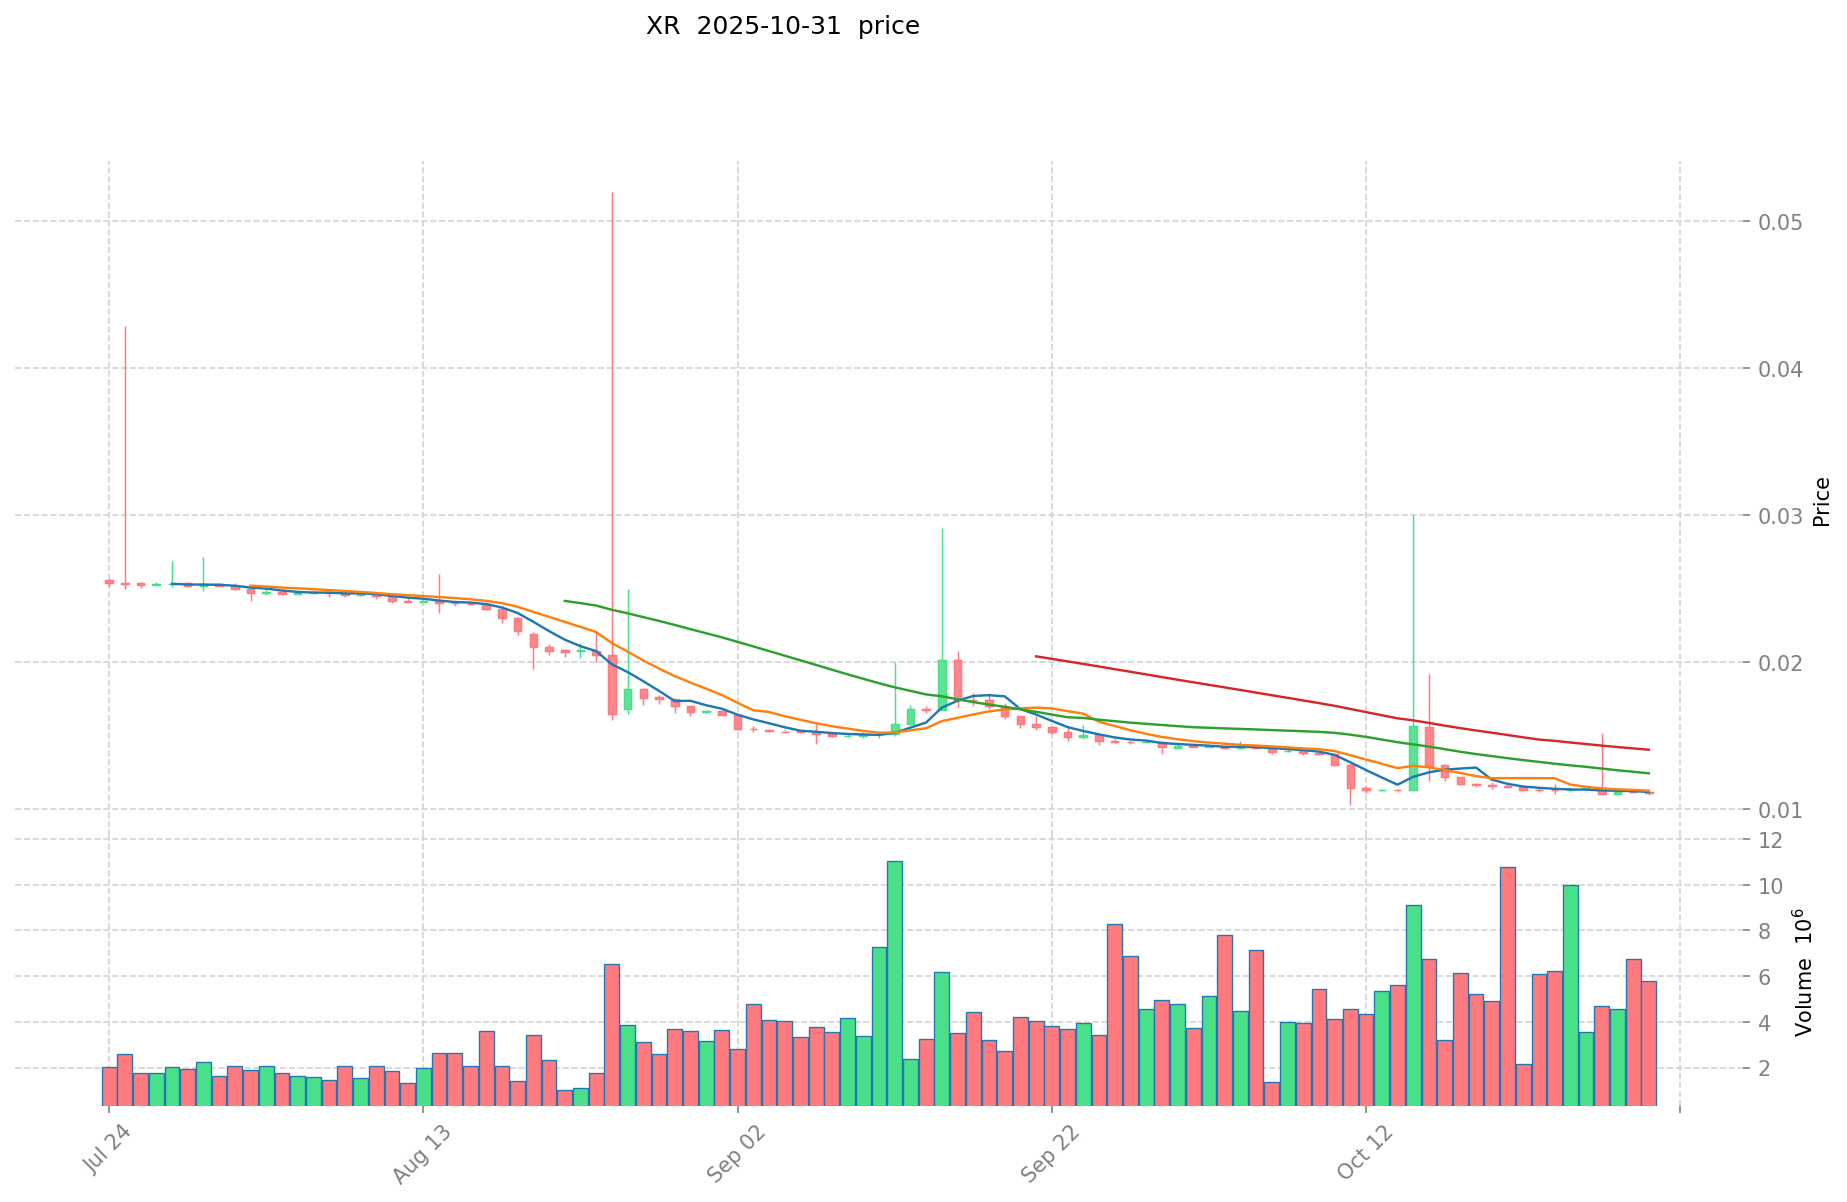
- Comparative analysis: In the current market cycle, XR has fallen from its high of $0.8758 to a low of $0.01023, while ZIL has declined from $0.255376 to around $0.007359.
Current Market Situation (2025-11-01)
- XR current price: $0.01105
- ZIL current price: $0.007359
- 24-hour trading volume: XR $58,284.74 vs ZIL $151,663.89
- Market Sentiment Index (Fear & Greed Index): 29 (Fear)
Click to view real-time prices:
- Check XR current price Market Price
- Check ZIL current price Market Price

Analysis of Core Factors Affecting XR Investment Value
I. Market and Growth Prospects for XR Technology
Current Market Status
- XR market shows rapid growth trajectory with strong mid-term growth potential
- Industry experiencing second wave of development with major tech companies introducing spatial computing products
- Market expansion driven by post-pandemic recovery in both online and offline segments
Key Growth Drivers
- Technical innovation: Continuous advancements in optical modules, sensors, and display technologies
- Increasing market demand across various industries
- Corporate profit potential from expanding customer base, particularly overseas
Application Ecosystem
- Consumer applications: Gaming, tourism, education, retail
- Enterprise applications: Remote collaboration, training, medical applications
- Industrial applications: Warehouse automation, supply chain optimization, manufacturing
II. Core Factors Affecting XR Investment Value
Technology Innovation and Maturity
- Optical component evolution: Moving toward variable focus, in-mold injection, and advanced technology integration
- Hardware miniaturization: Pursuit of smaller form factors with larger fields of view
- Processing capabilities: Development of specialized spatial computing chips and algorithms
- Technical barriers: Complex integration of sensors, optics, and computing systems
Industrial Chain Development
- Upstream: Data acquisition technologies (structural light sensors, time-of-flight sensors)
- Midstream: Data processing (spatial computing chips, algorithms) and display technologies
- Downstream: Interactive terminals, operating systems, development tools, and content applications
- Key players: International companies (Microsoft, Meta, Magic Leap, Google, Apple) leading with domestic companies emerging
Spatial Computing Integration
- Bridging physical and digital worlds through environmental awareness technologies
- Real-time 3D graphics processing and spatial positioning advancements
- Virtual-physical integration creating immersive, interactive experiences
- Connection to metaverse development as foundational technology
Economic and Production Efficiency
- Potential to enhance material civilization development efficiency
- Enriching spaces for spiritual and cultural development
- Focus on improving real-world production efficiency through digital augmentation
- Cost reduction through digital transformation of physical interactions
III. Investment Considerations and Outlook
Market Positioning
- Consumer vs. enterprise market potential
- Regional market differences (tier 1-4 cities have varying competitive landscapes)
- International vs. domestic market strategies
Company-Specific Factors
- Profit release potential through 2025-2026
- Market share growth with overseas clients
- Strategic positioning within the XR/spatial computing value chain
- Integration with other emerging technologies (AI, IoT)
Risk Factors
- Technology adoption barriers
- Competitive landscape challenges
- Regulatory uncertainties
- Capital requirements for sustained R&D
"Spatial computing is a new computing paradigm that utilizes the unique properties of space to guide the calculation process, based on three-dimensional principles, with a people-oriented approach, connecting and integrating the virtual world and the real world." - Research Report, April 2024
III. Price Prediction for 2025-2030: XR vs ZIL
Short-term Prediction (2025)
- XR: Conservative $0.0082875 - $0.01105 | Optimistic $0.01105 - $0.014365
- ZIL: Conservative $0.006438 - $0.0074 | Optimistic $0.0074 - $0.009102
Mid-term Prediction (2027)
- XR may enter a growth phase, with an estimated price range of $0.01170741975 - $0.021516339
- ZIL may enter a steady growth phase, with an estimated price range of $0.00790982115 - $0.0125324439
- Key drivers: Institutional capital inflow, ETF, ecosystem development
Long-term Prediction (2030)
- XR: Base scenario $0.025663708267275 - $0.037212376987548 | Optimistic scenario $0.037212376987548+
- ZIL: Base scenario $0.01760313233691 - $0.019715508217339 | Optimistic scenario $0.019715508217339+
Disclaimer: This analysis is based on historical data and market projections. Cryptocurrency markets are highly volatile and unpredictable. This information should not be considered as financial advice. Always conduct your own research before making investment decisions.
XR:
| 年份 | 预测最高价 | 预测平均价格 | 预测最低价 | 涨跌幅 |
|---|---|---|---|---|
| 2025 | 0.014365 | 0.01105 | 0.0082875 | 0 |
| 2026 | 0.018934175 | 0.0127075 | 0.0066079 | 15 |
| 2027 | 0.021516339 | 0.0158208375 | 0.01170741975 | 43 |
| 2028 | 0.02538928002 | 0.01866858825 | 0.0177351588375 | 68 |
| 2029 | 0.02929848239955 | 0.022028934135 | 0.01564054323585 | 99 |
| 2030 | 0.037212376987548 | 0.025663708267275 | 0.018221232869765 | 132 |
ZIL:
| 年份 | 预测最高价 | 预测平均价格 | 预测最低价 | 涨跌幅 |
|---|---|---|---|---|
| 2025 | 0.009102 | 0.0074 | 0.006438 | 0 |
| 2026 | 0.01229399 | 0.008251 | 0.00734339 | 12 |
| 2027 | 0.0125324439 | 0.010272495 | 0.00790982115 | 39 |
| 2028 | 0.0169896794805 | 0.01140246945 | 0.007981728615 | 54 |
| 2029 | 0.02101019020857 | 0.01419607446525 | 0.012208624040115 | 92 |
| 2030 | 0.019715508217339 | 0.01760313233691 | 0.012498223959206 | 139 |
IV. Investment Strategy Comparison: XR vs ZIL
Long-term vs Short-term Investment Strategy
- XR: Suitable for investors focused on emerging technologies and potential ecosystem growth
- ZIL: Suitable for investors seeking established blockchain infrastructure with scalability features
Risk Management and Asset Allocation
- Conservative investors: XR: 20% vs ZIL: 80%
- Aggressive investors: XR: 60% vs ZIL: 40%
- Hedging tools: Stablecoin allocation, options, cross-currency portfolio
V. Potential Risk Comparison
Market Risk
- XR: Higher volatility due to newer market entry and smaller market cap
- ZIL: Established market presence but subject to overall crypto market trends
Technical Risk
- XR: Scalability, network stability
- ZIL: Hash power concentration, potential security vulnerabilities
Regulatory Risk
- Global regulatory policies may have differing impacts on both assets
VI. Conclusion: Which Is the Better Buy?
📌 Investment Value Summary:
- XR advantages: Emerging technology focus, potential for rapid growth in XR/spatial computing sector
- ZIL advantages: Established blockchain platform, focus on scalability and high throughput
✅ Investment Advice:
- New investors: Consider a balanced approach with a slight preference towards ZIL for its established presence
- Experienced investors: Explore a higher allocation to XR for potential growth, while maintaining ZIL for stability
- Institutional investors: Evaluate XR for long-term potential in spatial computing, while utilizing ZIL for blockchain infrastructure exposure
⚠️ Risk Warning: The cryptocurrency market is highly volatile. This article does not constitute investment advice. None
VII. FAQ
Q1: What are the main differences between XRADERS (XR) and Zilliqa (ZIL)? A: XRADERS (XR) is a newer project focused on decentralized expert curation for investors, while Zilliqa (ZIL) is an established high-throughput public blockchain platform. XR targets the emerging XR/spatial computing sector, while ZIL focuses on scalability and transaction speed in blockchain infrastructure.
Q2: How do the current prices and market caps of XR and ZIL compare? A: As of November 1, 2025, XR's price is $0.01105, while ZIL's price is $0.007359. XR has a smaller market cap and higher volatility, while ZIL has a more established presence in the market.
Q3: What are the long-term price predictions for XR and ZIL? A: By 2030, XR's base scenario price range is predicted to be $0.025663708267275 - $0.037212376987548, with an optimistic scenario above $0.037212376987548. ZIL's base scenario range is $0.01760313233691 - $0.019715508217339, with an optimistic scenario above $0.019715508217339.
Q4: Which asset is considered better for short-term vs. long-term investment? A: XR may be more suitable for investors focused on emerging technologies and potential ecosystem growth, making it a potentially better long-term investment. ZIL, with its established presence, may be more suitable for short to medium-term investments or for those seeking exposure to blockchain infrastructure.
Q5: How should investors allocate their portfolio between XR and ZIL? A: Conservative investors might consider allocating 20% to XR and 80% to ZIL, while aggressive investors might opt for 60% XR and 40% ZIL. The exact allocation should be based on individual risk tolerance and investment goals.
Q6: What are the main risks associated with investing in XR and ZIL? A: XR faces higher volatility and market risks due to its newer status and smaller market cap. ZIL, while more established, is subject to overall crypto market trends. Both face technical risks related to scalability and security, as well as potential regulatory risks from global policies.
Q7: Are there any upcoming developments that could impact the value of XR or ZIL? A: For XR, advancements in spatial computing technology and integration with metaverse development could significantly impact its value. For ZIL, improvements in blockchain scalability and potential enterprise adoption could be key factors affecting its future value.
Share
Content
Introduction: Investment Comparison of XR vs ZIL
I. Price History Comparison and Current Market Status
I. Market and Growth Prospects for XR Technology
II. Core Factors Affecting XR Investment Value
III. Investment Considerations and Outlook
III. Price Prediction for 2025-2030: XR vs ZIL
IV. Investment Strategy Comparison: XR vs ZIL
V. Potential Risk Comparison
VI. Conclusion: Which Is the Better Buy?
VII. FAQ

