XCV vs TRX: Which Cryptocurrency Offers Better Long-Term Growth Potential?
Introduction: XCV vs TRX Investment Comparison
In the cryptocurrency market, the comparison between XCV and TRX has always been a topic that investors cannot avoid. The two not only have significant differences in market cap ranking, application scenarios, and price performance, but also represent different positions in crypto assets.
XCarnival (XCV): Since its launch, it has gained market recognition for its focus on mortgage lending for metaverse assets.
TRON (TRX): Since its inception in 2017, it has been hailed as a decentralized platform for content sharing and entertainment, becoming one of the largest public blockchains collaborating with a sovereign state for blockchain infrastructure development.
This article will comprehensively analyze the investment value comparison between XCV and TRX, focusing on historical price trends, supply mechanisms, institutional adoption, technical ecosystems, and future predictions, attempting to answer the question that investors are most concerned about:
"Which is the better buy right now?"
I. Price History Comparison and Current Market Status
XCV and TRX Historical Price Trends
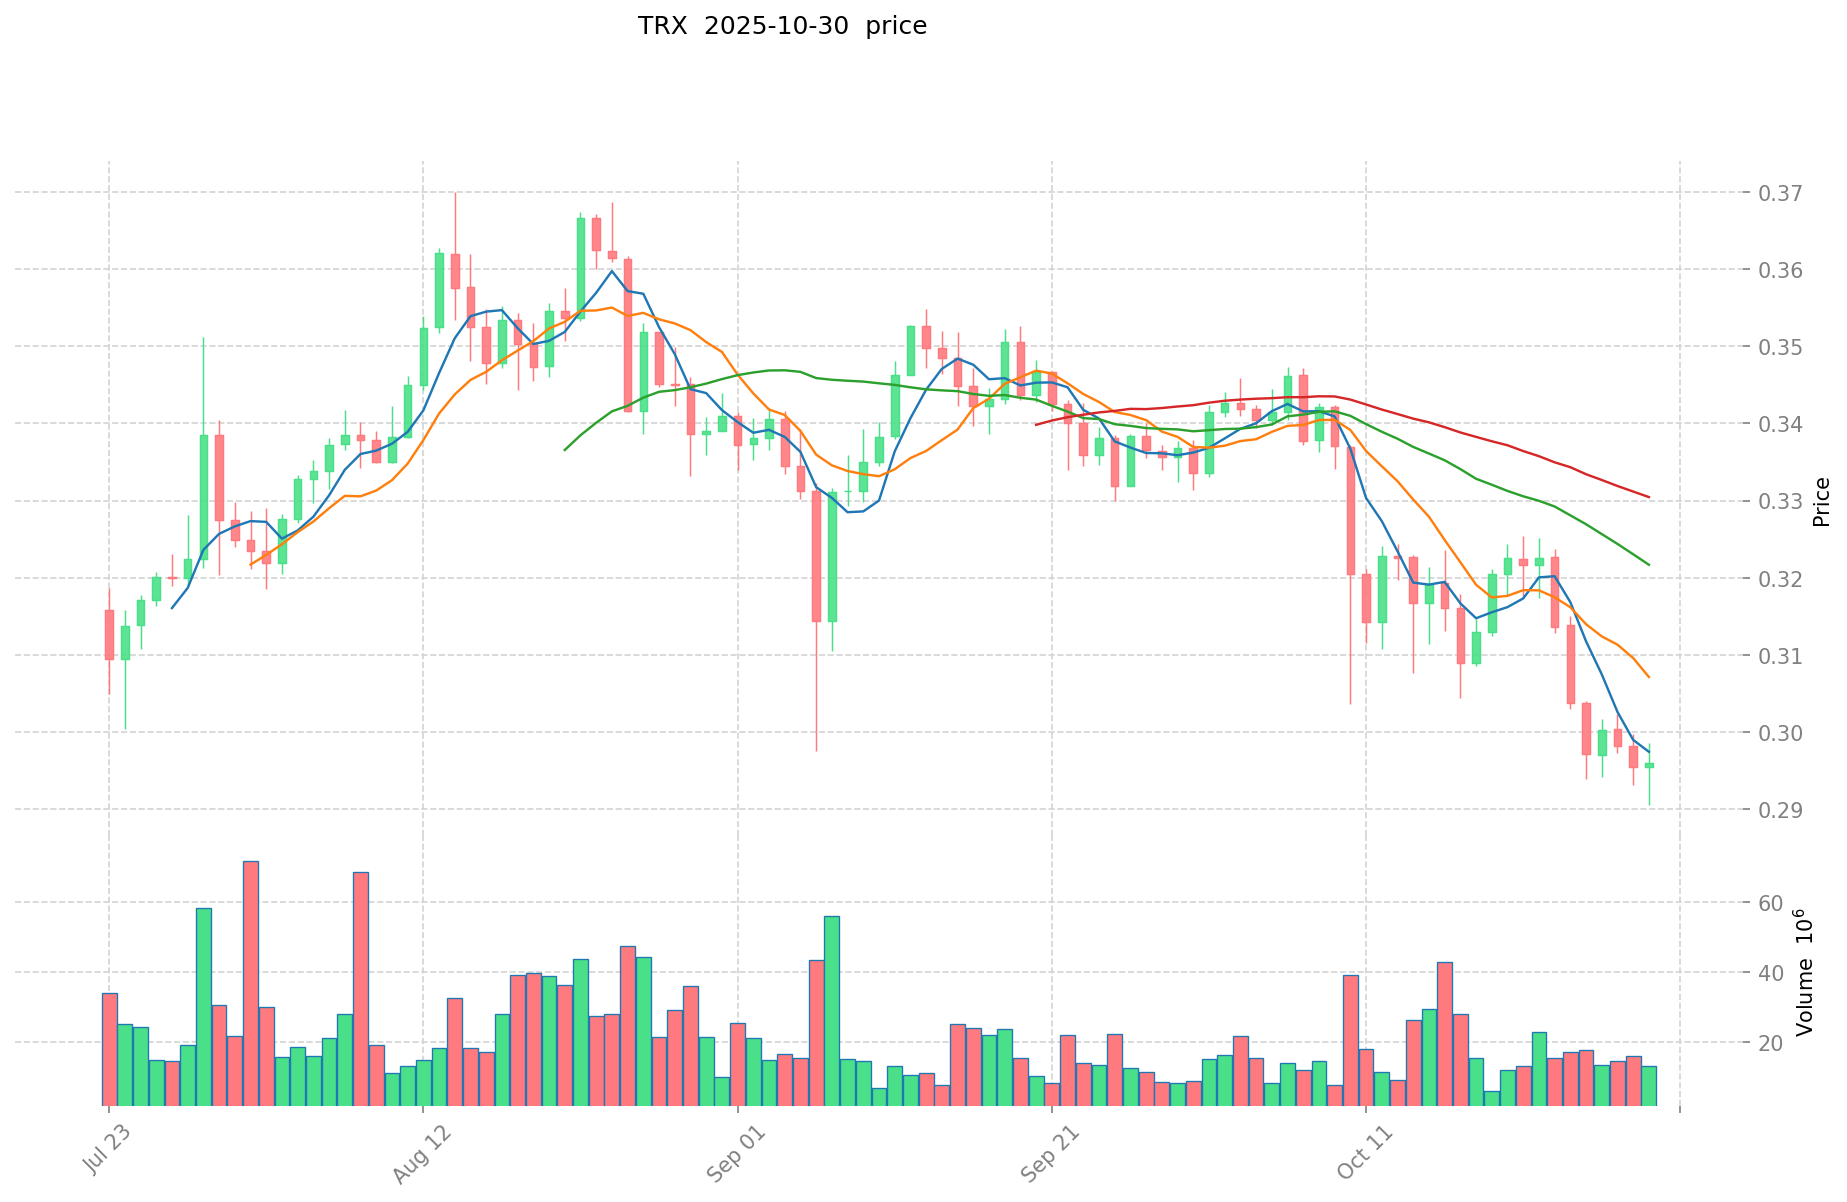
- 2024: TRX reached an all-time high of $0.44948 due to increased adoption and network expansion.
- 2017: TRX hit its all-time low of $0.00126 shortly after its initial coin offering.
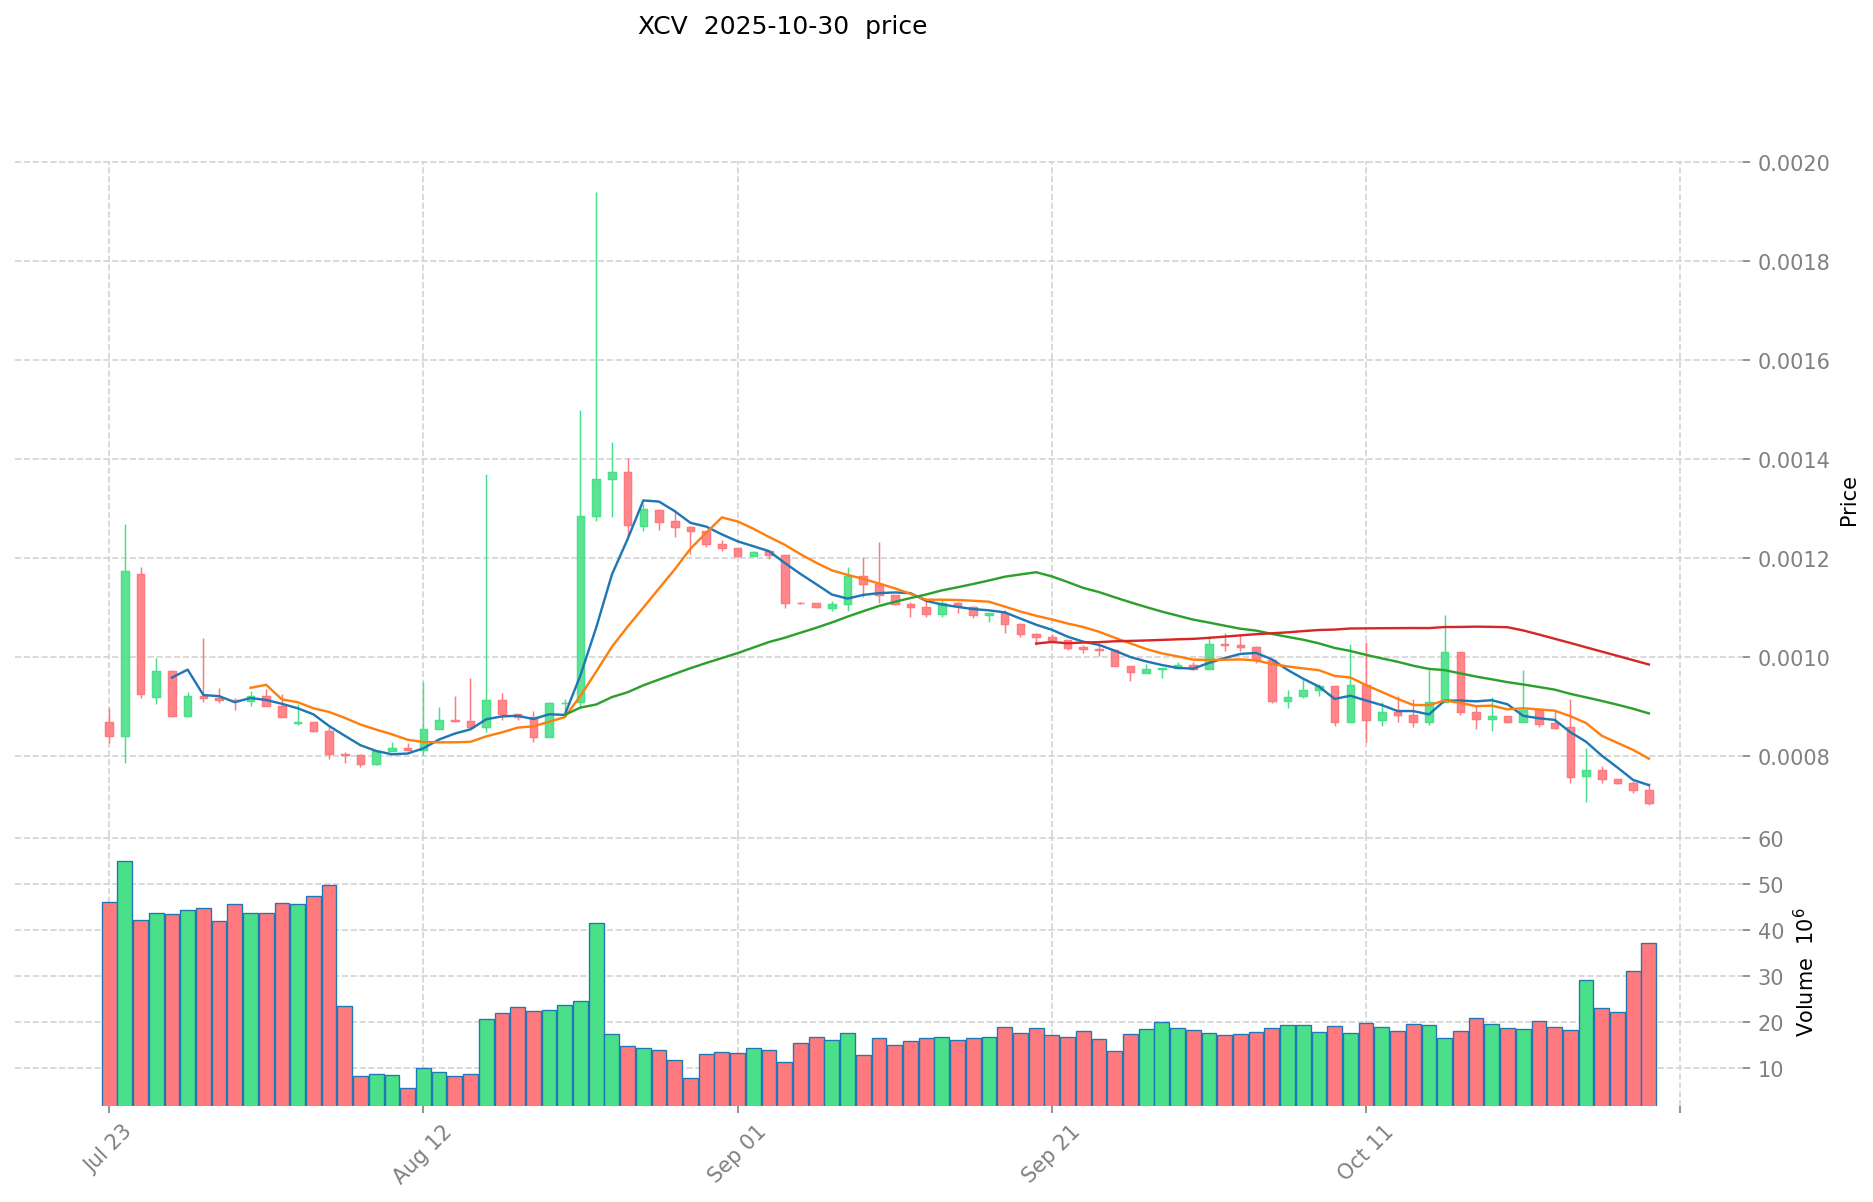
- Comparative analysis: During the recent market cycle, XCV dropped from its all-time high of $1.95 to a low of $0.00026481, while TRX has shown more stability, maintaining a price above $0.29 in recent times.
Current Market Situation (2025-10-30)
- XCV current price: $0.0007065
- TRX current price: $0.297
- 24-hour trading volume: XCV $24,271.79 vs TRX $6,021,495.93
- Market Sentiment Index (Fear & Greed Index): 34 (Fear)
Click to view real-time prices:
- Check XCV current price Market Price
- Check TRX current price Market Price
Core Investment Value Factors of XCV vs TRX
Supply Mechanism Comparison (Tokenomics)
- Investment value in cryptocurrencies like XCV and TRX depends on market trends and project development
- Pricing reflects broader cryptocurrency market dynamics and volatility
- 📌 Historical pattern: Supply mechanisms can drive price cycle changes in volatile markets
Institutional Adoption and Market Applications
- Investment decisions require thorough research on both assets
- Community support plays a significant role in determining long-term value
- Market applications contribute to overall utility and adoption rates
Technical Development and Ecosystem Building
- Project development trajectory influences investment potential
- Ecosystem growth impacts long-term sustainability
- Current market volatility should be considered when evaluating technical progress
Macroeconomic Factors and Market Cycles
- Cryptocurrency investments are subject to broader market cycles
- Current prices reflect overall market conditions
- Investment approaches should consider risk tolerance and portfolio diversification
III. 2025-2030 Price Prediction: XCV vs TRX
Short-term Prediction (2025)
- XCV: Conservative $0.000489693 - $0.0007097 | Optimistic $0.0007097 - $0.000837446
- TRX: Conservative $0.1514445 - $0.29695 | Optimistic $0.29695 - $0.338523
Mid-term Prediction (2027)
- XCV may enter a growth phase, with projected prices of $0.0004688625953 - $0.000970060542
- TRX may enter a bullish market, with projected prices of $0.3256163652 - $0.4612898507
- Key drivers: Institutional capital inflow, ETF, ecosystem development
Long-term Prediction (2030)
- XCV: Base scenario $0.000610068649712 - $0.001109215726749 | Optimistic scenario $0.001109215726749 - $0.001297782400297
- TRX: Base scenario $0.366560058895024 - $0.621288235415295 | Optimistic scenario $0.621288235415295 - $0.683417058956824
Disclaimer: The above predictions are based on historical data and market analysis. Cryptocurrency markets are highly volatile and subject to rapid changes. These projections should not be considered as financial advice. Always conduct your own research before making investment decisions.
XCV:
| 年份 | 预测最高价 | 预测平均价格 | 预测最低价 | 涨跌幅 |
|---|---|---|---|---|
| 2025 | 0.000837446 | 0.0007097 | 0.000489693 | 0 |
| 2026 | 0.00084319457 | 0.000773573 | 0.00048735099 | 9 |
| 2027 | 0.000970060542 | 0.000808383785 | 0.0004688625953 | 14 |
| 2028 | 0.00103149770966 | 0.0008892221635 | 0.00074694661734 | 25 |
| 2029 | 0.001258071516919 | 0.00096035993658 | 0.000624233958777 | 35 |
| 2030 | 0.001297782400297 | 0.001109215726749 | 0.000610068649712 | 57 |
TRX:
| 年份 | 预测最高价 | 预测平均价格 | 预测最低价 | 涨跌幅 |
|---|---|---|---|---|
| 2025 | 0.338523 | 0.29695 | 0.1514445 | 0 |
| 2026 | 0.45754056 | 0.3177365 | 0.219238185 | 6 |
| 2027 | 0.4612898507 | 0.38763853 | 0.3256163652 | 30 |
| 2028 | 0.619717717911 | 0.42446419035 | 0.220721378982 | 42 |
| 2029 | 0.72048551670009 | 0.5220909541305 | 0.495986406423975 | 75 |
| 2030 | 0.683417058956824 | 0.621288235415295 | 0.366560058895024 | 109 |
IV. Investment Strategy Comparison: XCV vs TRX
Long-term vs Short-term Investment Strategies
- XCV: Suitable for investors focused on metaverse assets and lending potential
- TRX: Suitable for investors seeking established blockchain infrastructure and content sharing platforms
Risk Management and Asset Allocation
- Conservative investors: XCV: 10% vs TRX: 90%
- Aggressive investors: XCV: 30% vs TRX: 70%
- Hedging tools: Stablecoin allocation, options, cross-currency portfolios
V. Potential Risk Comparison
Market Risk
- XCV: Higher volatility and lower liquidity
- TRX: Susceptible to broader cryptocurrency market trends
Technical Risk
- XCV: Scalability, network stability
- TRX: Computing power concentration, potential security vulnerabilities
Regulatory Risk
- Global regulatory policies may impact both differently, with TRX potentially facing more scrutiny due to its larger market presence
VI. Conclusion: Which Is the Better Buy?
📌 Investment Value Summary:
- XCV advantages: Focus on metaverse assets, potential for growth in niche market
- TRX advantages: Established ecosystem, collaboration with sovereign state, higher stability
✅ Investment Advice:
- New investors: Consider TRX for its established presence and relative stability
- Experienced investors: Diversify between XCV and TRX based on risk tolerance
- Institutional investors: Evaluate TRX for its ecosystem and XCV for potential growth opportunities
⚠️ Risk Warning: The cryptocurrency market is highly volatile. This article does not constitute investment advice. None
VII. FAQ
Q1: What are the main differences between XCV and TRX? A: XCV focuses on mortgage lending for metaverse assets, while TRX is a decentralized platform for content sharing and entertainment. TRX has a larger market cap, higher trading volume, and more established ecosystem compared to XCV.
Q2: Which cryptocurrency has shown better price stability? A: TRX has shown more price stability compared to XCV. While XCV dropped from its all-time high of $1.95 to a low of $0.00026481, TRX has maintained a price above $0.29 in recent times.
Q3: How do the current prices of XCV and TRX compare? A: As of 2025-10-30, XCV's current price is $0.0007065, while TRX's current price is $0.297. TRX is trading at a significantly higher price than XCV.
Q4: What are the long-term price predictions for XCV and TRX? A: By 2030, XCV is predicted to reach between $0.000610068649712 and $0.001297782400297, while TRX is projected to be between $0.366560058895024 and $0.683417058956824 in the optimistic scenario.
Q5: How should investors allocate their portfolio between XCV and TRX? A: Conservative investors might consider allocating 10% to XCV and 90% to TRX, while aggressive investors might opt for 30% XCV and 70% TRX. The exact allocation depends on individual risk tolerance and investment goals.
Q6: What are the main risks associated with investing in XCV and TRX? A: XCV faces higher volatility and lower liquidity risks, while TRX is more susceptible to broader cryptocurrency market trends. Both face technical risks such as scalability and network stability, as well as potential regulatory risks.
Q7: Which cryptocurrency might be more suitable for new investors? A: TRX might be more suitable for new investors due to its established presence, relative stability, and larger ecosystem. However, all cryptocurrency investments carry risks, and new investors should conduct thorough research before making any investment decisions.
Share
Content
Introduction: XCV vs TRX Investment Comparison
I. Price History Comparison and Current Market Status
Core Investment Value Factors of XCV vs TRX
III. 2025-2030 Price Prediction: XCV vs TRX
IV. Investment Strategy Comparison: XCV vs TRX
V. Potential Risk Comparison
VI. Conclusion: Which Is the Better Buy?
VII. FAQ

