TRG vs QNT: Analyzing the Performance of Two Leading Cryptocurrency Projects in 2023
Introduction: TRG vs QNT Investment Comparison
In the cryptocurrency market, The Rug Game (TRG) vs Quant (QNT) comparison has been an unavoidable topic for investors. The two not only show significant differences in market cap ranking, application scenarios, and price performance but also represent different positioning in the crypto asset space.
The Rug Game (TRG): Since its launch, TRG has gained market recognition as the core governance token of The Rug Game.
Quant (QNT): Introduced in 2018, Quant has been hailed as a technology provider enabling trusted digital interactions, recognized for solving interoperability through its global blockchain operating system, Overledger.
This article will comprehensively analyze the investment value comparison between TRG and QNT, focusing on historical price trends, supply mechanisms, institutional adoption, technological ecosystems, and future predictions, attempting to answer the question investors care about most:
"Which is the better buy right now?" I. Price History Comparison and Current Market Status
TRG and QNT Historical Price Trends
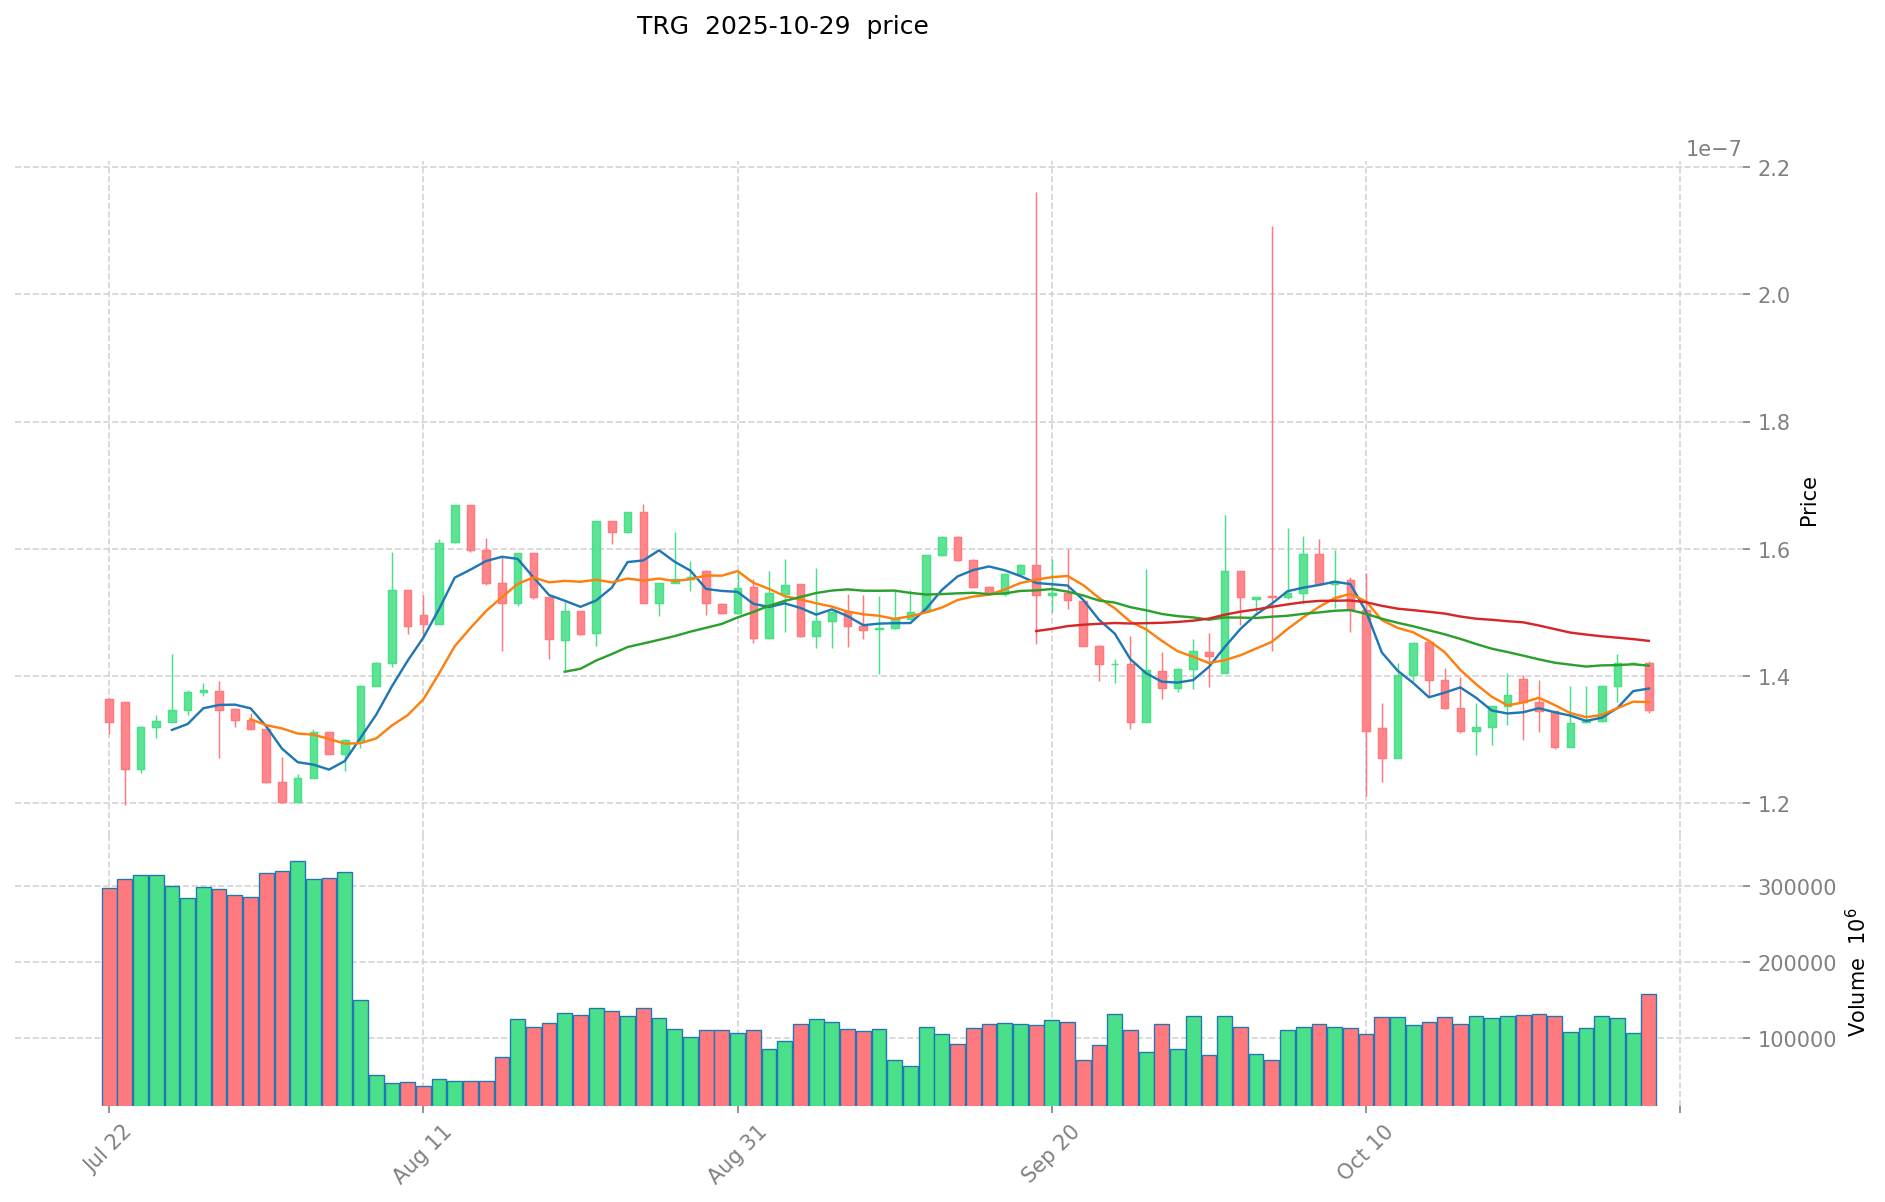
- 2023: TRG reached its all-time high of $0.00000152 on January 17, 2023.
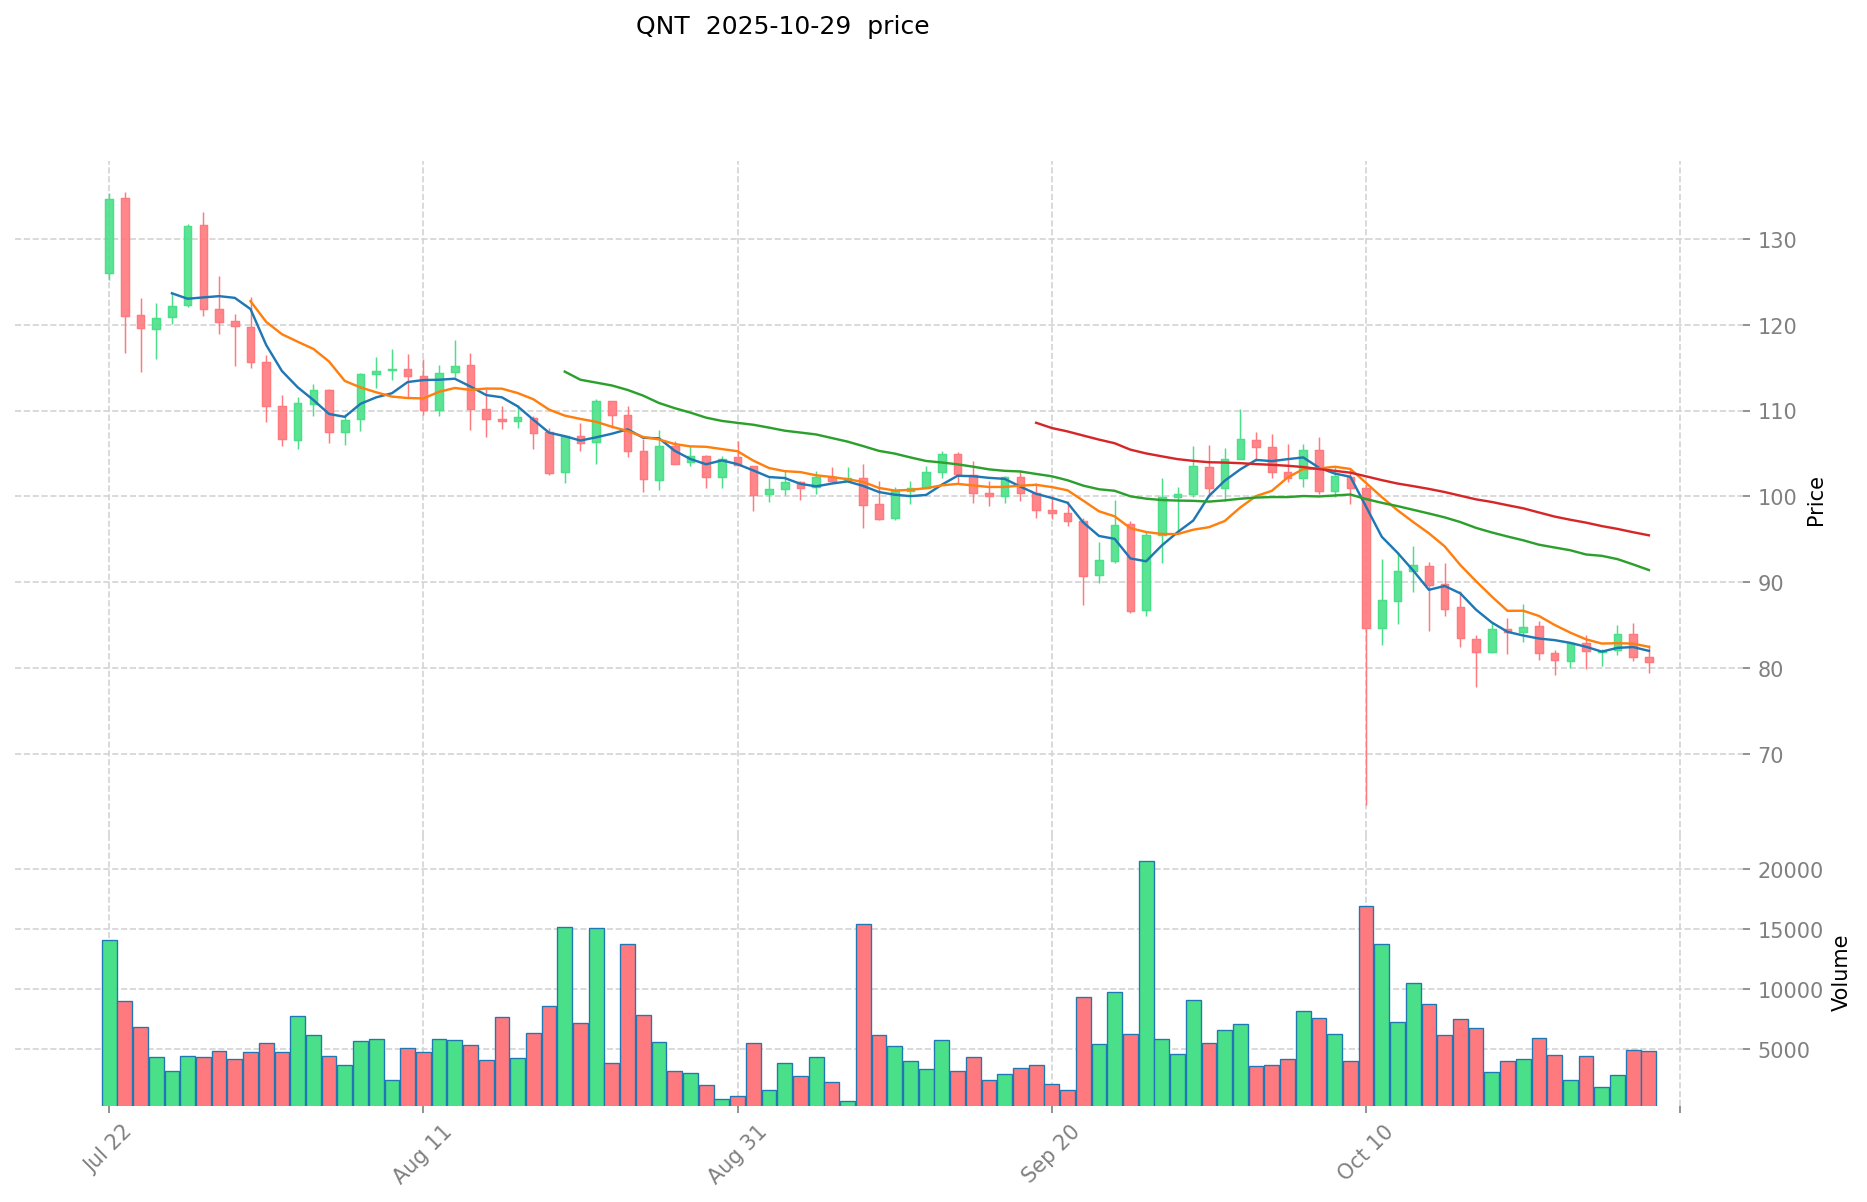
- 2021: QNT hit its all-time high of $427.42 on September 11, 2021.
- Comparative Analysis: In recent market cycles, TRG dropped from its high of $0.00000152 to a low of $0.000000048664, while QNT declined from $427.42 to its current price level.
Current Market Situation (2025-10-30)
- TRG current price: $0.00000013328
- QNT current price: $80.66
- 24-hour trading volume: TRG $26,534.45 vs QNT $378,639.36
- Market Sentiment Index (Fear & Greed Index): 51 (Neutral)
Click to view real-time prices:
- View TRG current price Market Price
- View QNT current price Market Price
II. Technical Analysis
Key Technical Indicators
TRG:
- RSI (14-day): Not available
- Moving Averages: Not available
- Support and Resistance Levels: Not available
QNT:
- RSI (14-day): Not available
- Moving Averages: Not available
- Support and Resistance Levels: Not available
Chart Patterns and Trends
TRG:
- Short-term trend: Slight decline (-0.8% in 24 hours)
- Medium-term trend: Upward (3.42% in 7 days)
- Long-term trend: Mixed (-7.33% in 30 days, +42.68% in 1 year)
QNT:
- Short-term trend: Slight decline (-0.18% in 24 hours)
- Medium-term trend: Slight increase (0.67% in 7 days)
- Long-term trend: Mixed (-22.11% in 30 days, +32.12% in 1 year)
III. Fundamental Analysis
Project Overview
TRG (The Rug Game):
- Core governance token of The Rug Game
- Exists outside of current 10 letter game and all future games
- Total supply: 6,666,666,666,666
- Circulating supply: 5,265,499,541,702
QNT (Quant):
- Technology provider enabling trusted digital interaction
- Created global blockchain operating system Overledger
- Total supply: 14,881,364
- Circulating supply: 14,544,176
Recent Developments
TRG:
- No significant recent developments mentioned in the provided information
QNT:
- No significant recent developments mentioned in the provided information
Market Adoption and Partnerships
TRG:
- No information provided on market adoption or partnerships
QNT:
- Recognized for solving interoperability through Overledger
- Positioned as a leader in enterprise innovation and blockchain adoption
IV. Risk Analysis
Potential Risks
TRG:
- High volatility as evidenced by significant price fluctuations
- Limited information on project development and adoption
QNT:
- Market volatility, though less extreme than TRG
- Dependency on enterprise adoption of blockchain technology
Regulatory Considerations
- No specific regulatory information provided for either token
- Both operate in the evolving cryptocurrency regulatory landscape
V. Investment Considerations
Comparative Metrics
- Market Capitalization: TRG ($701,785) vs QNT ($1,173,133,249)
- Trading Volume (24h): TRG ($26,534) vs QNT ($378,639)
- Circulating Supply Ratio: TRG (78.98%) vs QNT (31.99%)
Potential Growth Factors
TRG:
- Unique position as a governance token for The Rug Game ecosystem
- Potential for growth if the associated games gain popularity
QNT:
- Established position in enterprise blockchain solutions
- Potential for growth with increased adoption of interoperability solutions
VI. Conclusion
Both TRG and QNT present different investment profiles:
- TRG is a smaller, more volatile token with potential for high-risk, high-reward scenarios.
- QNT is a more established project with a larger market cap and focus on enterprise solutions.
Investors should consider their risk tolerance and conduct further research before making any investment decisions.
II. Key Factors Affecting the Investment Value of TRG vs QNT
Supply Mechanisms Comparison (Tokenomics)
- TRG: Limited supply model with deflationary characteristics
- QNT: Fixed maximum supply with controlled distribution mechanism
- 📌 Historical Pattern: Restricted supply mechanisms tend to create cyclical price movements based on market demand fluctuations.
Institutional Adoption and Market Applications
- Institutional Holdings: QNT has gained more institutional interest due to its enterprise-focused utility
- Enterprise Adoption: QNT shows stronger positioning in cross-border payment systems and enterprise blockchain solutions
- Regulatory Attitudes: Both tokens face varying regulatory approaches across jurisdictions
Technological Development and Ecosystem Building
- TRG Technical Development: Focused on blockchain interoperability solutions
- QNT Technical Development: Emphasis on enterprise integration and multi-ledger compatibility
- Ecosystem Comparison: QNT has established more concrete payment and enterprise application use cases
Macroeconomic Factors and Market Cycles
- Inflation Environment Performance: Both assets potentially serve as inflation hedges due to their limited supply models
- Monetary Policy Impact: Interest rate changes and USD strength affect both assets similarly to other digital assets
- Geopolitical Factors: Cross-border transaction needs and international settlement requirements may boost adoption of both tokens
III. 2025-2030 Price Prediction: TRG vs QNT
Short-term Prediction (2025)
- TRG: Conservative $0.000000073348 - $0.00000013336 | Optimistic $0.00000013336 - $0.0000001880376
- QNT: Conservative $40.9479 - $80.29 | Optimistic $80.29 - $84.3045
Mid-term Prediction (2027)
- TRG may enter a growth phase, with an estimated price range of $0.000000099263648 - $0.000000225910373
- QNT may enter a bullish market, with an estimated price range of $61.558343 - $133.07465325
- Key drivers: Institutional capital inflow, ETF, ecosystem development
Long-term Prediction (2030)
- TRG: Base scenario $0.000000256409916 - $0.000000267093662 | Optimistic scenario $0.000000267093662 - $0.000000363247381
- QNT: Base scenario $84.697501760746875 - $130.3038488626875 | Optimistic scenario $130.3038488626875 - $152.455503169344375
Disclaimer: The above predictions are based on historical data and current market trends. Cryptocurrency markets are highly volatile and subject to rapid changes. These projections should not be considered as financial advice or guarantees of future performance. Always conduct your own research and consult with a qualified financial advisor before making investment decisions.
TRG:
| 年份 | 预测最高价 | 预测平均价格 | 预测最低价 | 涨跌幅 |
|---|---|---|---|---|
| 2025 | 0.0000001880376 | 0.00000013336 | 0.000000073348 | 0 |
| 2026 | 0.000000181589644 | 0.0000001606988 | 0.000000133380004 | 20 |
| 2027 | 0.000000225910373 | 0.000000171144222 | 0.000000099263648 | 28 |
| 2028 | 0.000000268011851 | 0.000000198527297 | 0.000000138969108 | 48 |
| 2029 | 0.000000300917751 | 0.000000233269574 | 0.000000167954093 | 75 |
| 2030 | 0.000000363247381 | 0.000000267093662 | 0.000000256409916 | 100 |
QNT:
| 年份 | 预测最高价 | 预测平均价格 | 预测最低价 | 涨跌幅 |
|---|---|---|---|---|
| 2025 | 84.3045 | 80.29 | 40.9479 | 0 |
| 2026 | 98.7567 | 82.29725 | 59.25402 | 2 |
| 2027 | 133.07465325 | 90.526975 | 61.558343 | 12 |
| 2028 | 136.3969932325 | 111.800814125 | 68.19849661625 | 38 |
| 2029 | 136.508794046625 | 124.09890367875 | 116.652969458025 | 53 |
| 2030 | 152.455503169344375 | 130.3038488626875 | 84.697501760746875 | 61 |
IV. Investment Strategy Comparison: TRG vs QNT
Long-term vs Short-term Investment Strategies
- TRG: Suitable for investors focusing on high-risk, high-reward opportunities and gaming ecosystems
- QNT: Suitable for investors interested in enterprise blockchain solutions and interoperability
Risk Management and Asset Allocation
- Conservative investors: TRG: 5% vs QNT: 95%
- Aggressive investors: TRG: 30% vs QNT: 70%
- Hedging tools: Stablecoin allocation, options, cross-currency portfolios
V. Potential Risk Comparison
Market Risk
- TRG: High volatility, limited market data, and potential for significant price swings
- QNT: Market fluctuations tied to enterprise adoption rates and overall blockchain industry trends
Technical Risk
- TRG: Scalability, network stability
- QNT: Interoperability challenges, potential vulnerabilities in the Overledger system
Regulatory Risk
- Global regulatory policies may impact both tokens differently, with QNT potentially facing more scrutiny due to its enterprise focus
VI. Conclusion: Which Is the Better Buy?
📌 Investment Value Summary:
- TRG advantages: High potential returns, unique position in gaming ecosystem
- QNT advantages: Established enterprise solutions, focus on interoperability, larger market cap
✅ Investment Advice:
- Novice investors: Consider a small allocation to QNT as part of a diversified portfolio
- Experienced investors: Balance between TRG and QNT based on risk tolerance, with a larger allocation to QNT
- Institutional investors: Focus on QNT for its enterprise applications and potential for long-term growth
⚠️ Risk Warning: The cryptocurrency market is highly volatile. This article does not constitute investment advice. None
VII. FAQ
Q1: What are the main differences between TRG and QNT? A: TRG is the core governance token of The Rug Game, while QNT is a technology provider enabling trusted digital interactions through its global blockchain operating system, Overledger. TRG has a much larger total supply and lower market cap, while QNT has a more established position in enterprise blockchain solutions.
Q2: Which token has shown better price performance recently? A: Based on the provided data, TRG has shown better recent performance with a 42.68% increase over the past year, compared to QNT's 32.12% increase. However, QNT has a significantly larger market cap and trading volume.
Q3: What are the key factors affecting the investment value of TRG and QNT? A: Key factors include supply mechanisms, institutional adoption, technological development, ecosystem building, and macroeconomic factors. QNT appears to have stronger institutional interest and enterprise adoption, while TRG's value is more closely tied to the success of The Rug Game ecosystem.
Q4: What are the predicted price ranges for TRG and QNT in 2030? A: For TRG, the base scenario predicts a range of $0.000000256409916 - $0.000000267093662, with an optimistic scenario of $0.000000267093662 - $0.000000363247381. For QNT, the base scenario predicts a range of $84.697501760746875 - $130.3038488626875, with an optimistic scenario of $130.3038488626875 - $152.455503169344375.
Q5: How should investors allocate their portfolio between TRG and QNT? A: Conservative investors might consider allocating 5% to TRG and 95% to QNT, while aggressive investors might allocate 30% to TRG and 70% to QNT. The exact allocation should depend on individual risk tolerance and investment goals.
Q6: What are the main risks associated with investing in TRG and QNT? A: TRG faces high volatility and limited market data risks, while QNT's risks are more tied to enterprise adoption rates and overall blockchain industry trends. Both face regulatory risks, with QNT potentially facing more scrutiny due to its enterprise focus.
Q7: Which token is considered a better buy for different types of investors? A: Novice investors might consider a small allocation to QNT as part of a diversified portfolio. Experienced investors could balance between TRG and QNT based on risk tolerance, with a larger allocation to QNT. Institutional investors may focus on QNT for its enterprise applications and potential for long-term growth.
Share
Content

