TRACAI vs BCH: The Battle for Blockchain Supremacy in Artificial Intelligence Integration
Introduction: TRACAI vs BCH Investment Comparison
In the cryptocurrency market, the comparison between TRACAI vs BCH has always been an unavoidable topic for investors. The two not only have significant differences in market cap ranking, application scenarios, and price performance, but also represent different positions in the crypto asset landscape.
OriginTrail (TRACAI): Launched in 2017, it has gained market recognition for its role in building a Verifiable Internet for AI and combating misinformation.
Bitcoin Cash (BCH): Since its inception in 2017, it has been hailed as a continuation of Satoshi's vision for global adoption, and is one of the cryptocurrencies with high global transaction volume and market capitalization.
This article will provide a comprehensive analysis of the investment value comparison between TRACAI vs BCH, focusing on historical price trends, supply mechanisms, institutional adoption, technological ecosystems, and future predictions, attempting to answer the question investors care about most:
"Which is the better buy right now?"
I. Price History Comparison and Current Market Status
TRACAI (Coin A) and BCH (Coin B) Historical Price Trends
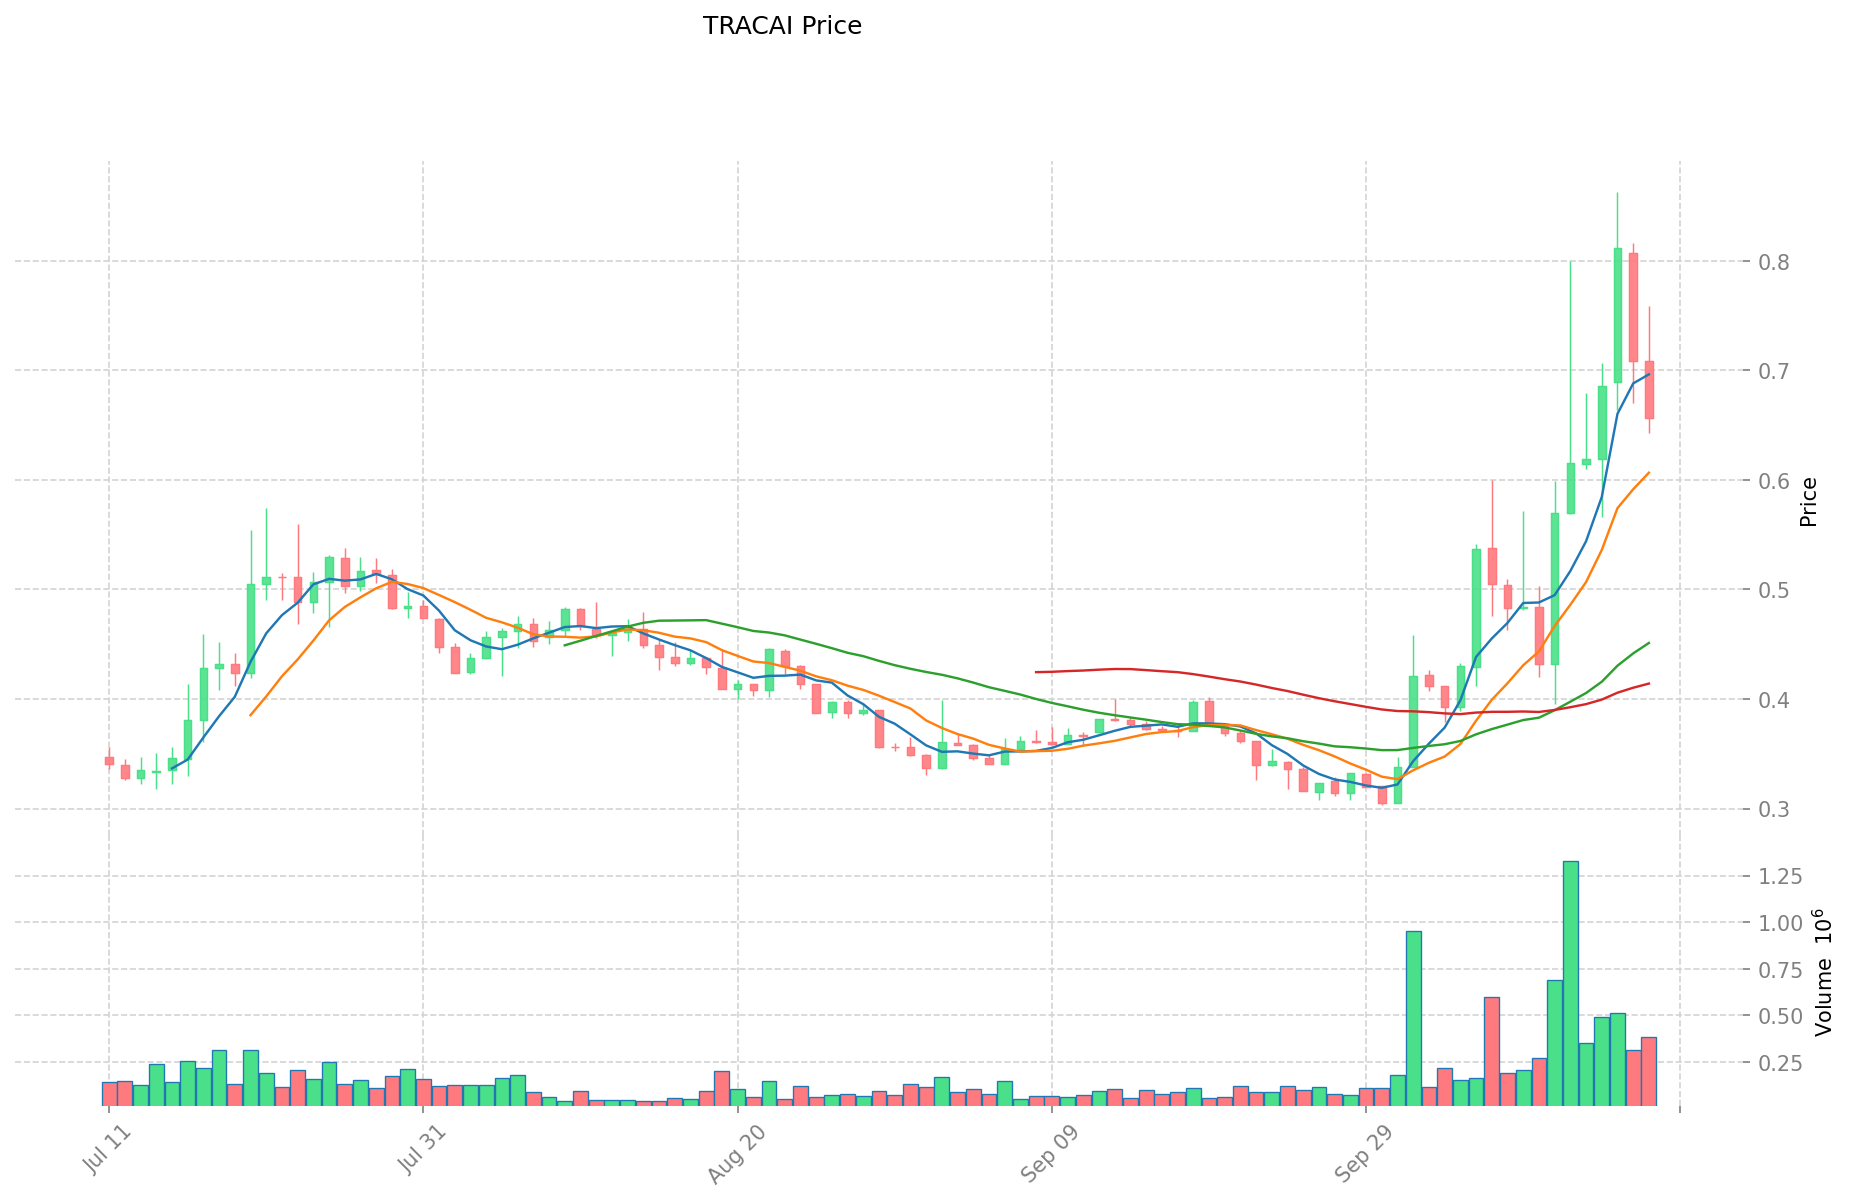
- 2024: TRACAI reached its all-time high of $1.2354 on December 9, 2024.
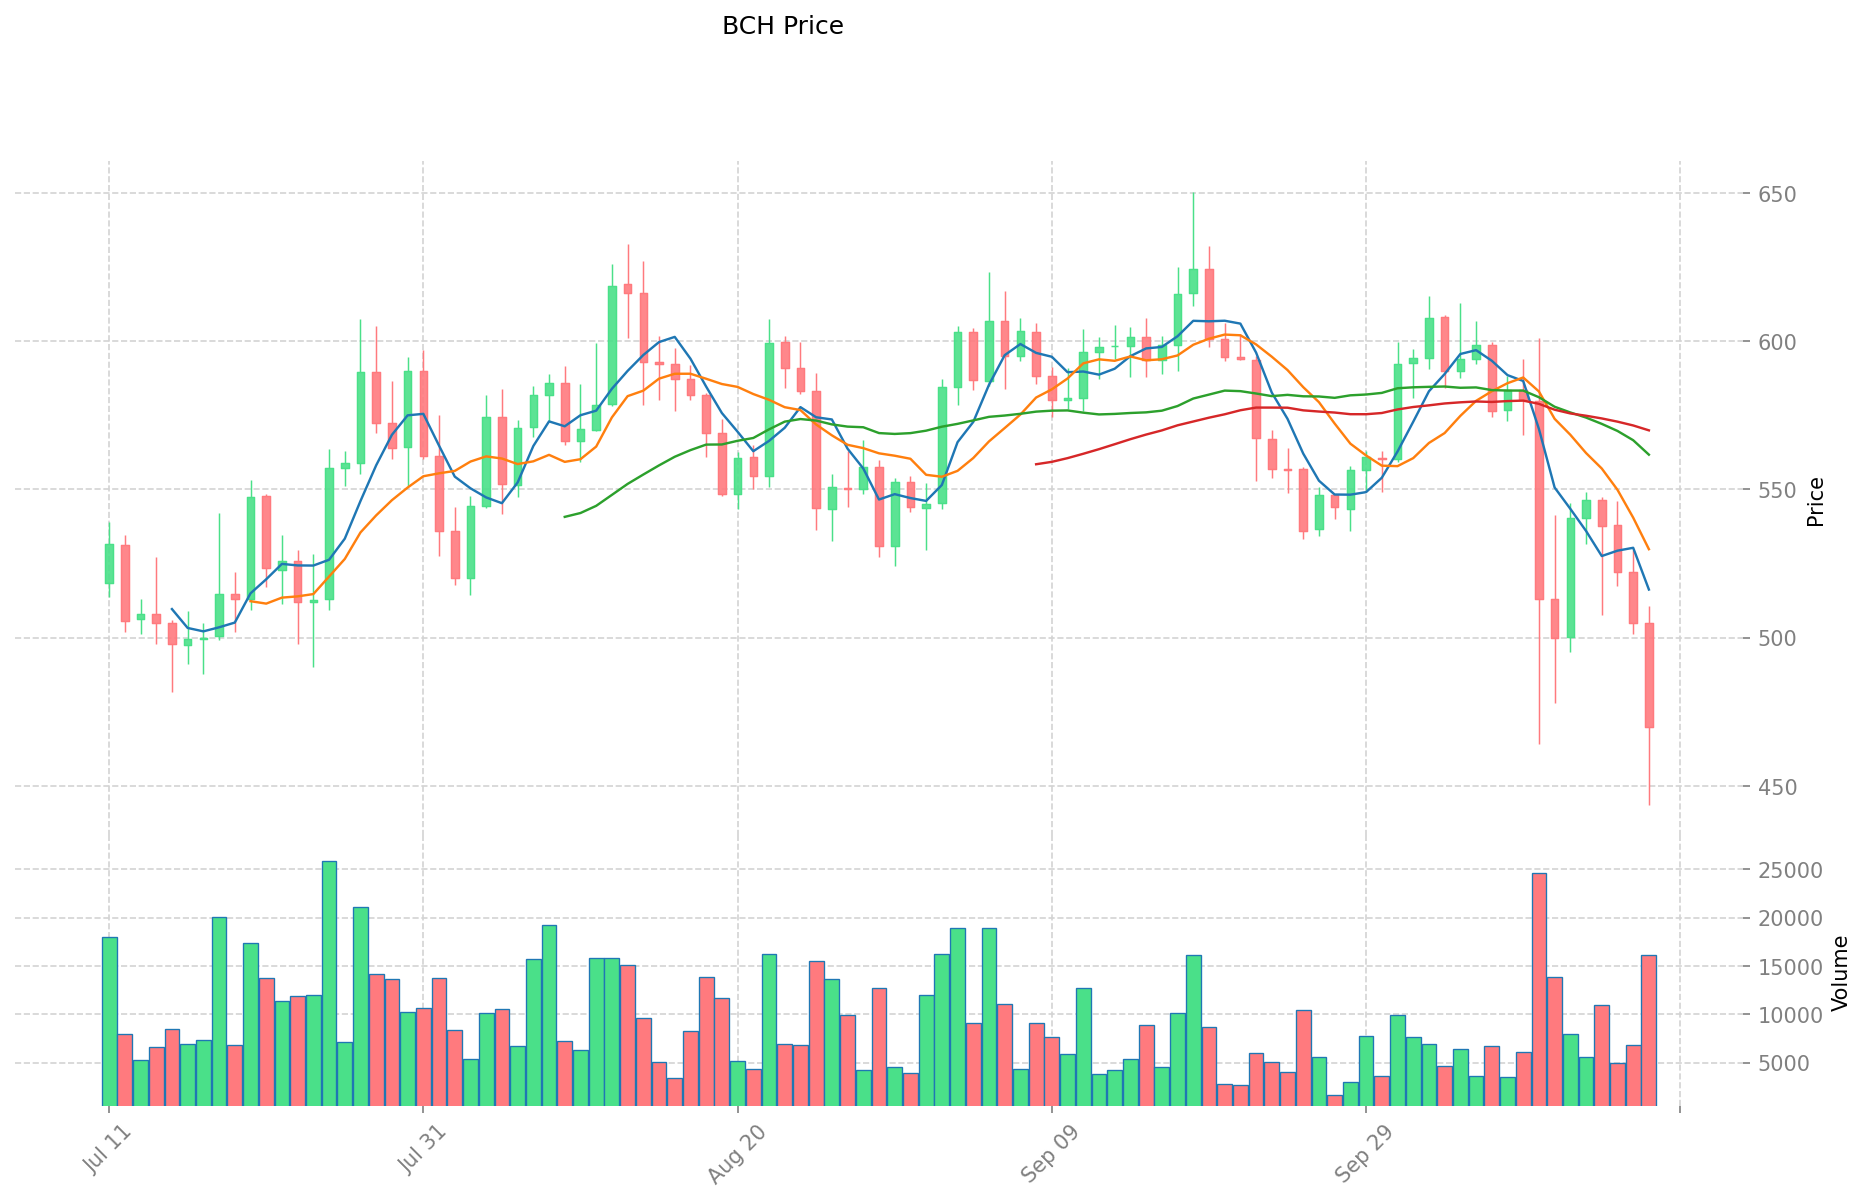
- 2025: BCH experienced significant volatility, with a price range between $443.35 and $510.63 in the past 24 hours.
- Comparative Analysis: In the recent market cycle, TRACAI dropped from its high of $1.2354 to a low of $0.2834, while BCH has shown resilience, maintaining a price above $400 despite market fluctuations.
Current Market Situation (2025-10-18)
- TRACAI current price: $0.6516
- BCH current price: $469.75
- 24-hour trading volume: $262,648.99 (TRACAI) vs $7,650,380.23 (BCH)
- Market Sentiment Index (Fear & Greed Index): 22 (Extreme Fear)
Click to view real-time prices:
- Check TRACAI current price Market Price
- Check BCH current price Market Price
II. Core Factors Affecting the Investment Value of TRAC vs BCH
Supply Mechanisms Comparison (Tokenomics)
- TRAC: Fixed supply with a maximum cap of 500 million tokens. 60% of tokens were distributed during token sale, with 15% reserved for team and advisors, 25% for development and community rewards.
- BCH: Follows Bitcoin's halving mechanism with a maximum supply of 21 million coins. Block rewards are reduced by half approximately every four years.
- 📌 Historical pattern: Fixed supply assets like TRAC tend to benefit from scarcity-driven value preservation, while BCH's predictable inflation reduction through halving events has historically created cyclical price movements.
Institutional Adoption and Market Applications
- Institutional holdings: BCH has greater institutional presence through Grayscale's BCH Trust and inclusion in various crypto indices, while TRAC has limited institutional backing.
- Enterprise adoption: TRAC's supply chain management solutions have been implemented by organizations like BSI, Oracle, and GS1, focused on product authenticity and compliance. BCH is primarily used for payment processing with adoption by BitPay and other payment processors.
- National policies: BCH faces similar regulatory scrutiny as other cryptocurrencies but benefits from broader recognition. TRAC operates in a more specialized regulatory environment focused on supply chain data management and verification systems.
Technical Development and Ecosystem Building
- TRAC technical upgrades: Implementation of Decentralized Knowledge Graph (DKG) allowing for more efficient data management and querying capabilities across supply chains.
- BCH technical development: Focus on maintaining low transaction fees, fast confirmation times, and implementing SmartBCH layer to enable smart contract functionality.
- Ecosystem comparison: BCH has a more developed ecosystem for payments and basic financial services, while TRAC is building specialized infrastructure for supply chain data integrity, with growing applications in product verification and compliance.
Macroeconomic Factors and Market Cycles
- Performance in inflationary environments: BCH positions itself as digital cash with similar narrative to Bitcoin regarding inflation protection. TRAC's value is more tied to real-world supply chain adoption than monetary policy.
- Macroeconomic monetary policy: BCH price shows higher correlation with broader crypto market movements during interest rate changes, while TRAC demonstrates more resilience based on its utility-focused model.
- Geopolitical factors: Cross-border supply chain disruptions potentially increase demand for TRAC's verification systems, while economic instability can drive BCH adoption as an alternative payment system in affected regions.
III. 2025-2030 Price Prediction: TRACAI vs BCH
Short-term Prediction (2025)
- TRACAI: Conservative $0.59076 - $0.6564 | Optimistic $0.6564 - $0.8205
- BCH: Conservative $375.896 - $469.87 | Optimistic $469.87 - $629.6258
Mid-term Prediction (2027)
- TRACAI may enter a growth phase, with expected prices ranging from $0.4548852 to $1.11284415
- BCH may enter a consolidation phase, with expected prices ranging from $439.02867294 to $718.41055572
- Key drivers: Institutional capital inflow, ETF, ecosystem development
Long-term Prediction (2030)
- TRACAI: Base scenario $1.26481642155 - $1.720150333308 | Optimistic scenario $1.720150333308+
- BCH: Base scenario $806.918736184704 - $1016.71760759272704 | Optimistic scenario $1016.71760759272704+
Disclaimer: The above predictions are based on historical data and market analysis. Cryptocurrency markets are highly volatile and subject to rapid changes. These forecasts should not be considered as financial advice. Always conduct your own research and consult with a qualified financial advisor before making investment decisions.
TRACAI:
| 年份 | 预测最高价 | 预测平均价格 | 预测最低价 | 涨跌幅 |
|---|---|---|---|---|
| 2025 | 0.8205 | 0.6564 | 0.59076 | 0 |
| 2026 | 0.88614 | 0.73845 | 0.708912 | 13 |
| 2027 | 1.11284415 | 0.812295 | 0.4548852 | 24 |
| 2028 | 1.347597405 | 0.962569575 | 0.654547311 | 47 |
| 2029 | 1.3745493531 | 1.15508349 | 0.5890925799 | 77 |
| 2030 | 1.720150333308 | 1.26481642155 | 1.2268719289035 | 94 |
BCH:
| 年份 | 预测最高价 | 预测平均价格 | 预测最低价 | 涨跌幅 |
|---|---|---|---|---|
| 2025 | 629.6258 | 469.87 | 375.896 | 0 |
| 2026 | 780.642018 | 549.7479 | 335.346219 | 17 |
| 2027 | 718.41055572 | 665.194959 | 439.02867294 | 41 |
| 2028 | 802.4911985376 | 691.80275736 | 477.3439025784 | 47 |
| 2029 | 866.690494420608 | 747.1469779488 | 545.417293902624 | 59 |
| 2030 | 1016.71760759272704 | 806.918736184704 | 774.64198673731584 | 71 |
IV. Investment Strategy Comparison: TRACAI vs BCH
Long-term vs Short-term Investment Strategy
- TRACAI: Suitable for investors focused on supply chain solutions and ecosystem potential
- BCH: Suitable for investors seeking established payment networks and potential inflation hedge
Risk Management and Asset Allocation
- Conservative investors: TRACAI: 20% vs BCH: 80%
- Aggressive investors: TRACAI: 40% vs BCH: 60%
- Hedging tools: Stablecoin allocation, options, cross-currency portfolios
V. Potential Risk Comparison
Market Risk
- TRACAI: Higher volatility due to lower market cap and trading volume
- BCH: Susceptible to broader cryptocurrency market trends and Bitcoin price movements
Technical Risk
- TRACAI: Scalability, network stability
- BCH: Mining centralization, potential security vulnerabilities
Regulatory Risk
- Global regulatory policies may have differing impacts on both assets
VI. Conclusion: Which Is the Better Buy?
📌 Investment Value Summary:
- TRACAI advantages: Niche market focus, potential for growth in supply chain management
- BCH advantages: Established network, wider adoption for payments, potential as digital cash
✅ Investment Advice:
- New investors: Consider a smaller allocation to TRACAI for potential growth, larger allocation to BCH for stability
- Experienced investors: Balanced portfolio with both assets, adjusting based on risk tolerance
- Institutional investors: Evaluate BCH for larger allocations, consider TRACAI for targeted exposure to supply chain solutions
⚠️ Risk Warning: The cryptocurrency market is highly volatile. This article does not constitute investment advice. None
VII. FAQ
Q1: What are the main differences between TRACAI and BCH? A: TRACAI focuses on supply chain management and data integrity solutions, while BCH is primarily used as a digital currency for payments. TRACAI has a fixed supply of 500 million tokens, whereas BCH follows Bitcoin's halving mechanism with a maximum supply of 21 million coins.
Q2: Which cryptocurrency has shown better price performance recently? A: Based on recent data, BCH has shown more price stability, maintaining a price above $400 despite market fluctuations. TRACAI, however, experienced a significant drop from its all-time high of $1.2354 to a low of $0.2834.
Q3: How do institutional adoption rates compare between TRACAI and BCH? A: BCH has greater institutional presence, being included in Grayscale's BCH Trust and various crypto indices. TRACAI has limited institutional backing but has been implemented by organizations like BSI, Oracle, and GS1 for supply chain solutions.
Q4: What are the key technical developments for each cryptocurrency? A: TRACAI has implemented a Decentralized Knowledge Graph (DKG) for efficient data management in supply chains. BCH focuses on maintaining low transaction fees, fast confirmation times, and has implemented SmartBCH for smart contract functionality.
Q5: How do the long-term price predictions compare for TRACAI and BCH? A: By 2030, TRACAI's base scenario price range is predicted to be $1.26481642155 - $1.720150333308, while BCH's base scenario range is $806.918736184704 - $1016.71760759272704. Both have potential for higher prices in optimistic scenarios.
Q6: What are the recommended investment strategies for TRACAI and BCH? A: For conservative investors, a suggested allocation is 20% TRACAI and 80% BCH. Aggressive investors might consider 40% TRACAI and 60% BCH. It's advisable to adjust based on individual risk tolerance and market conditions.
Q7: What are the main risks associated with investing in TRACAI and BCH? A: TRACAI faces higher volatility due to its lower market cap and trading volume, as well as potential scalability issues. BCH is susceptible to broader cryptocurrency market trends and faces risks related to mining centralization. Both are subject to regulatory risks that may vary by jurisdiction.
Share
Content