TPT vs BNB: Comparing Two Popular Cryptocurrency Platforms for Yield Farming
Introduction: TPT vs BNB Investment Comparison
In the cryptocurrency market, the comparison between TPT and BNB remains a topic that investors cannot overlook. The two not only show significant differences in market cap ranking, application scenarios, and price performance, but also represent different positioning in the crypto asset space.
TokenPocket (TPT): Since its launch, it has gained market recognition as the utility token of the TokenPocket ecosystem.
Binance Coin (BNB): Introduced in 2017, it has been hailed as the fuel for the Binance ecosystem and is one of the cryptocurrencies with the highest global trading volume and market capitalization.
This article will comprehensively analyze the investment value comparison between TPT and BNB, focusing on historical price trends, supply mechanisms, institutional adoption, technological ecosystems, and future predictions, attempting to answer the question most concerning to investors:
"Which is the better buy right now?"
I. Price History Comparison and Current Market Status
TPT and BNB Historical Price Trends
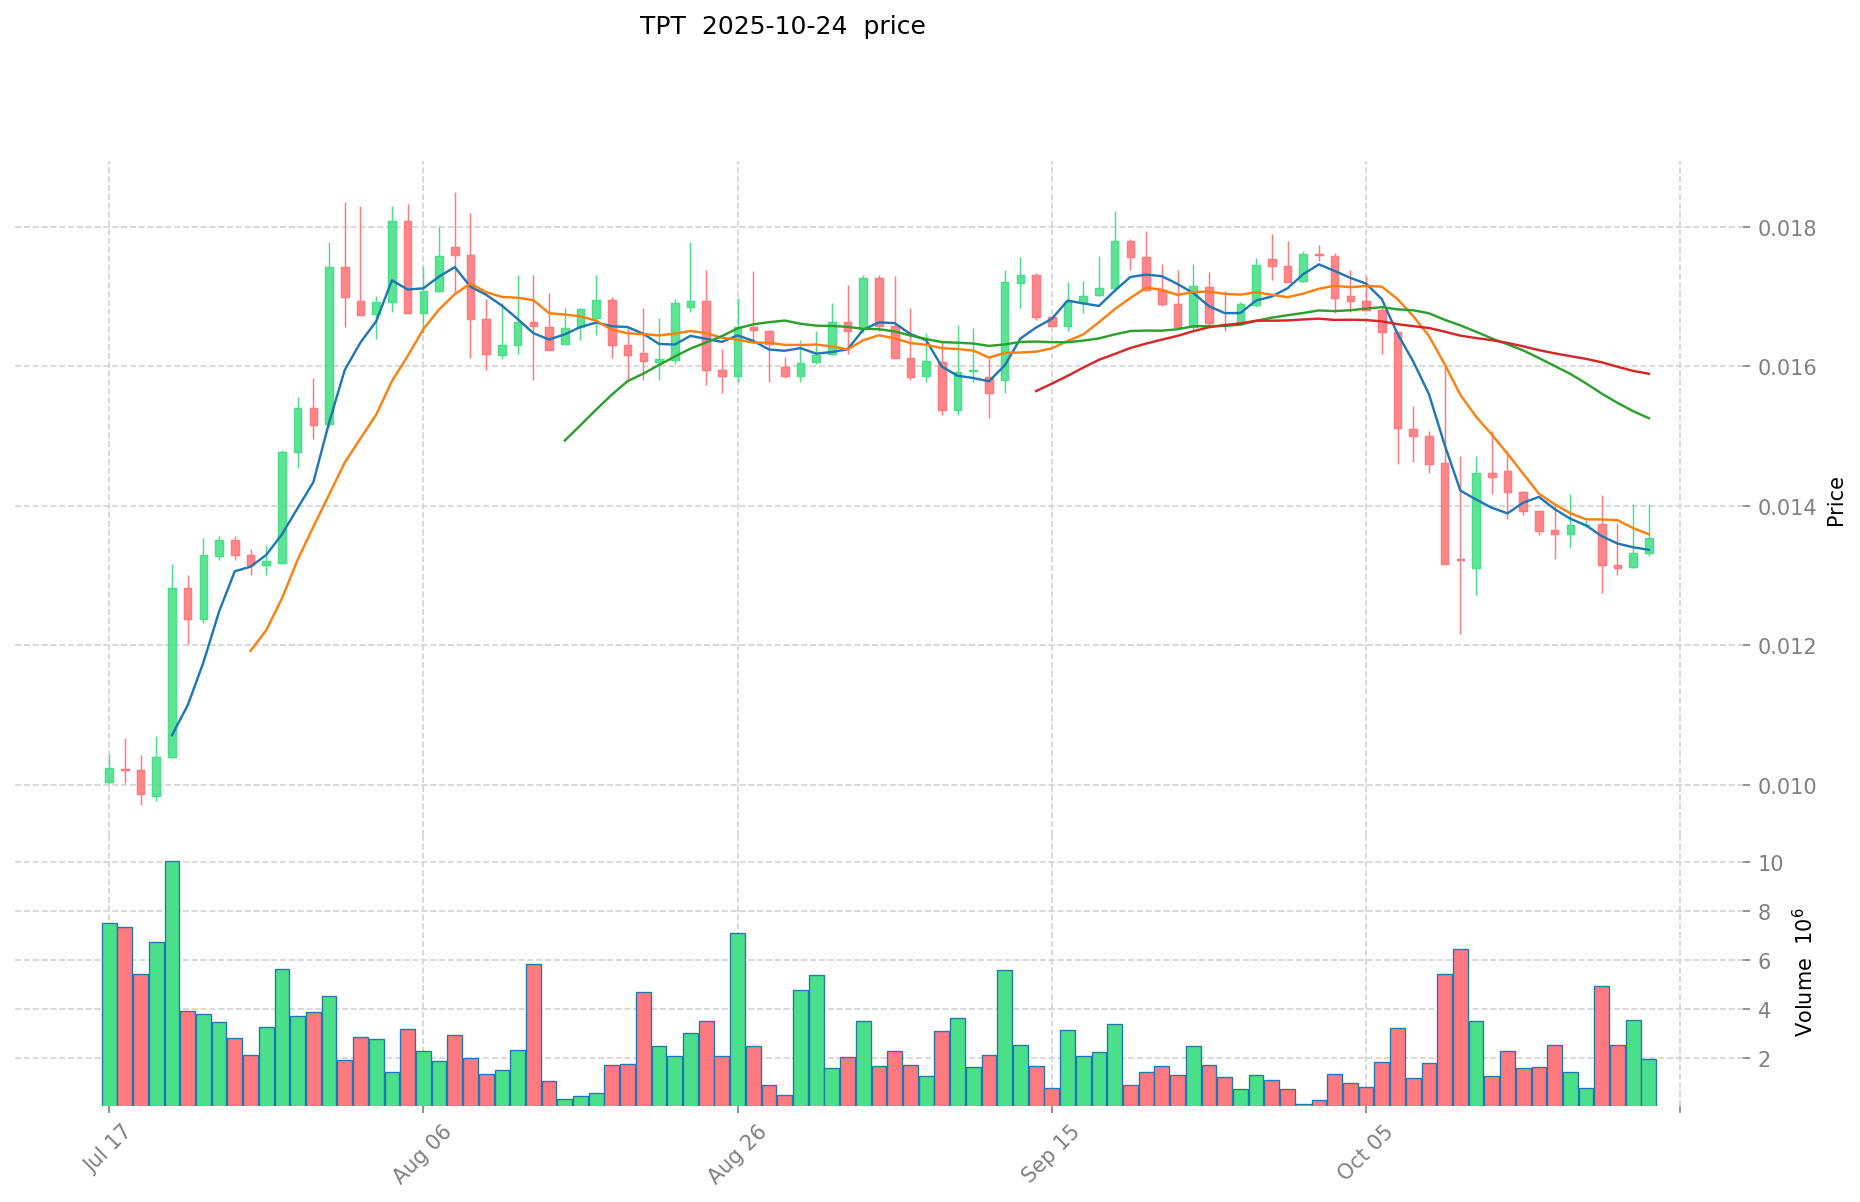
- 2021: TPT reached its all-time high of $0.14558 on May 14, 2021.
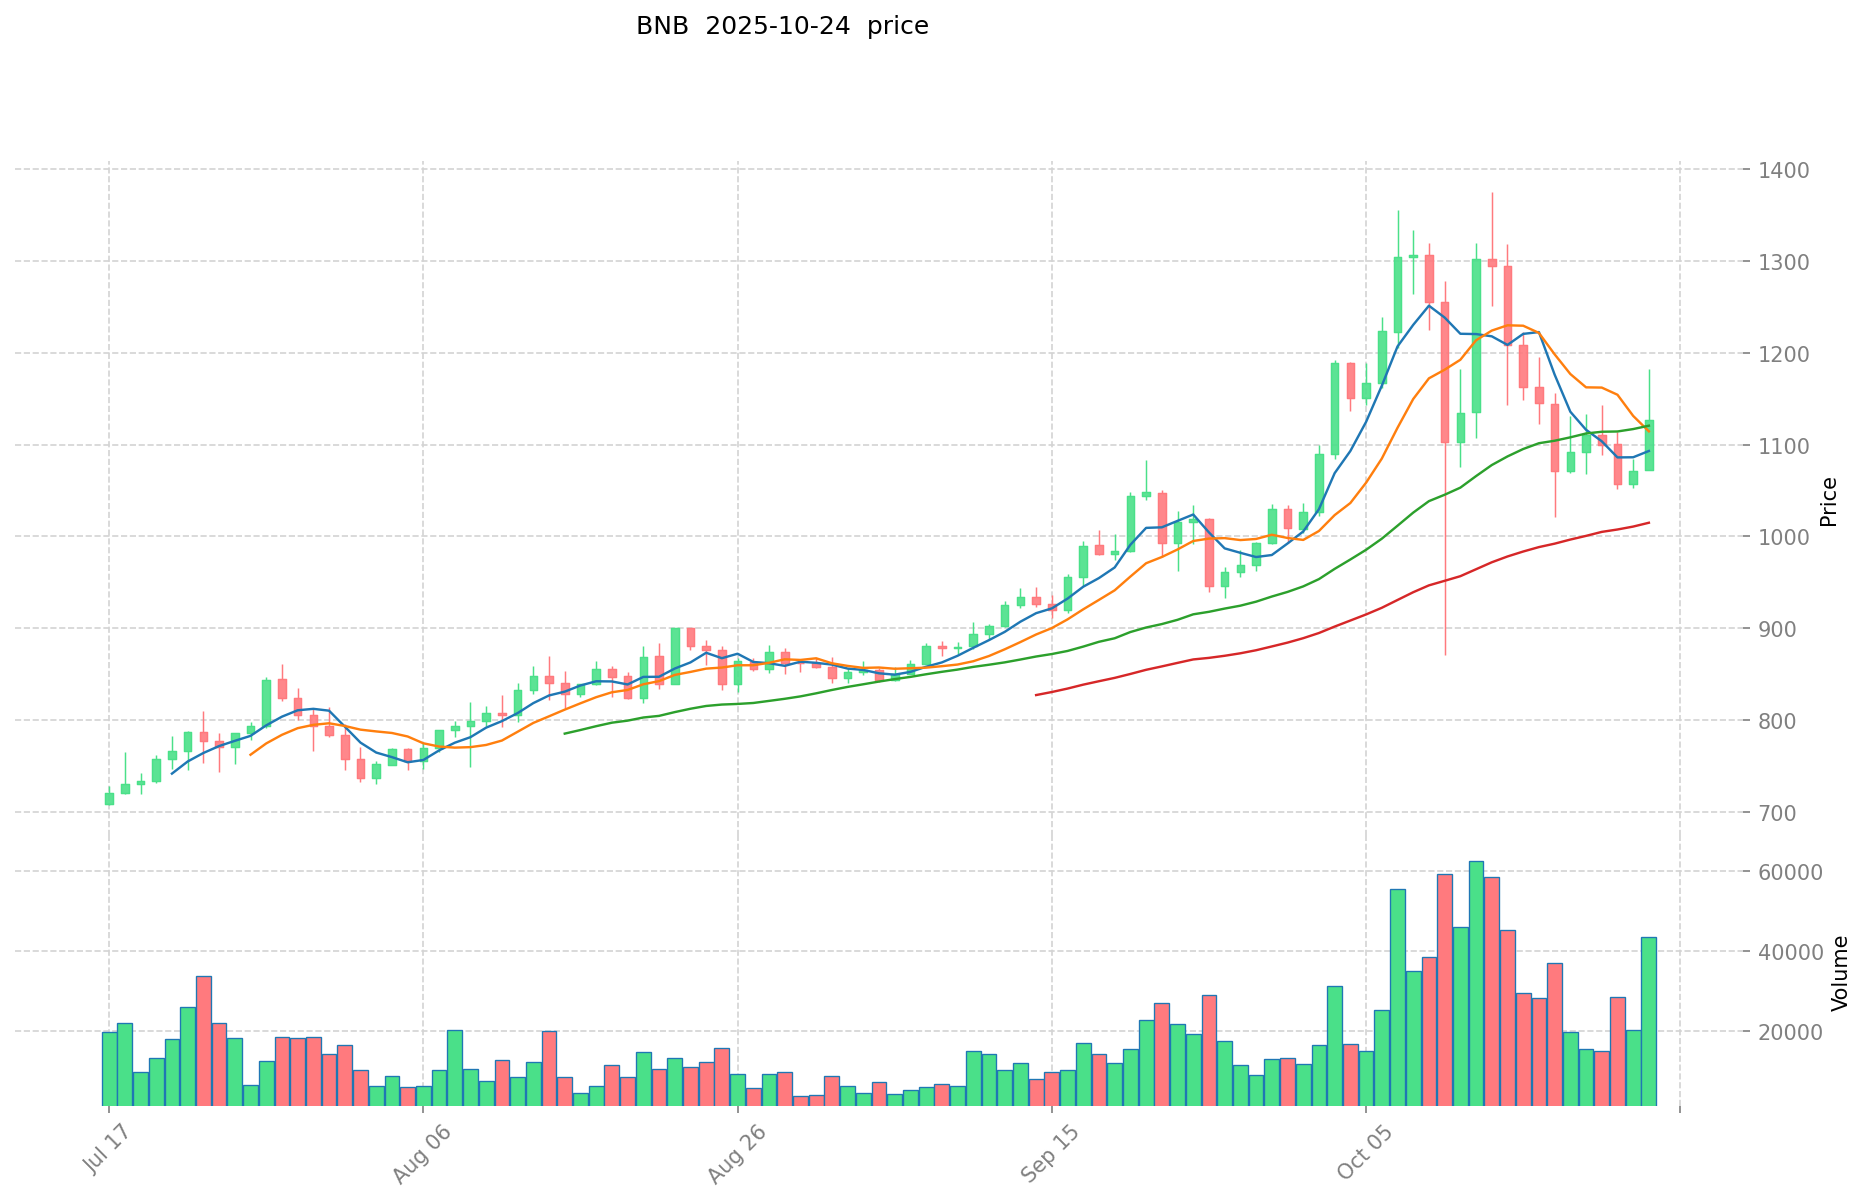
- 2025: BNB achieved a new all-time high of $1,369.99 on October 13, 2025.
- Comparative analysis: During the 2020-2025 market cycle, TPT dropped from its peak of $0.14558 to a low of $0.00012901, while BNB showed stronger resilience, rising from $38.50 to over $1,300.
Current Market Situation (2025-10-24)
- TPT current price: $0.013536
- BNB current price: $1132.4
- 24-hour trading volume: TPT $26,532.62 vs BNB $48,861,628.61
- Market Sentiment Index (Fear & Greed Index): 27 (Fear)
Click to view real-time prices:
- View TPT current price Market Price
- View BNB current price Market Price
II. Key Factors Affecting TPT vs BNB Investment Value
Supply Mechanism Comparison (Tokenomics)
- TPT: High volatility driven by market supply and demand, trading volume, and investor sentiment
- BNB: Features a dividend mechanism where larger holdings result in higher platform benefits and dividend amounts
- 📌 Historical pattern: Price volatility in tokens like TPT suggests implementing risk management strategies such as dollar-cost averaging (DCA)
Technology Development and Ecosystem Building
- BNB: Built on BNB Chain to ensure smooth user experience
- BNB: Includes advanced AI model integration with cutting-edge generative AI technology
- Ecosystem comparison: BNB offers strategic advantages through its ecosystem infrastructure
Macroeconomic and Market Cycles
- Market factors: News events and investor sentiment significantly impact TPT's price volatility
- Token utility: BNB provides liquidity utility as represented by mathematical models in blockchain token pricing research
- Investment approach: High volatility in assets like TPT necessitates strategic investment approaches to manage risk exposure
III. 2025-2030 Price Prediction: TPT vs BNB
Short-term Prediction (2025)
- TPT: Conservative $0.00906912 - $0.013536 | Optimistic $0.013536 - $0.01407744
- BNB: Conservative $668.352 - $1132.8 | Optimistic $1132.8 - $1325.376
Mid-term Prediction (2027)
- TPT may enter a growth phase, with an estimated price range of $0.01286095968 - $0.016576348032
- BNB may enter a bullish market, with an estimated price range of $881.0717328 - $2016.011592
- Key drivers: Institutional capital inflow, ETF, ecosystem development
Long-term Prediction (2030)
- TPT: Base scenario $0.017309437023715 - $0.022329173760592 | Optimistic scenario $0.022329173760592+
- BNB: Base scenario $2115.7453654659 - $2983.200965306919 | Optimistic scenario $2983.200965306919+
Disclaimer: These predictions are based on historical data and market trends. Cryptocurrency markets are highly volatile and subject to change. This information should not be considered as financial advice.
TPT:
| 年份 | 预测最高价 | 预测平均价格 | 预测最低价 | 涨跌幅 |
|---|---|---|---|---|
| 2025 | 0.01407744 | 0.013536 | 0.00906912 | 0 |
| 2026 | 0.0147731904 | 0.01380672 | 0.007593696 | 2 |
| 2027 | 0.016576348032 | 0.0142899552 | 0.01286095968 | 5 |
| 2028 | 0.01867411345536 | 0.015433151616 | 0.00972288551808 | 14 |
| 2029 | 0.01756524151175 | 0.01705363253568 | 0.016371487234252 | 25 |
| 2030 | 0.022329173760592 | 0.017309437023715 | 0.010385662214229 | 27 |
BNB:
| 年份 | 预测最高价 | 预测平均价格 | 预测最低价 | 涨跌幅 |
|---|---|---|---|---|
| 2025 | 1325.376 | 1132.8 | 668.352 | 0 |
| 2026 | 1757.59584 | 1229.088 | 1044.7248 | 8 |
| 2027 | 2016.011592 | 1493.34192 | 881.0717328 | 31 |
| 2028 | 2333.72008548 | 1754.676756 | 1473.92847504 | 55 |
| 2029 | 2187.2923101918 | 2044.19842074 | 1226.519052444 | 80 |
| 2030 | 2983.200965306919 | 2115.7453654659 | 1248.289765624881 | 87 |
IV. Investment Strategy Comparison: TPT vs BNB
Long-term vs Short-term Investment Strategies
- TPT: Suitable for investors focusing on ecosystem potential and high-risk, high-reward opportunities
- BNB: Suitable for investors seeking stability and ecosystem-wide utility
Risk Management and Asset Allocation
- Conservative investors: TPT: 10% vs BNB: 90%
- Aggressive investors: TPT: 30% vs BNB: 70%
- Hedging tools: Stablecoin allocation, options, cross-currency portfolios
V. Potential Risk Comparison
Market Risk
- TPT: High volatility, susceptible to market sentiment
- BNB: Relatively lower volatility, but still subject to overall crypto market trends
Technical Risk
- TPT: Scalability, network stability
- BNB: Centralization concerns, potential security vulnerabilities
Regulatory Risk
- Global regulatory policies may have different impacts on both tokens
VI. Conclusion: Which Is the Better Buy?
📌 Investment Value Summary:
- TPT advantages: High growth potential, ecosystem utility
- BNB advantages: Established ecosystem, strong market position, diverse use cases
✅ Investment Advice:
- Novice investors: Consider BNB for its relative stability and established ecosystem
- Experienced investors: Diversify between BNB and TPT, with a larger allocation to BNB
- Institutional investors: Focus on BNB for its liquidity and market depth, consider TPT for potential high growth
⚠️ Risk Warning: The cryptocurrency market is highly volatile. This article does not constitute investment advice. None
VII. FAQ
Q1: What are the main differences between TPT and BNB? A: TPT is the utility token of the TokenPocket ecosystem, while BNB is the fuel for the Binance ecosystem. BNB has a significantly higher market cap, trading volume, and a more established ecosystem compared to TPT.
Q2: Which token has shown better price performance historically? A: BNB has demonstrated stronger price performance and resilience. While TPT reached its all-time high of $0.14558 in 2021 and subsequently declined, BNB achieved a new all-time high of $1,369.99 in 2025 and has maintained a higher price level.
Q3: How do the supply mechanisms of TPT and BNB differ? A: TPT's price is primarily driven by market supply and demand, trading volume, and investor sentiment, resulting in high volatility. BNB features a dividend mechanism where larger holdings result in higher platform benefits and dividend amounts.
Q4: What are the key factors affecting the investment value of these tokens? A: Key factors include technology development, ecosystem building, macroeconomic conditions, market cycles, token utility, and institutional adoption. BNB has strategic advantages due to its more developed ecosystem infrastructure.
Q5: What are the price predictions for TPT and BNB in 2030? A: For TPT, the base scenario predicts a range of $0.017309437023715 - $0.022329173760592, with an optimistic scenario above $0.022329173760592. For BNB, the base scenario predicts a range of $2115.7453654659 - $2983.200965306919, with an optimistic scenario above $2983.200965306919.
Q6: How should investors allocate their portfolio between TPT and BNB? A: Conservative investors might consider allocating 10% to TPT and 90% to BNB, while more aggressive investors might opt for 30% TPT and 70% BNB. The specific allocation should be based on individual risk tolerance and investment goals.
Q7: Which token is considered a better buy for different types of investors? A: For novice investors, BNB is generally considered a better option due to its relative stability and established ecosystem. Experienced investors might consider diversifying between both tokens, with a larger allocation to BNB. Institutional investors may focus on BNB for its liquidity and market depth, while considering TPT for potential high growth opportunities.
Share
Content
Introduction: TPT vs BNB Investment Comparison
I. Price History Comparison and Current Market Status
II. Key Factors Affecting TPT vs BNB Investment Value
III. 2025-2030 Price Prediction: TPT vs BNB
IV. Investment Strategy Comparison: TPT vs BNB
V. Potential Risk Comparison
VI. Conclusion: Which Is the Better Buy?
VII. FAQ

