TONC ve HBAR: İki Potansiyel Blockchain Teknolojisinin Karşılaştırmalı Analizi


Giriş: TONC ve HBAR Yatırım Karşılaştırması
Kripto para piyasasında TONC ile HBAR arasındaki karşılaştırma, yatırımcılar açısından vazgeçilmez bir gündemdir. Her iki varlık; piyasa değeri sıralaması, kullanım senaryoları ve fiyat performansında belirgin farklılıklar sunarken, kripto varlık ekosisteminde de farklı konumlanmaları temsil etmektedir.
TONCommunity (TONC): 2020 yılında piyasaya sürülen bu proje, merkeziyetsiz küresel blokzincir ağı olarak piyasa tarafından tanınmıştır.
Hedera (HBAR): 2020’den bu yana hızlı, güvenli ve adil bir halka açık defter ağı olarak öne çıkmakta olup hashgraph konsensüs mekanizması kullanmaktadır.
Bu makalede, TONC ile HBAR’ın yatırım değerleri; tarihsel fiyat eğilimleri, arz mekanizması, kurumsal benimseme, teknolojik ekosistem ve gelecek öngörüleri üzerinden kapsamlı biçimde analiz edilecek ve yatırımcıların en merak ettiği soruya odaklanılacaktır:
"Bugün hangisi daha cazip bir yatırım?"
I. Fiyat Geçmişi Karşılaştırması ve Mevcut Piyasa Durumu
TONC ve HBAR Tarihi Fiyat Eğilimleri
- 2020: TONC, 07 Mayıs 2020’de merkeziyetsiz küresel blokzincir ağı olarak piyasaya sürüldü.
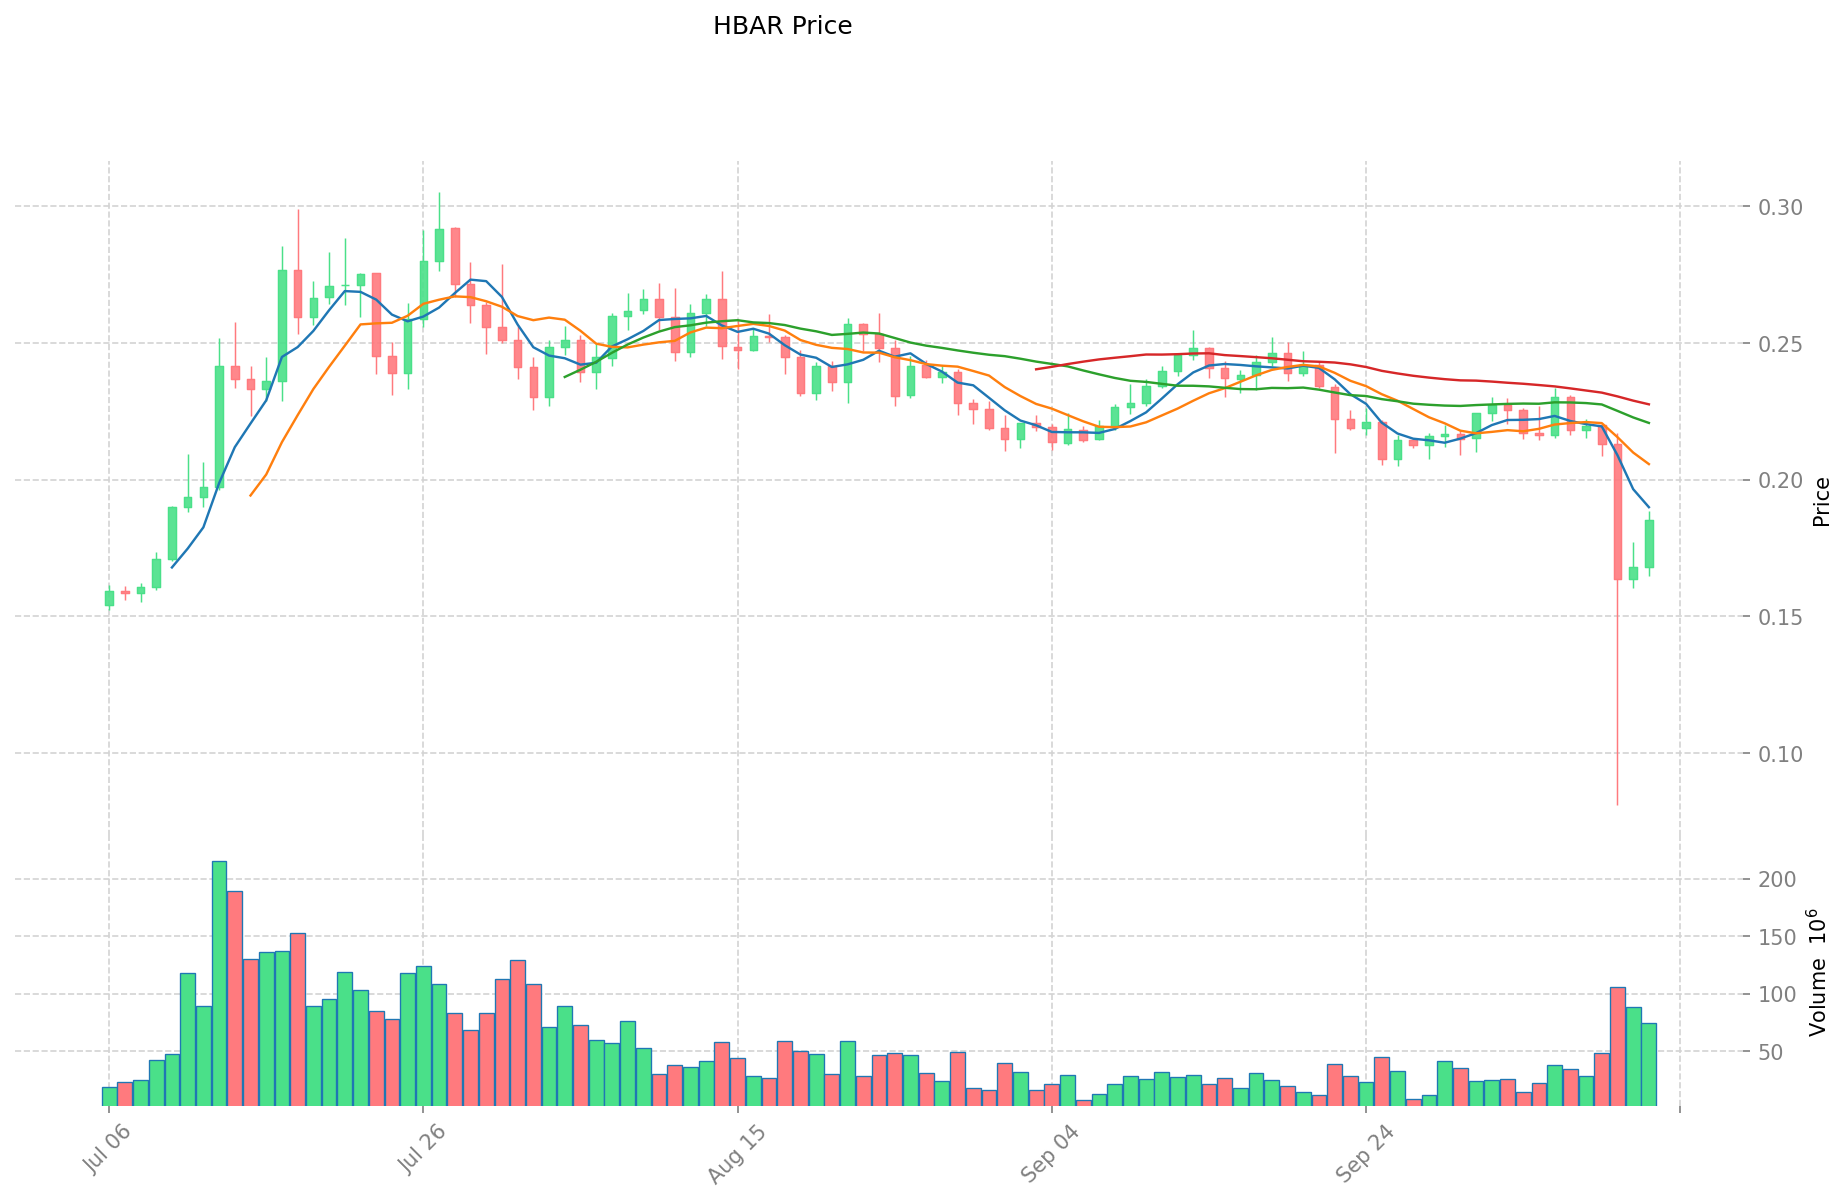
- 2021: HBAR, 15 Eylül 2021’de $0,569229 ile tüm zamanların en yüksek fiyatına ulaştı.
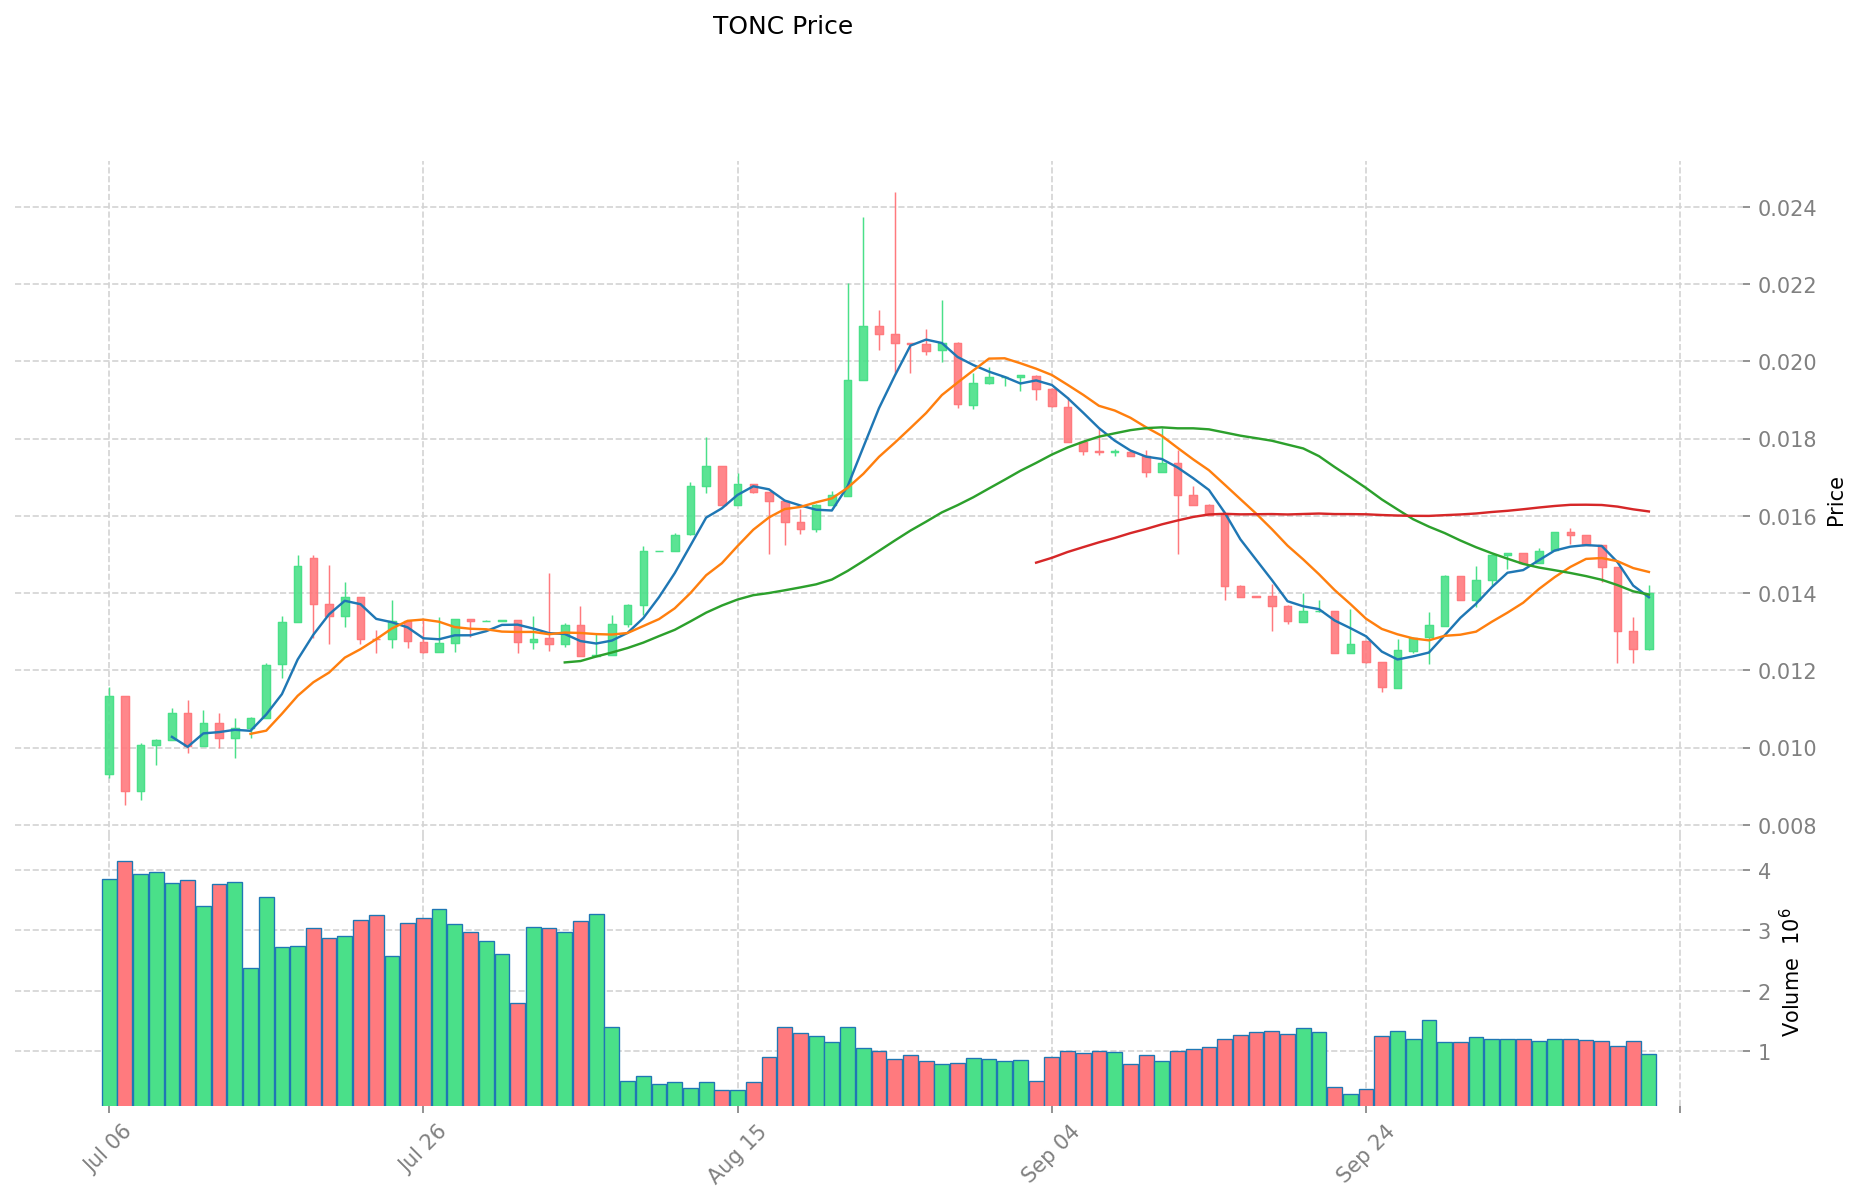
- Karşılaştırmalı değerlendirme: TONC’un rekor yüksek fiyatı $0,104949 ile 03 Eylül 2020’de, en düşük fiyatı ise $0,00331783 ile 10 Ağustos 2021’de oluştu. HBAR ise toplamda daha yüksek fiyat dalgalanmaları göstermiştir.
Güncel Piyasa Durumu (13 Ekim 2025)
- TONC güncel fiyatı: $0,013989
- HBAR güncel fiyatı: $0,18527
- 24 saatlik işlem hacmi: TONC $12.460,51 - HBAR $13.195.836,33
- Piyasa Duyarlılık Endeksi (Korku & Açgözlülük): 24 (Aşırı Korku)
Canlı fiyatları görmek için tıklayın:
- TONC güncel fiyatı için Piyasa Fiyatı
- HBAR güncel fiyatı için Piyasa Fiyatı
HBAR Yatırım Değeri: Temel Faktörlerin Analizi
I. HBAR Temel Analizi
Gelişmiş Teknolojik Altyapı
- Hashgraph Teknolojisi: HBAR, blokzincir yerine hashgraph algoritmasıyla saniyede binlerce işlem ve $0,0001 gibi düşük işlem ücretleri sunarak enerji kullanımında geleneksel blokzincirlerden daha verimlidir.
- Hız ve Ölçeklenebilirlik: Hedera’nın ağ mimarisi, yüksek hızlı işlemleri düşük maliyetle sunar ve kurumsal kullanımlar için avantaj sağlar.
Kurumsal Entegrasyon ve Benimseme
- Kurumsal Ortaklıklar: Avustralya Merkez Bankası ve Google gibi büyük kurumlar, Hashgraph teknolojisi üzerinde projeler geliştirmektedir.
- Finansal Entegrasyon: Grayscale, Hedera’yı Smart Contract Platform Select Fund’a dahil etti; Kraken ise HBAR yatırımı ve ticaretini destekliyor.
- Piyasa Konumlandırması: HBAR, global ödeme altyapısında XRP ve XLM ile rekabet ederek sınır ötesi ödeme uygulamalarında öne çıkıyor.
Piyasa Performansı ve Yatırımcı Duyarlılığı
- Son Fiyat Hareketleri: HBAR, $0,22 direncini aşarak $0,23 seviyesine ulaştı; yükselen işlem hacmi, piyasada yeniden ilgi olduğunu gösteriyor.
- ETF Gelişmeleri: Canary Capital, spot HBAR ETF başvurusunda son aşamaya (kod: "HBR", %0,95 yönetim ücreti) yaklaştı; ancak ABD hükümetinin kapanması nedeniyle süreçte gecikme yaşanıyor.
- İşlem Hacmi Dalgalanmaları: 19.740.000 - 138.430.000 token aralığında işlem hacmi, yatırımcı ilgisini ve piyasa duyarlılığını yansıtıyor.
II. HBAR’ın Yatırım Değerini Etkileyen Temel Faktörler
Arz Mekanizması (Tokenomik)
- HBAR: Fayda odaklı token modeline sahip HBAR, ağ işlemlerinin yakıtı olarak kullanılır ve değeri doğrudan ağın kullanımı ile benimsenmesine bağlıdır.
- 📌 Tarihsel Model: HBAR fiyat hareketleri, kurumsal benimseme duyuruları ve ağ kullanım metrikleriyle paralel ilerlemiştir.
Kurumsal Benimseme ve Piyasa Uygulamaları
- Kurumsal Varlıklar: Grayscale’in HBAR’ı fonuna eklemesiyle kurumsal ilgi artıyor.
- Kurumsal Kullanım: HBAR, finansal mutabakat ve kurumsal çözümlerde sınır ötesi ödeme altyapısında yaygınlaşıyor.
- Düzenleyici Tutum: HBAR ETF’leri, düzenleyici netliğin arttığını gösteriyor; ancak ABD hükümetinin kapanması süreci yavaşlatıyor.
Teknik Gelişmeler ve Ekosistem Gelişimi
- HBAR Teknik Yükseltmeleri: NVIDIA Blackwell platformunda EQTY Lab tarafından Doğrulanabilir Hesaplama özellikleri geliştiriliyor.
- Ekosistem Karşılaştırması: HBAR, kurumsal blokzincir çözümlerinde özellikle ödeme altyapısı ve finans uygulamalarında güçlü bir konuma sahip.
- Proje İnisiyatifleri: Avustralya Merkez Bankası ve Digital Finance CRC’nin Project Acacia çalışması, Hedera üzerinde dijital para birimlerinin birlikte çalışabilirliğini araştırıyor.
Makroekonomik ve Piyasa Döngüleri
- Enflasyonist Ortamlarda Performans: HBAR’ın fayda odaklı yapısı ve kurumsal benimsenmesi, dalgalı dönemlerde görece daha istikrarlı olmasını sağlıyor.
- Para Politikası Etkisi: HBAR fiyatları, genel kripto piyasası ve geleneksel hisse senedi piyasalarındaki değişimlere duyarlı biçimde hareket ediyor.
- Jeopolitik Faktörler: Sınır ötesi ödeme çözümlerine artan ilgi, HBAR’ın altyapı kapasitesine uluslararası düzeyde potansiyel talep oluşturuyor.
III. 2025-2030 Fiyat Tahmini: TONC ve HBAR
Kısa Vadeli Tahmin (2025)
- TONC: Temkinli $0,01342752 - $0,013987 | İyimser $0,013987 - $0,01706414
- HBAR: Temkinli $0,141911 - $0,1843 | İyimser $0,1843 - $0,235904
Orta Vadeli Tahmin (2027)
- TONC, büyüme fazına girebilir; tahmini fiyat aralığı: $0,008635322034 - $0,022547785311
- HBAR, yükseliş piyasasına girebilir; tahmini fiyat aralığı: $0,1422600642 - $0,3171699792
- Başlıca etkenler: Kurumsal sermaye akışı, ETF ve ekosistem gelişimi
Uzun Vadeli Tahmin (2030)
- TONC: Temel senaryo $0,025327911248509 - $0,031659889060636 | İyimser senaryo $0,031659889060636+
- HBAR: Temel senaryo $0,3236253211296 - $0,462784209215328 | İyimser senaryo $0,462784209215328+
Yasal Uyarı: Bu analiz, geçmiş veriler ve piyasa projeksiyonlarına dayalıdır. Kripto para piyasası yüksek volatiliteye ve belirsizliğe sahiptir. Bu bilgiler yatırım tavsiyesi olarak değerlendirilmemelidir. Lütfen yatırım kararı öncesinde kapsamlı araştırma yapınız.
TONC:
| Yıl | Tahmini En Yüksek Fiyat | Tahmini Ortalama Fiyat | Tahmini En Düşük Fiyat | Getiri Oranı (%) |
|---|---|---|---|---|
| 2025 | 0,01706414 | 0,013987 | 0,01342752 | 0 |
| 2026 | 0,0164571042 | 0,01552557 | 0,0083838078 | 10 |
| 2027 | 0,022547785311 | 0,0159913371 | 0,008635322034 | 14 |
| 2028 | 0,02158190855016 | 0,0192695612055 | 0,010212867438915 | 37 |
| 2029 | 0,030230087619188 | 0,02042573487783 | 0,014298014414481 | 46 |
| 2030 | 0,031659889060636 | 0,025327911248509 | 0,014690188524135 | 81 |
HBAR:
| Yıl | Tahmini En Yüksek Fiyat | Tahmini Ortalama Fiyat | Tahmini En Düşük Fiyat | Getiri Oranı (%) |
|---|---|---|---|---|
| 2025 | 0,235904 | 0,1843 | 0,141911 | 0 |
| 2026 | 0,25632444 | 0,210102 | 0,11765712 | 13 |
| 2027 | 0,3171699792 | 0,23321322 | 0,1422600642 | 25 |
| 2028 | 0,30271075956 | 0,2751915996 | 0,22015327968 | 48 |
| 2029 | 0,3582994626792 | 0,28895117958 | 0,1762602195438 | 55 |
| 2030 | 0,462784209215328 | 0,3236253211296 | 0,252427750481088 | 74 |
IV. Yatırım Stratejisi Karşılaştırması: TONC ve HBAR
Uzun Vadeli ve Kısa Vadeli Yatırım Stratejileri
- TONC: Merkeziyetsiz blokzincir ağlarının ve ekosistem büyümesinin potansiyeline odaklanan yatırımcılar için uygundur.
- HBAR: Kurumsal çözümler ve sınır ötesi ödeme altyapısına ilgi duyan yatırımcılar için uygundur.
Risk Yönetimi ve Varlık Dağılımı
- Temkinli yatırımcılar için: TONC %30 - HBAR %70
- Daha agresif yatırımcılar için: TONC %60 - HBAR %40
- Korumacı araçlar: Stablecoin tahsisi, opsiyon işlemleri, döviz çeşitlendirmesi
V. Olası Risk Karşılaştırması
Piyasa Riski
- TONC: Düşük piyasa değeri ve işlem hacmi nedeniyle daha yüksek volatiliteye sahiptir.
- HBAR: Kurumsal benimseme oranları ve ödeme altyapısı alanındaki rekabetten etkilenebilir.
Teknik Risk
- TONC: Ölçeklenebilirlik ve ağ istikrarı riskleri taşır.
- HBAR: Hashgraph teknolojisinin benimsenmesi ve yeni konsensüs mekanizmasındaki olası açıklar.
Düzenleyici Risk
- Küresel regülasyonlar TONC ve HBAR üzerinde farklı etkiler yaratabilir; HBAR kurumsal odağı nedeniyle daha fazla denetime tabi olabilir.
VI. Sonuç: Hangisi Daha İyi Bir Alım?
📌 Yatırım Değeri Özeti:
- TONC avantajları: Merkeziyetsiz küresel blokzincir ağı, ekosistem büyüme potansiyeli.
- HBAR avantajları: Kurumsal benimseme, gelişmiş hashgraph teknolojisi, sınır ötesi ödeme kabiliyetleri.
✅ Yatırım Tavsiyesi:
- Yeni yatırımcılar: Güçlü kurumsal desteği nedeniyle HBAR ağırlıklı dengeli bir portföyü tercih edin.
- Deneyimli yatırımcılar: Risk toleransına göre TONC ve HBAR’ın birlikte yer aldığı çeşitlendirilmiş portföyü değerlendirin.
- Kurumsal yatırımcılar: Kurumsal çözümler ve sınır ötesi ödeme potansiyeli nedeniyle HBAR’a odaklanın.
⚠️ Risk Uyarısı: Kripto para piyasası yüksek volatiliteye sahiptir. Bu içerik yatırım tavsiyesi değildir. None
VII. Sıkça Sorulan Sorular
S1: TONC ve HBAR arasındaki temel farklar nelerdir? C: TONC merkeziyetsiz küresel blokzincir ağı iken, HBAR kurumsal çözümler için hashgraph teknolojisini kullanır. HBAR, daha fazla kurumsal benimseme ve sınır ötesi ödemelere odaklanırken; TONC, ekosistem gelişimi açısından potansiyel sunar.
S2: Fiyat performansı açısından tarihsel olarak hangisi daha önde? C: HBAR daha yüksek fiyat dalgalanmaları göstermiştir. Tüm zamanların en yüksek seviyesi $0,569229 ile 15 Eylül 2021’de, TONC’un ise $0,104949 ile 03 Eylül 2020’de gerçekleşmiştir.
S3: TONC ve HBAR’ın güncel piyasa durumları nasıl karşılaştırılır? C: 13 Ekim 2025 itibarıyla TONC’un fiyatı $0,013989 ve 24 saatlik işlem hacmi $12.460,51; HBAR’ın fiyatı $0,18527 ve hacmi $13.195.836,33’tür. HBAR, çok daha yüksek likidite ve piyasa hareketliliği sergilemektedir.
S4: HBAR’ın yatırım değerini etkileyen ana faktörler nelerdir? C: Gelişmiş hashgraph teknolojisi, kurumsal ortaklıklar, sınır ötesi ödeme uygulamalarında artan benimseme ve ETF gelişmeleri başlıca faktörlerdir. HBAR’ın fayda odaklı token modeli ve teknik yükseltmeleri de değerini artırır.
S5: TONC ve HBAR için uzun vadeli fiyat tahminleri nasıl karşılaştırılır? C: 2030 için; TONC temel senaryosu $0,025327911248509 - $0,031659889060636, HBAR ise $0,3236253211296 - $0,462784209215328 aralığında öngörülmektedir. HBAR’ın potansiyel fiyat aralığı daha yüksektir.
S6: TONC ve HBAR yatırımlarında temel riskler nelerdir? C: TONC, düşük piyasa değeri ve hacmiyle volatilite ve ölçeklenebilirlik riskleri taşır. HBAR ise kurumsal benimseme oranlarına ve yeni konsensüs mekanizmasındaki olası zafiyetlere bağlıdır. Her ikisi de düzenleyici risklere açıktır; HBAR kurumsal yönüyle daha fazla denetime tabi olabilir.
S7: Yatırımcı tipleri TONC ve HBAR yatırımlarına nasıl yaklaşmalı? C: Yeni yatırımcılar, güçlü kurumsal desteği nedeniyle HBAR ağırlıklı dengeli yaklaşımı düşünebilir. Deneyimli yatırımcılar, her iki varlığı içeren çeşitlendirilmiş portföy oluşturabilir. Kurumsal yatırımcılar ise kurumsal çözümler ve sınır ötesi ödeme potansiyeliyle HBAR’a odaklanmalıdır.
Share
Content
Giriş: TONC ve HBAR Yatırım Karşılaştırması
I. Fiyat Geçmişi Karşılaştırması ve Mevcut Piyasa Durumu
I. HBAR Temel Analizi
II. HBAR’ın Yatırım Değerini Etkileyen Temel Faktörler
III. 2025-2030 Fiyat Tahmini: TONC ve HBAR
IV. Yatırım Stratejisi Karşılaştırması: TONC ve HBAR
V. Olası Risk Karşılaştırması
VI. Sonuç: Hangisi Daha İyi Bir Alım?
VII. Sıkça Sorulan Sorular
How to Buy Cryptocurrency


Trending Cryptocurrencies


Wirex Pay (WPAY) iyi bir yatırım mı?: Bu Kripto Ödeme Token’ının potansiyelini ve risklerini inceliyoruz

PundiX (PUNDIX) iyi bir yatırım mı?: Bu blokzincir tabanlı ödeme çözümünün potansiyelini değerlendirmek

Request (REQ) iyi bir yatırım mı?: Bu blockchain ödeme protokolü tokeninin potansiyelini analiz etmek
Request (REQ) iyi bir yatırım mı?: Bu merkeziyetsiz ödeme protokolü tokenının potansiyelini analiz ediyoruz

SoPay (SOP) iyi bir yatırım mı?: Bu dijital ödeme tokeninin potansiyeli ve riskleri üzerine analiz
IVPAY ve AVAX: İki Yükselen Blockchain Platformunun Karşılaştırmalı Analizi

TWT ve GRT: İki Lider Dijital Varlık Platformunun Detaylı Karşılaştırması

Merkeziyetsiz finans dünyasında Flash Loan'ların sunduğu avantajları incelemek
Metaverse Token Fiyat Analizi ve Yatırım Görünümü: MANA ve SAND gibi Liderlerin Son Gelişmeleri

2026 ETH Fiyat Görünümü | Döngüler, Ana Destek & Direnç ve Potansiyel Yatırım Stratejileri

Zincir Üstü Nakit Yönetimi Devrimi: JPMorgan’ın Ethereum Üzerindeki Tokenlaştırılmış Para Pazar Fonu MONY Üzerine Derinlemesine Bir Analiz
