TMAI vs SNX: Comparing Two AI-Driven Trading Platforms for Crypto Markets
Introduction: TMAI vs SNX Investment Comparison
In the cryptocurrency market, the comparison between Token Metrics AI (TMAI) vs Synthetix (SNX) has been an unavoidable topic for investors. The two not only show significant differences in market cap ranking, application scenarios, and price performance but also represent different positioning in the crypto asset space.
Token Metrics AI (TMAI): Launched in 2024, it has gained market recognition for its AI-powered trading tools and insights for the crypto community.
Synthetix (SNX): Since its introduction in 2018, it has been hailed as a platform for creating synthetic assets, becoming one of the pioneering projects in the decentralized finance (DeFi) space.
This article will provide a comprehensive analysis of the investment value comparison between TMAI and SNX, focusing on historical price trends, supply mechanisms, institutional adoption, technological ecosystems, and future predictions, aiming to answer the question most concerning to investors:
"Which is the better buy right now?"
I. Price History Comparison and Current Market Status
TMAI and SNX Historical Price Trends
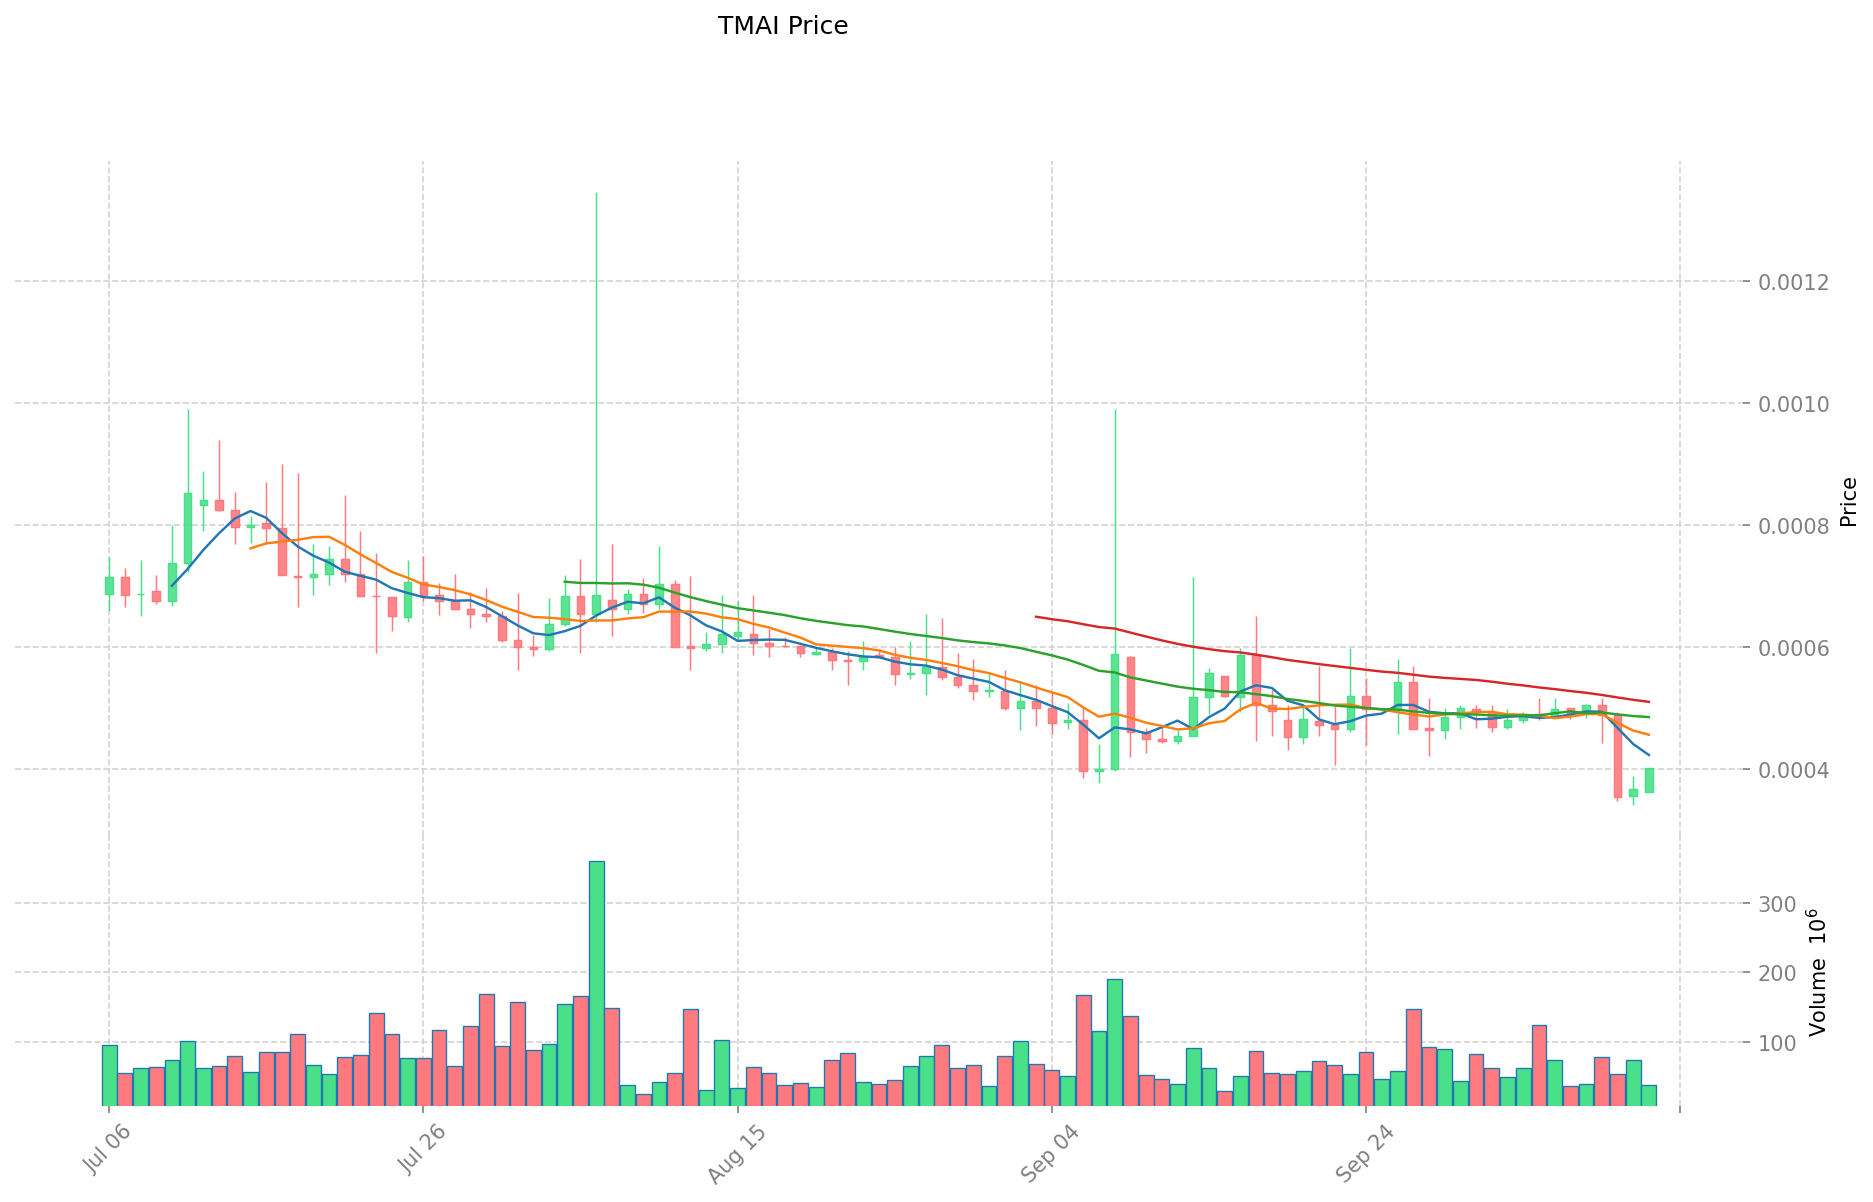
- 2024: TMAI reached its all-time high of $0.017747 due to increased adoption of AI-powered trading tools.
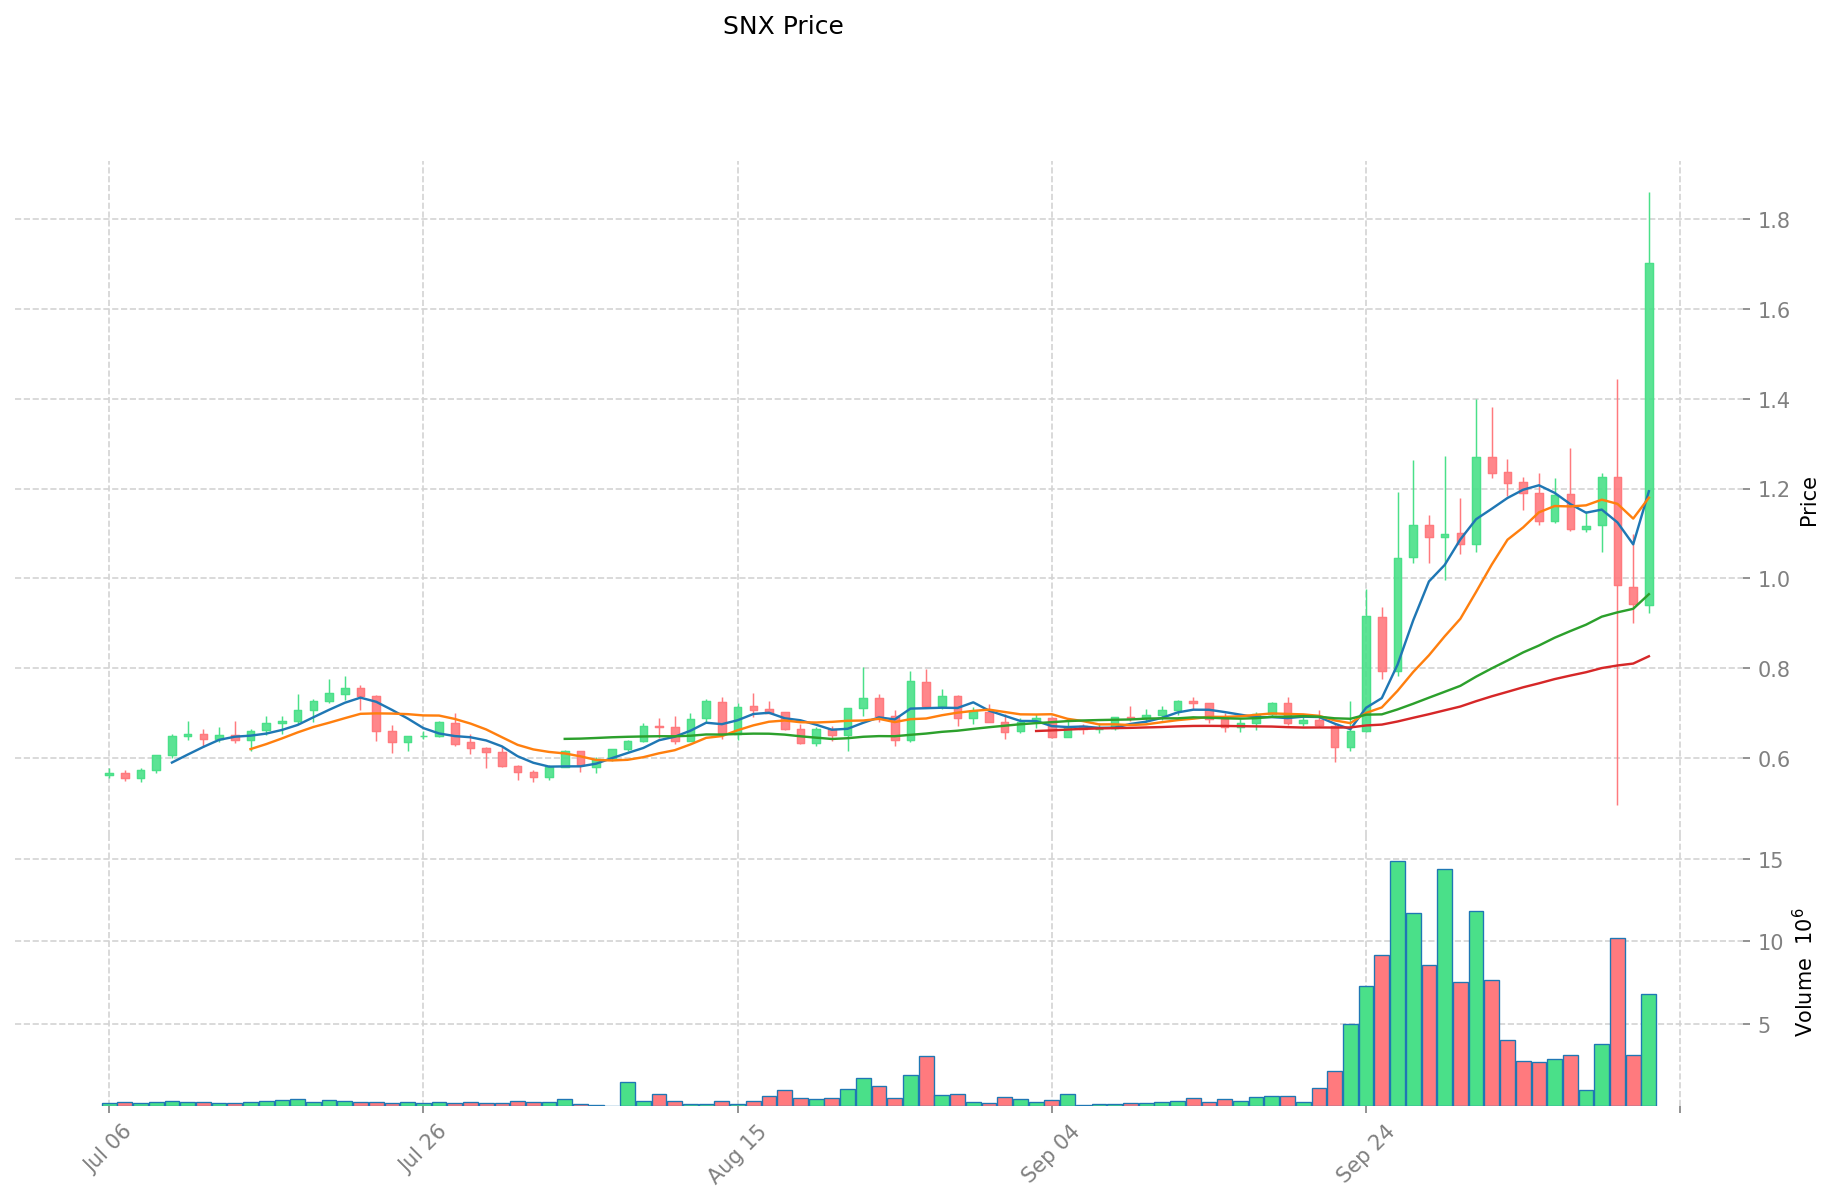
- 2021: SNX hit its all-time high of $28.53 during the DeFi boom in February.
- Comparative analysis: In the recent market cycle, TMAI dropped from $0.017747 to a low of $0.0003403, while SNX declined from $28.53 to a current price of $1.7002.
Current Market Situation (2025-10-13)
- TMAI current price: $0.0004014
- SNX current price: $1.7002
- 24-hour trading volume: $14,788.28 (TMAI) vs $9,979,479.33 (SNX)
- Market Sentiment Index (Fear & Greed Index): 38 (Fear)
Click to view real-time prices:
- View TMAI current price Market Price
- View SNX current price Market Price
II. Key Factors Affecting TMAI vs SNX Investment Value
Supply Mechanism Comparison (Tokenomics)
- TMAI: Technical innovation and market share are key investment drivers
- SNX: R&D investment and product competitiveness determine value
Institutional Adoption and Market Applications
- Institutional Holdings: Research indicates market demand directly impacts investment returns
- Enterprise Adoption: Competitive landscape significantly affects performance of both assets
- Regulatory Attitudes: Regulatory environments influence development trajectories
Technical Development and Ecosystem Building
- Core component procurement and cost management are essential factors
- Product portfolio strategy from high-end to low-end markets ensures sustainability
- Ecosystem Comparison: Strategic partnerships with telecommunications operators provide competitive advantages
Macroeconomic Factors and Market Cycles
- High-profit flagship products help maintain market position
- Comprehensive market coverage strategies impact long-term value
- Cross-border collaboration capabilities affect global market performance
III. 2025-2030 Price Predictions: TMAI vs SNX
Short-term Forecast (2025)
- TMAI: Conservative $0.00037694 - $0.000401 | Optimistic $0.000401 - $0.00056541
- SNX: Conservative $1.463044 - $1.7842 | Optimistic $1.7842 - $2.40867
Mid-term Forecast (2027)
- TMAI may enter a growth phase, with an estimated price range of $0.0004130919545 - $0.0006320804605
- SNX may enter a bullish market, with an estimated price range of $2.16090037625 - $3.16173844525
- Key drivers: Institutional capital inflow, ETFs, ecosystem development
Long-term Forecast (2030)
- TMAI: Base scenario $0.000556257155405 - $0.000806169790442 | Optimistic scenario $0.000806169790442 - $0.001048020727575
- SNX: Base scenario $2.70122917078424 - $3.508089832187325 | Optimistic scenario $3.508089832187325 - $3.613332527152944
Disclaimer: The above predictions are based on historical data and market analysis. Cryptocurrency markets are highly volatile and subject to change. This information should not be considered as financial advice. Always conduct your own research before making investment decisions.
TMAI:
| 年份 | 预测最高价 | 预测平均价格 | 预测最低价 | 涨跌幅 |
|---|---|---|---|---|
| 2025 | 0.00056541 | 0.000401 | 0.00037694 | 0 |
| 2026 | 0.0005121973 | 0.000483205 | 0.0003962281 | 20 |
| 2027 | 0.0006320804605 | 0.00049770115 | 0.0004130919545 | 23 |
| 2028 | 0.000819091667612 | 0.00056489080525 | 0.000502752816672 | 40 |
| 2029 | 0.000920348344453 | 0.000691991236431 | 0.000442874391316 | 72 |
| 2030 | 0.001048020727575 | 0.000806169790442 | 0.000556257155405 | 100 |
SNX:
| 年份 | 预测最高价 | 预测平均价格 | 预测最低价 | 涨跌幅 |
|---|---|---|---|---|
| 2025 | 2.40867 | 1.7842 | 1.463044 | 4 |
| 2026 | 2.45282895 | 2.096435 | 1.32075405 | 23 |
| 2027 | 3.16173844525 | 2.274631975 | 2.16090037625 | 33 |
| 2028 | 3.77827744207375 | 2.718185210125 | 2.41918483701125 | 59 |
| 2029 | 3.767948338275275 | 3.248231326099375 | 2.143832675225587 | 91 |
| 2030 | 3.613332527152944 | 3.508089832187325 | 2.70122917078424 | 106 |
IV. Investment Strategy Comparison: TMAI vs SNX
Long-term vs Short-term Investment Strategies
- TMAI: Suitable for investors focusing on AI-powered trading tools and market insights
- SNX: Suitable for investors interested in DeFi and synthetic assets
Risk Management and Asset Allocation
- Conservative investors: TMAI: 30% vs SNX: 70%
- Aggressive investors: TMAI: 60% vs SNX: 40%
- Hedging tools: Stablecoin allocation, options, cross-currency portfolios
V. Potential Risk Comparison
Market Risks
- TMAI: Volatility due to the nascent AI-powered trading tool market
- SNX: Exposure to DeFi market fluctuations and synthetic asset demand
Technical Risks
- TMAI: Scalability, network stability
- SNX: Smart contract vulnerabilities, oracle dependency
Regulatory Risks
- Global regulatory policies may have different impacts on AI-powered tools and DeFi platforms
VI. Conclusion: Which Is the Better Buy?
📌 Investment Value Summary:
- TMAI advantages: AI-powered trading insights, potential for rapid growth in a new market segment
- SNX advantages: Established presence in DeFi, diverse synthetic asset offerings
✅ Investment Advice:
- New investors: Consider a balanced approach, leaning towards SNX for its established market presence
- Experienced investors: Explore opportunities in both, with a higher allocation to TMAI for potential growth
- Institutional investors: Conduct thorough due diligence on both projects, considering TMAI for innovation exposure and SNX for DeFi sector representation
⚠️ Risk Warning: The cryptocurrency market is highly volatile. This article does not constitute investment advice. None
VII. FAQ
Q1: What are the main differences between TMAI and SNX? A: TMAI is focused on AI-powered trading tools and insights for the crypto community, launched in 2024. SNX is a platform for creating synthetic assets in the DeFi space, introduced in 2018.
Q2: Which asset has shown better price performance recently? A: Based on the current market data, SNX has shown better price performance. As of 2025-10-13, SNX is trading at $1.7002, while TMAI is at $0.0004014.
Q3: What are the key factors affecting the investment value of TMAI and SNX? A: Key factors include supply mechanisms, institutional adoption, market applications, technical development, ecosystem building, and macroeconomic factors.
Q4: What are the price predictions for TMAI and SNX by 2030? A: For TMAI, the base scenario predicts $0.000556257155405 - $0.000806169790442. For SNX, the base scenario predicts $2.70122917078424 - $3.508089832187325.
Q5: How should investors allocate their assets between TMAI and SNX? A: Conservative investors might consider 30% TMAI and 70% SNX, while aggressive investors might opt for 60% TMAI and 40% SNX.
Q6: What are the main risks associated with investing in TMAI and SNX? A: Risks include market volatility, technical issues such as scalability and smart contract vulnerabilities, and potential regulatory challenges.
Q7: Which asset is recommended for new investors? A: New investors might consider a balanced approach, leaning towards SNX for its established market presence in the DeFi sector.
Share
Content