THL vs DOT: Comparing Two Leading Approaches to Blockchain Scalability
Introduction: THL vs DOT Investment Comparison
In the cryptocurrency market, the comparison between Thala (THL) vs Polkadot (DOT) has always been a topic that investors can't avoid. The two not only have significant differences in market cap ranking, application scenarios, and price performance, but also represent different cryptocurrency asset positions.
Thala (THL): Since its launch, it has gained market recognition for its position as a DeFi Hyper App and Liquidity Engine on Aptos.
Polkadot (DOT): Since its inception in 2020, it has been hailed as an interoperability protocol connecting different blockchains, and is one of the cryptocurrencies with the highest global trading volume and market capitalization.
This article will comprehensively analyze the investment value comparison between THL and DOT, focusing on historical price trends, supply mechanisms, institutional adoption, technological ecosystems, and future predictions, and attempt to answer the question that investors are most concerned about:
"Which is the better buy right now?" I. Price History Comparison and Current Market Status
THL and DOT Historical Price Trends
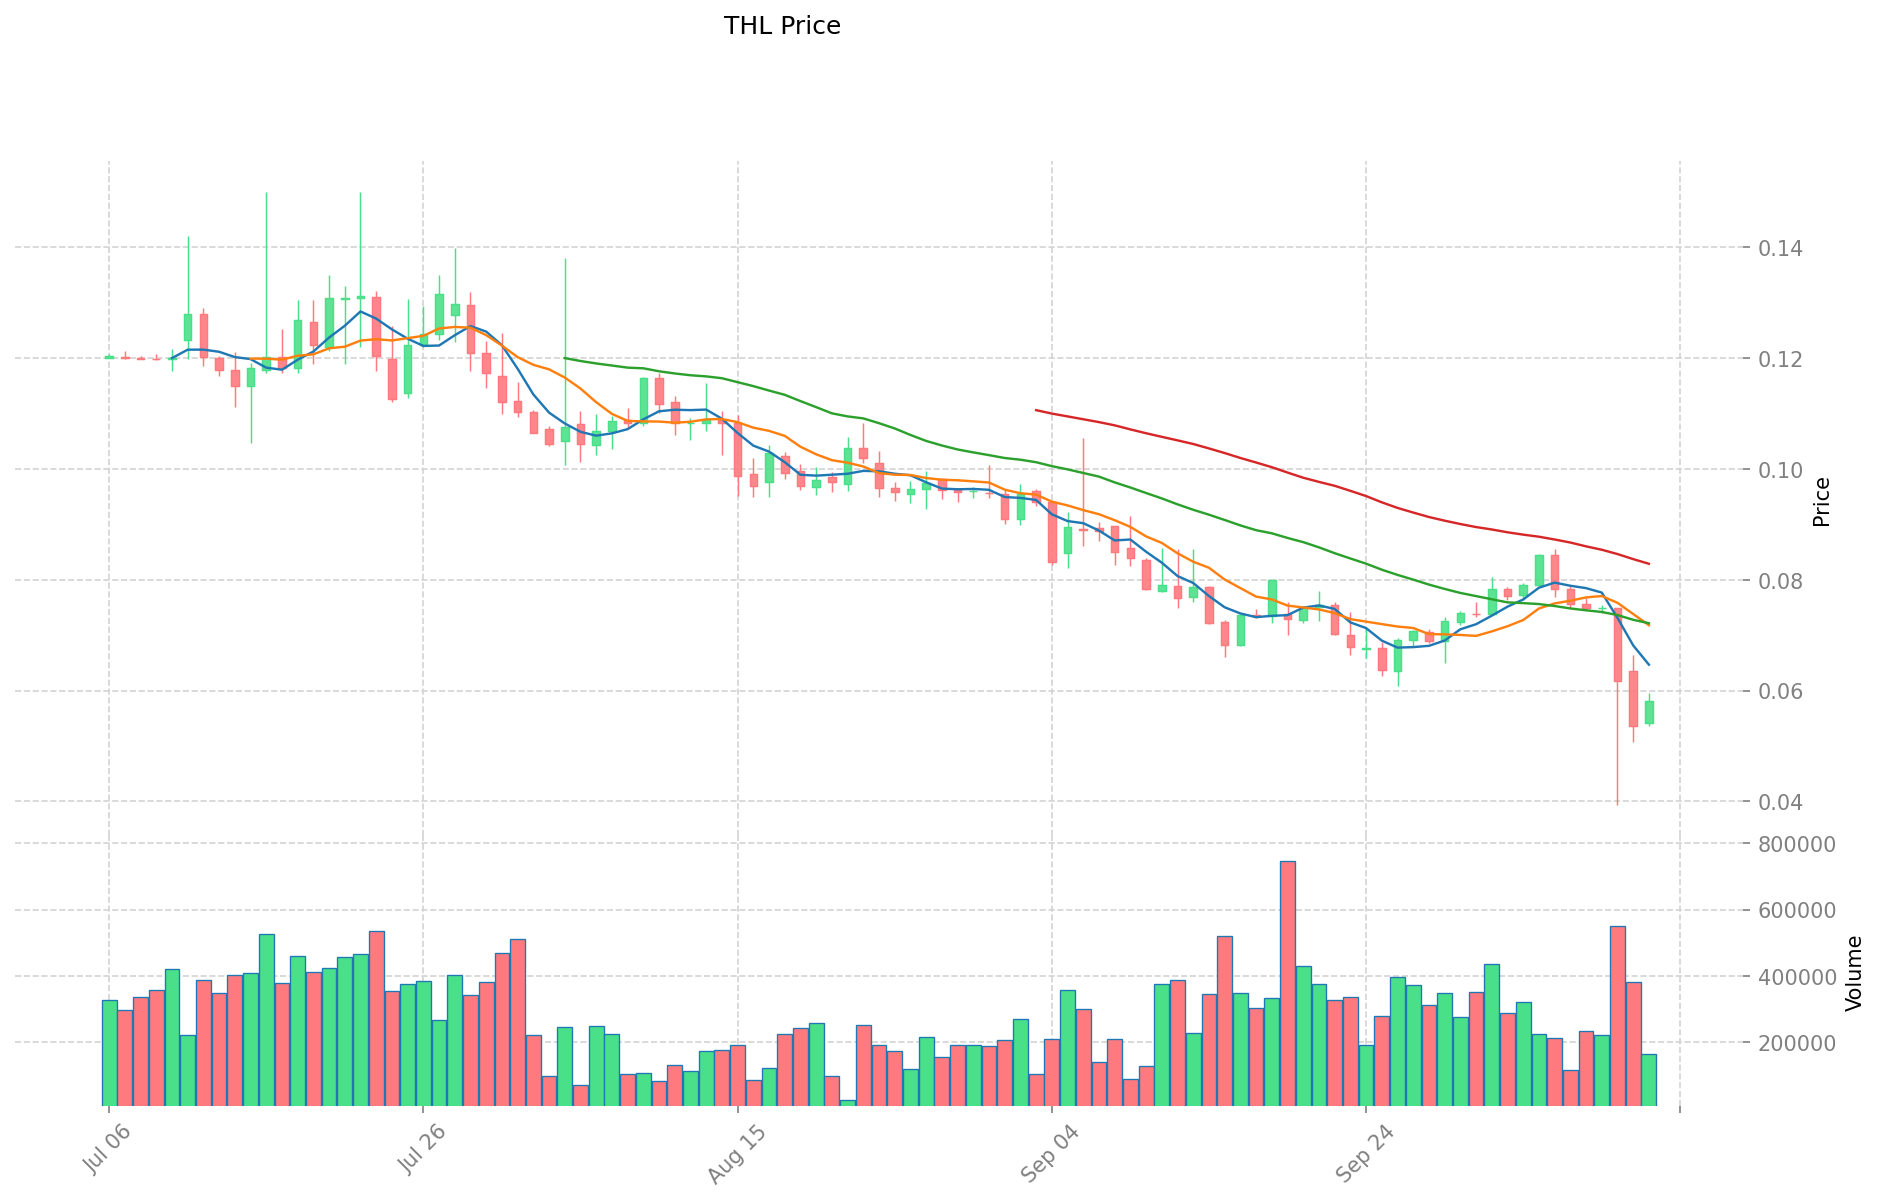
- 2024: THL reached its all-time high of $3.3333 on March 20, 2024, likely due to significant ecosystem developments.
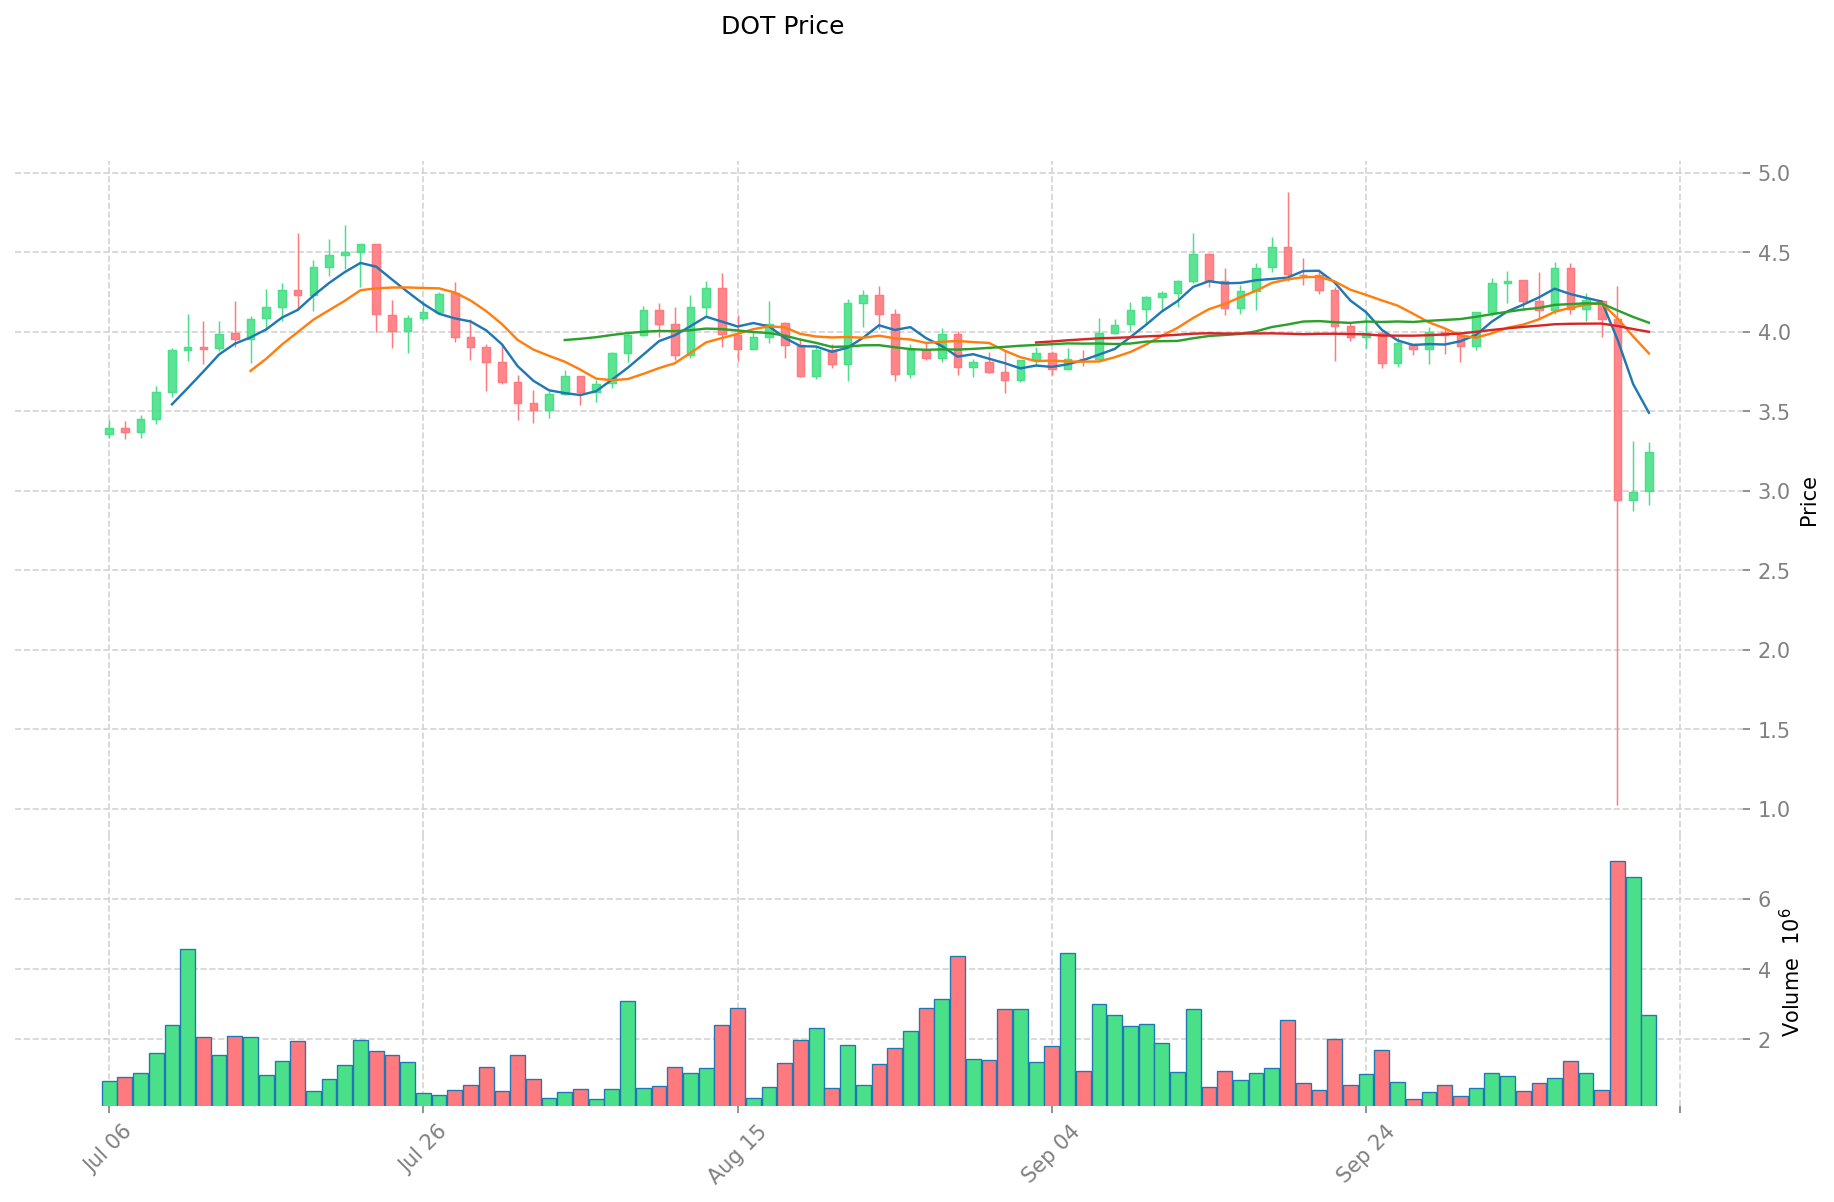
- 2021: DOT hit its all-time high of $54.98 on November 4, 2021, influenced by the overall crypto bull market.
- Comparative Analysis: In the recent market cycle, THL dropped from its high of $3.3333 to a low of $0.03928, while DOT declined from $54.98 to $2.13, showing both experienced significant corrections.
Current Market Situation (2025-10-13)
- THL current price: $0.05828
- DOT current price: $3.252
- 24-hour trading volume: THL $9,856.92 vs DOT $8,269,050.44
- Market Sentiment Index (Fear & Greed Index): 24 (Extreme Fear)
Click to view real-time prices:
- Check THL current price Market Price
- Check DOT current price Market Price
II. Core Factors Affecting THL vs DOT Investment Value
Supply Mechanism Comparison (Tokenomics)
- DOT: DOT has a good yield rate according to market evaluations
Institutional Adoption and Market Applications
- Enterprise Adoption: XRP in Ripple's partnership with Chipper Cash plays a central role in enhancing cross-border payments to Africa, utilizing Ripple's payment solutions for faster and more cost-effective transactions
Technical Development and Ecosystem Building
- DOT Technical Development: Continuous technological innovation driving Polkadot ecosystem development
- Ecosystem Comparison: Solana ecosystem TVL has exceeded $3.8 billion, increasing over 100% in a month, currently ranking after ETH, TRON, and BSC
Macroeconomic and Market Cycles
- Market Predictions: DOT price predictions are regularly adjusted based on current market conditions
- Investment Considerations: Advanced machine learning price predictions help users measure crypto market trends before investing
III. Price Prediction for 2025-2030: THL vs DOT
Short-term Prediction (2025)
- THL: Conservative $0.0431 - $0.0583 | Optimistic $0.0583 - $0.0827
- DOT: Conservative $3.01 - $3.24 | Optimistic $3.24 - $4.53
Mid-term Prediction (2027)
- THL may enter a growth phase, with prices expected in the range of $0.0574 - $0.0842
- DOT may enter a bullish market, with prices expected in the range of $2.61 - $5.64
- Key drivers: Institutional capital inflow, ETF developments, ecosystem growth
Long-term Prediction (2030)
- THL: Base scenario $0.0822 - $0.1054 | Optimistic scenario $0.1054 - $0.1191
- DOT: Base scenario $3.58 - $6.28 | Optimistic scenario $6.28 - $7.67
Disclaimer: The above predictions are based on historical data and market analysis. Cryptocurrency markets are highly volatile and subject to rapid changes. These projections should not be considered as financial advice. Always conduct your own research before making investment decisions.
THL:
| 年份 | 预测最高价 | 预测平均价格 | 预测最低价 | 涨跌幅 |
|---|---|---|---|---|
| 2025 | 0.0827434 | 0.05827 | 0.0431198 | 0 |
| 2026 | 0.074737102 | 0.0705067 | 0.064866164 | 21 |
| 2027 | 0.08424140516 | 0.072621901 | 0.05737130179 | 24 |
| 2028 | 0.109804314312 | 0.07843165308 | 0.0447060422556 | 34 |
| 2029 | 0.11670629978304 | 0.094117983696 | 0.05458843054368 | 61 |
| 2030 | 0.119115720165657 | 0.10541214173952 | 0.082221470556825 | 80 |
DOT:
| 年份 | 预测最高价 | 预测平均价格 | 预测最低价 | 涨跌幅 |
|---|---|---|---|---|
| 2025 | 4.5318 | 3.237 | 3.01041 | 0 |
| 2026 | 4.66128 | 3.8844 | 2.71908 | 20 |
| 2027 | 5.6401488 | 4.27284 | 2.6064324 | 32 |
| 2028 | 7.18691688 | 4.9564944 | 3.46954608 | 53 |
| 2029 | 6.4967250348 | 6.07170564 | 4.6752133428 | 87 |
| 2030 | 7.666742711628 | 6.2842153374 | 3.582002742318 | 94 |
IV. Investment Strategy Comparison: THL vs DOT
Long-term vs Short-term Investment Strategies
- THL: Suitable for investors focused on DeFi applications and ecosystem potential
- DOT: Suitable for investors seeking interoperability solutions and established networks
Risk Management and Asset Allocation
- Conservative investors: THL: 20% vs DOT: 80%
- Aggressive investors: THL: 40% vs DOT: 60%
- Hedging tools: Stablecoin allocation, options, cross-currency portfolios
V. Potential Risk Comparison
Market Risks
- THL: Higher volatility due to smaller market cap and newer project status
- DOT: Susceptible to overall crypto market trends and competitor developments
Technical Risks
- THL: Scalability, network stability on Aptos blockchain
- DOT: Parachain auction dynamics, interoperability challenges
Regulatory Risks
- Global regulatory policies may impact both, with DOT potentially facing more scrutiny due to its larger market presence
VI. Conclusion: Which Is the Better Buy?
📌 Investment Value Summary:
- THL advantages: Emerging DeFi platform on Aptos, potential for high growth
- DOT advantages: Established ecosystem, interoperability focus, institutional adoption
✅ Investment Advice:
- New investors: Consider a smaller allocation to THL for higher risk/reward, larger allocation to DOT for stability
- Experienced investors: Balanced portfolio with both THL and DOT, adjusting based on risk tolerance
- Institutional investors: Focus on DOT for its established market position, consider THL for diversification
⚠️ Risk Warning: Cryptocurrency markets are highly volatile. This article does not constitute investment advice. None
VII. FAQ
Q1: What are the key differences between THL and DOT? A: THL is a DeFi Hyper App and Liquidity Engine on Aptos, while DOT is an interoperability protocol connecting different blockchains. THL has a smaller market cap and is newer, while DOT is more established with higher trading volume and market capitalization.
Q2: How do the current prices of THL and DOT compare to their all-time highs? A: As of 2025-10-13, THL is trading at $0.05828, down from its all-time high of $3.3333 on March 20, 2024. DOT is trading at $3.252, significantly below its all-time high of $54.98 reached on November 4, 2021.
Q3: What are the short-term price predictions for THL and DOT in 2025? A: For THL, the conservative estimate is $0.0431 - $0.0583, while the optimistic range is $0.0583 - $0.0827. For DOT, the conservative estimate is $3.01 - $3.24, and the optimistic range is $3.24 - $4.53.
Q4: How do the long-term price predictions for THL and DOT compare in 2030? A: By 2030, THL's base scenario is predicted at $0.0822 - $0.1054, with an optimistic scenario of $0.1054 - $0.1191. For DOT, the base scenario is $3.58 - $6.28, with an optimistic scenario of $6.28 - $7.67.
Q5: What are the main risk factors to consider when investing in THL and DOT? A: For THL, risks include higher volatility due to smaller market cap, and potential scalability and network stability issues on the Aptos blockchain. For DOT, risks involve susceptibility to overall crypto market trends, parachain auction dynamics, and potential regulatory scrutiny due to its larger market presence.
Q6: How might an investor allocate their portfolio between THL and DOT? A: Conservative investors might consider allocating 20% to THL and 80% to DOT, while more aggressive investors could opt for 40% THL and 60% DOT. The specific allocation should be based on individual risk tolerance and investment goals.
Q7: Which cryptocurrency might be more suitable for institutional investors? A: Institutional investors may want to focus more on DOT due to its established market position and ecosystem. However, they might also consider a smaller allocation to THL for diversification and potential high growth opportunities.