TCOM ve FIL: Kurumsal Veri Yönetiminde İki Lider Blockchain Depolama Çözümünün Karşılaştırılması

Giriş: TCOM ve FIL Yatırımı Karşılaştırması
Kripto para piyasasında TCOM ile FIL’in karşılaştırılması, yatırımcılar açısından daima göz ardı edilemeyecek bir başlık olmuştur. İki proje; piyasa değeri sıralaması, kullanım alanları ve fiyat performansları bakımından önemli farklılıklar taşırken, kripto varlık sınıflandırmasında da farklı pozisyonlara sahiptir.
TCOM (TCOM): Piyasaya sürüldüğünden beri, dünyanın ilk merkeziyetsiz IP yönetim protokolü olarak konumlanmasıyla piyasanın ilgisini çekmiştir.
Filecoin (FIL): 2017’de tanıtıldığından bu yana merkeziyetsiz depolama ağı olarak anılmakta olup, yüksek global işlem hacmi ve piyasa değeriyle öne çıkmaktadır.
Bu makalede, TCOM ve FIL yatırımlarının değerleri; geçmiş fiyat eğilimleri, arz mekanizmaları, kurumsal benimseme, teknolojik ekosistemler ve gelecek öngörüleriyle kapsamlı olarak analiz edilerek yatırımcıların en çok merak ettiği sorunun yanıtı aranacaktır:
"Şu anda hangisi daha iyi bir yatırım fırsatı sunuyor?"
I. Fiyat Geçmişi Karşılaştırması ve Güncel Piyasa Durumu
TCOM ve FIL Geçmiş Fiyat Eğilimleri
- 2021: FIL, kripto boğa piyasası etkisiyle $236,84 ile zirve yaptı.
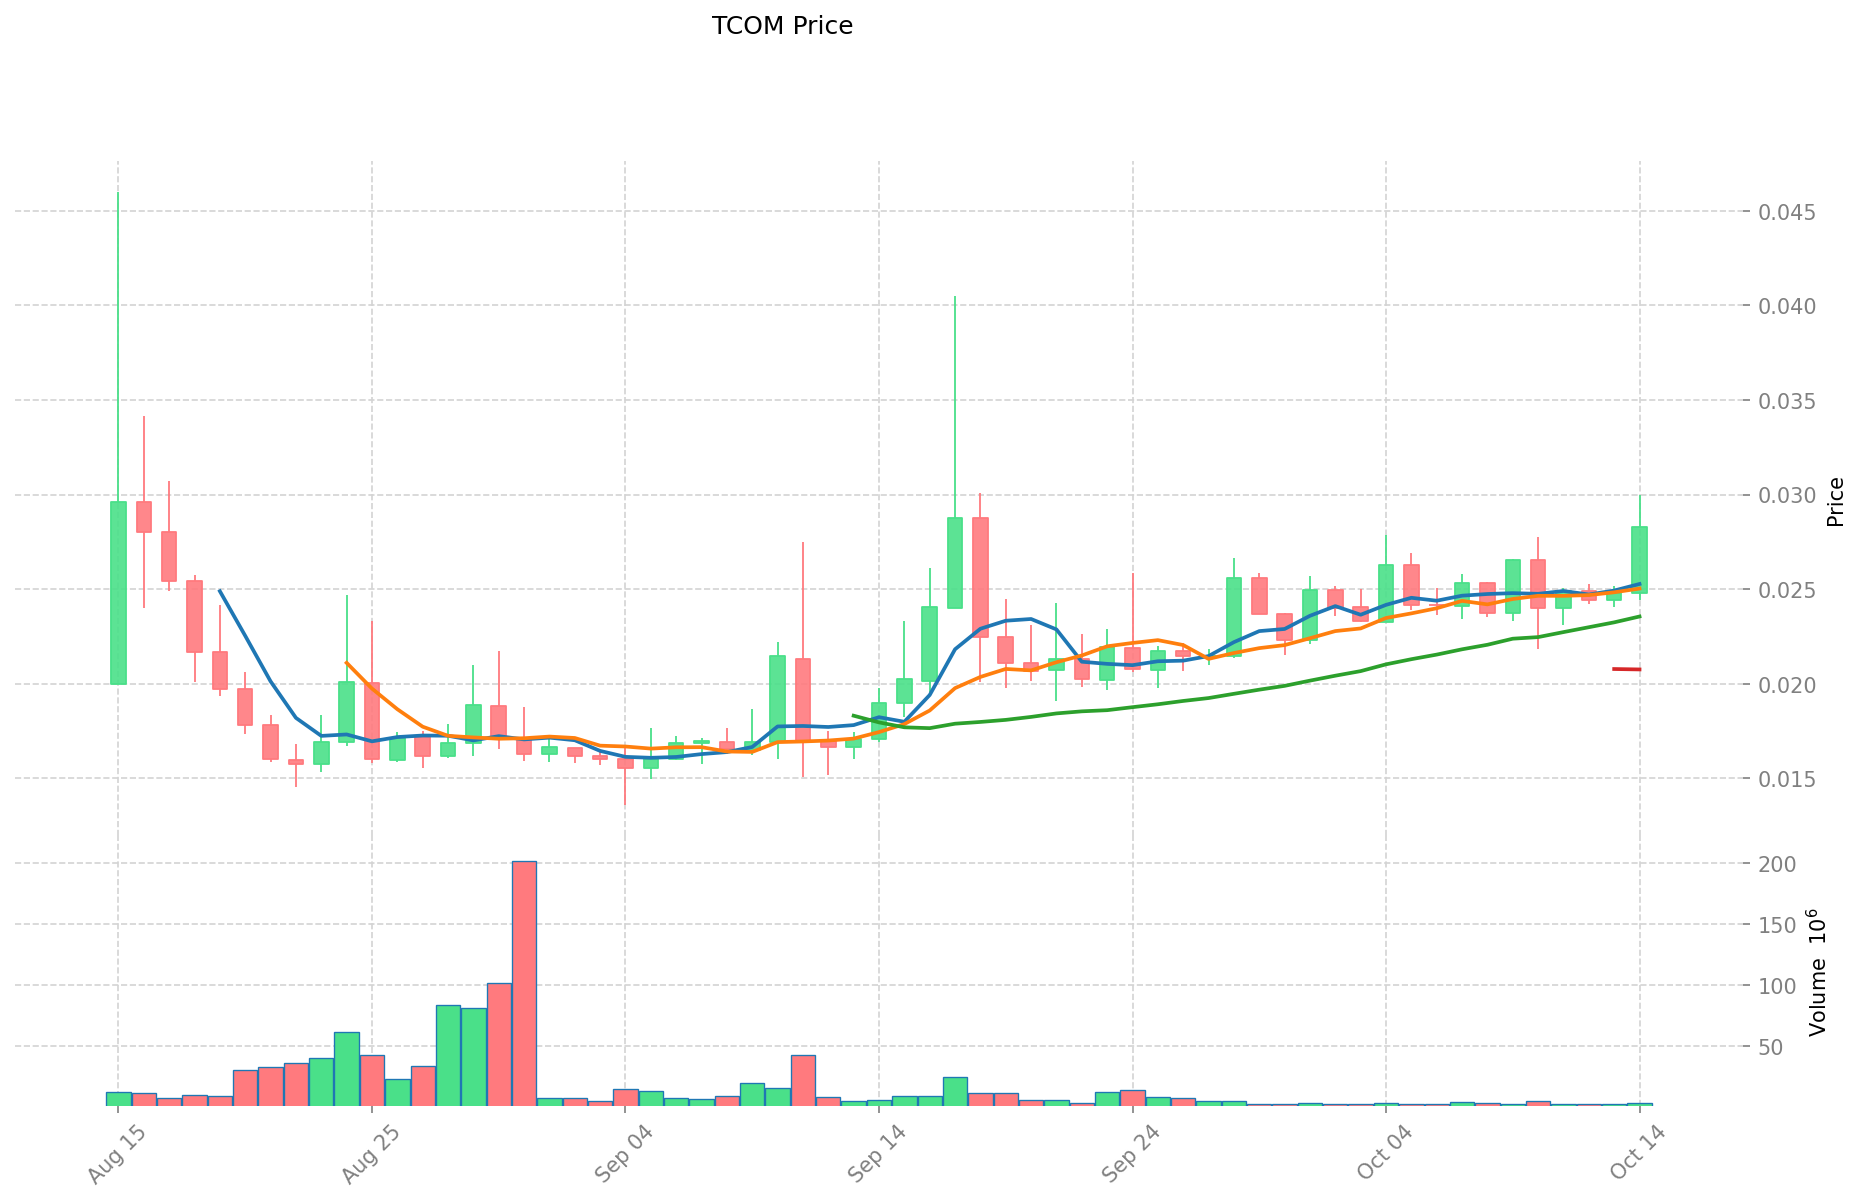
- 2025: TCOM, IP tabanlı tokenlara artan ilgiyle $0,046 ile tüm zamanların en yüksek değerine ulaştı.
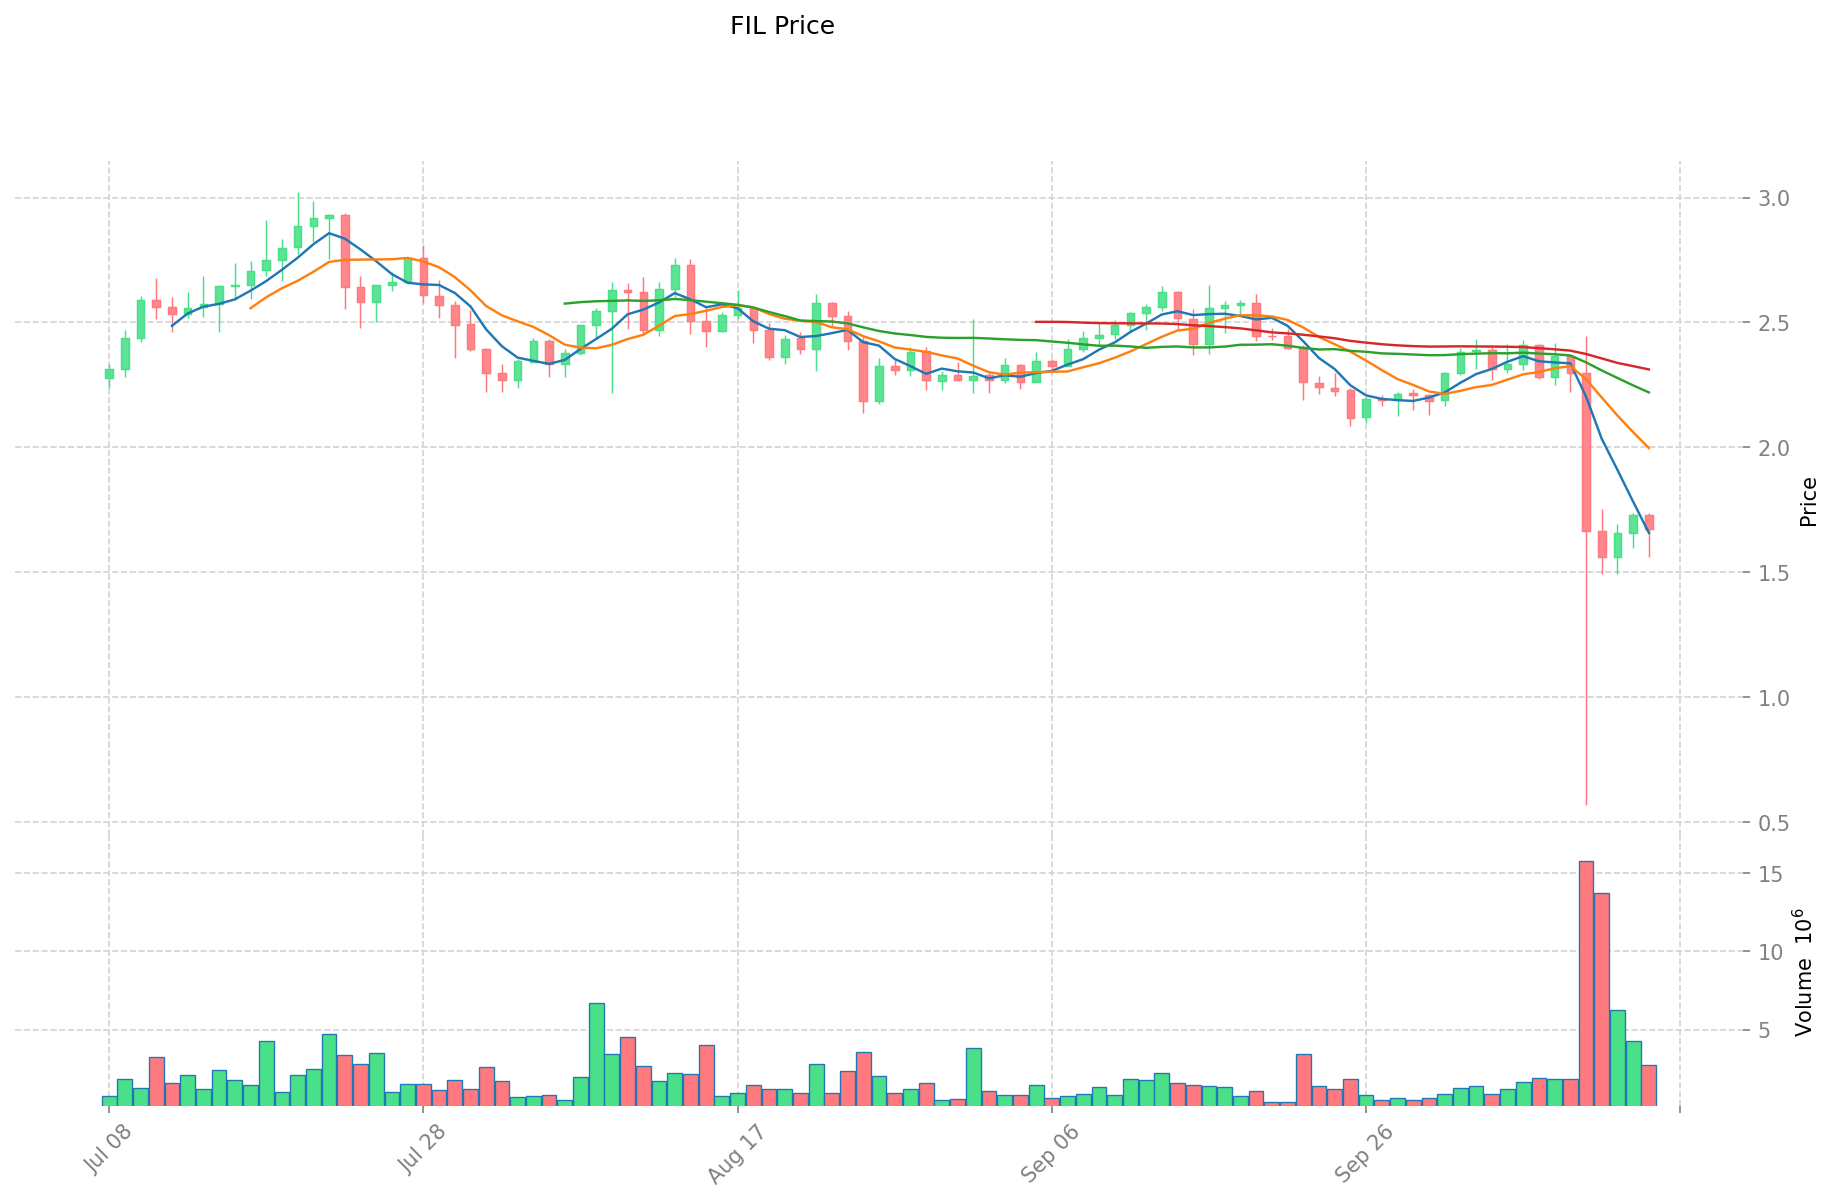
- Kıyaslama: Son piyasa döngüsünde TCOM $0,046’dan $0,01357’ye gerilerken, FIL $236,84’ten $0,848008’e düştü; bu da FIL’de daha sert bir düzeltmeye işaret ediyor.
Güncel Piyasa Durumu (15 Ekim 2025)
- TCOM güncel fiyatı: $0,02813
- FIL güncel fiyatı: $1,677
- 24 saatlik işlem hacmi: TCOM $94.118,68 - FIL $4.505.949,26
- Piyasa Duyarlılık Endeksi (Korku & Açgözlülük Endeksi): 38 (Korku)
Anlık fiyatları görüntülemek için tıklayın:
- TCOM güncel fiyatına bakın Piyasa Fiyatı
- FIL güncel fiyatına bakın Piyasa Fiyatı
Yatırım Değeri Analizi: TCOM ve FIL
I. TCOM ve FIL Yatırım Değerinde Temel Belirleyiciler
Yatırım Portföyü ve Varlık Dağılımı
- Fidelity’nin Yatırım Yaklaşımı: Fidelity International, piyasa koşulları, politik ortam ve ekonomik faktörleri dikkate alarak çeşitlendirilmiş yatırım stratejileriyle özenli varlık dağılımı sağlar.
- Portföy Yönetimi: Fidelity Retirement Master Trust belgelerine göre, varlık dağılımı piyasa, politik, yapısal ve ekonomik değişimlere göre önemli ölçüde değişir.
- Risk Yönetimi: Farklı risk profilleri, çeşitli coğrafi ve sektörel fon seçenekleriyle karşılanmaktadır.
Piyasa Performansı ve Ekonomik Ortam
- Küresel Piyasa Duyarlılığı: Fidelity Küresel Finansal Haftalık Raporu’na göre, faiz indirimi beklentileri ve yapay zeka hisselerinin güçlü finansal raporları küresel piyasalarda yukarı yönlü eğilimi destekliyor.
- Enflasyon Etkisi: Çekirdek enflasyon verileri beklentilere uygun gerçekleşerek hem TCOM hem de FIL için piyasa güvenini ve yatırım stratejilerini etkiliyor.
- Merkez Bankası Politikaları: Avrupa Merkez Bankası’nın politika faizini %2’de tutması piyasa beklentileriyle uyumlu; Fed’in ise faiz indirimi uygulaması bekleniyor.
Yatırım Uzmanlığı ve Yönetimi
- Profesyonel Yatırım Ekipleri: Fidelity, farklı yaklaşımlarla yatırım fırsatlarını değerlendiren uzman yatırımcılar istihdam etmektedir.
- Araştırma Kapasitesi: Fidelity’nin Eylül yatırım görünümüne göre, risk iştahındaki artış sürerken ABD hisselerinde nötr ağırlık korunuyor.
- Sürdürülebilirlik Odağı: Fidelity, ESG kriterlerini yatırım süreçlerine entegre ederek Sürdürülebilir Yatırım İlkeleri oluşturmuştur.
Bölgesel Yatırım Odağı
- Gelişmekte Olan Piyasalara Maruziyet: Fidelity Gelişmekte Olan Piyasalar Fonu’nda varlıkların en az %70’i Latin Amerika, Güneydoğu Asya, Afrika, Doğu Avrupa ve Orta Doğu’daki hızlı büyüyen şirketlere yatırılmaktadır.
- Sektörel Performans Farklılıkları: Bilgi teknolojileri ve kamu hizmetleri en yüksek getirileri sağlarken, sağlık ve zorunlu tüketim sektörleri negatif getiri gösterdi.
- Yatırım Stili Trendleri: Büyüme hisseleri değer hisselerinden, büyük ölçekli hisseler de küçük ve orta ölçeklilerden daha iyi performans gösterdi.
Ücret Yapısı ve Maliyet Yönetimi
- Ücretin Performansa Etkisi: Fidelity Retirement Master Trust’ın MPF Muhafazakar Fonu’nun birim fiyatı/net varlık değeri/fon getirisi, ücret etkilerini halihazırda yansıtmaktadır.
- Dağıtım Ücretleri: Bazı fonlar yıllık %1 dağıtım ücreti alabilir; bu durum yatırımcı maliyetini artırabilir.
- Ertelenmiş Satış Ücretleri: Bazı fon sınıflarında, elde tutma süresine göre değişen (%3 ilk yıl, %2 ikinci yıl, %1 üçüncü yıl, 3 yıl sonrası %0) ertelenmiş satış ücreti uygulanabilir.
II. Gelecek Görünümü ve Yatırımda Dikkat Edilecekler
Piyasa Beklentileri
- Faiz Oranı Ortamı: Piyasalar, Fed’in Eylül ayı itibarıyla faiz indirimi uygulamasını ve vadeli piyasalarda bu ihtimalin %95’e fiyatlandığını öngörüyor.
- Ekonomik Büyüme Beklentileri: Avrupa Merkez Bankası, bölgeye dair GSYİH büyüme tahminini yükseltti; bu da Avrupa piyasalarında iyileşme potansiyeline işaret ediyor.
- Enflasyon Eğilimi: Hizmet sektöründe enflasyon ivmesi yavaşlarken, süper çekirdek enflasyon (gıda, enerji, konut hariç) da geriliyor.
Risk Değerlendirmesi
- Portföy Riski: Farklı yatırım stratejileri değişen risk seviyeleri taşır; yatırımcılar risk toleranslarına uygun seçenekleri tercih etmelidir.
- Döviz Riski: Yabancı para cinsi varlıklara yapılan yatırımlar, TWD bazlı yatırımcılar için kur riski oluşturur.
- Kredi Riski: Yüksek getirili tahvil yatırımları, yatırım yapılabilir seviyenin altındaki ya da derecelendirilmemiş varlıklarda kredi riski taşır.
Temettü ve Gelir Stratejileri
- Kaliteli Temettüler: Fidelity, yatırımcıların yalnızca yüksek temettü aramak yerine, kaliteli ve sürdürülebilir temettü veren şirketlere odaklanmasını önerir.
- Gelir Dağıtımı: Aylık dağıtım yapan pay sınıfları; fon geliri, sermaye ya da gelir eşitlemesinden temettü ödeyebilir, bu da ana yatırımı azaltabilir.
- Sürdürülebilir Gelir: Fidelity, faiz indirimi dönemlerinde global gelir fırsatlarını araştıran gelir odaklı yatırım çözümleri sunar.
III. 2025-2030 Fiyat Tahmini: TCOM ve FIL
Kısa Vadeli Tahmin (2025)
- TCOM: Muhafazakâr $0,0189 - $0,0282 | İyimser $0,0282 - $0,0355
- FIL: Muhafazakâr $1,072 - $1,675 | İyimser $1,675 - $1,993
Orta Vadeli Tahmin (2027)
- TCOM’un büyüme evresine girmesi ve fiyatının $0,0215 - $0,0456 aralığına ulaşması bekleniyor
- FIL’in boğa piyasasına girmesiyle $2,078 - $2,923 aralığı öngörülüyor
- Ana etkenler: Kurumsal sermaye girişleri, ETF gelişmeleri, ekosistem büyümesi
Uzun Vadeli Tahmin (2030)
- TCOM: Temel senaryo $0,0400 - $0,0495 | İyimser senaryo $0,0495 - $0,0663
- FIL: Temel senaryo $2,368 - $3,432 | İyimser senaryo $3,432 - $3,809
Feragatname
TCOM:
| Yıl | Tahmini En Yüksek Fiyat | Tahmini Ortalama Fiyat | Tahmini En Düşük Fiyat | Değişim (%) |
|---|---|---|---|---|
| 2025 | 0,0355446 | 0,02821 | 0,0189007 | 0 |
| 2026 | 0,041121717 | 0,0318773 | 0,026139386 | 13 |
| 2027 | 0,045624385625 | 0,0364995085 | 0,021534710015 | 29 |
| 2028 | 0,043115044415625 | 0,0410619470625 | 0,029975221355625 | 45 |
| 2029 | 0,056819469247734 | 0,042088495739062 | 0,028199292145171 | 49 |
| 2030 | 0,066268336541153 | 0,049453982493398 | 0,040057725819652 | 75 |
FIL:
| Yıl | Tahmini En Yüksek Fiyat | Tahmini Ortalama Fiyat | Tahmini En Düşük Fiyat | Değişim (%) |
|---|---|---|---|---|
| 2025 | 1,99325 | 1,675 | 1,072 | 0 |
| 2026 | 2,73284625 | 1,834125 | 1,52232375 | 9 |
| 2027 | 2,9228616 | 2,283485625 | 2,07797191875 | 36 |
| 2028 | 3,722538265875 | 2,6031736125 | 2,160634098375 | 55 |
| 2029 | 3,700541448849375 | 3,1628559391875 | 2,688427548309375 | 88 |
| 2030 | 3,809185550360465 | 3,431698694018437 | 2,367872098872721 | 104 |
IV. Yatırım Stratejisi Karşılaştırması: TCOM ve FIL
Uzun Vadeli ve Kısa Vadeli Yatırım Stratejileri
- TCOM: IP yönetimi ve ekosistem potansiyeline odaklanan yatırımcılar için uygundur
- FIL: Merkeziyetsiz depolama ve ağ altyapısına ilgi duyan yatırımcılar için uygundur
Risk Yönetimi ve Varlık Dağılımı
- Muhafazakâr yatırımcılar: TCOM %30, FIL %70
- Agresif yatırımcılar: TCOM %60, FIL %40
- Koruma araçları: Stablecoin tahsisi, opsiyonlar, çoklu döviz portföyleri
V. Potansiyel Risk Karşılaştırması
Piyasa Riski
- TCOM: Yeni bir proje olup daha yüksek oynaklığa maruz kalabilir
- FIL: Yerleşik bir proje olsa da genel kripto piyasası dalgalanmalarından etkilenir
Teknik Risk
- TCOM: Ölçeklenebilirlik ve ağ istikrarı
- FIL: Madencilik gücü yoğunlaşması ve olası güvenlik açıkları
Düzenleyici Risk
- Küresel düzenleme politikaları her iki token üzerinde de farklı etkiler yaratabilir
VI. Sonuç: Hangisi Daha İyi Alım?
📌 Yatırım Değeri Özeti:
- TCOM avantajları: İlk merkeziyetsiz IP yönetim protokolü, IP piyasasında büyüme potansiyeli
- FIL avantajları: Yerleşik merkeziyetsiz depolama ağı, yüksek global işlem hacmi ve piyasa değeri
✅ Yatırım Tavsiyesi:
- Yeni yatırımcılar: FIL’in köklü piyasa konumu sebebiyle dengeli bir yaklaşımda hafif FIL ağırlığı tercih edilebilir
- Deneyimli yatırımcılar: Büyüme için TCOM, istikrar için FIL içeren karışık portföy önerilebilir
- Kurumsal yatırımcılar: Her iki projeyi kapsamlı analiz etmeli; FIL’i piyasa değeri, TCOM’u ise IP yönetimindeki benzersiz konumu açısından değerlendirmeli
⚠️ Risk Uyarısı: Kripto para piyasası yüksek oynaklık içerir, bu makale yatırım tavsiyesi değildir. None
VII. SSS
S1: TCOM ve FIL arasındaki temel farklar nelerdir? C: TCOM, dünyanın ilk merkeziyetsiz IP yönetim protokolüdür; FIL ise merkeziyetsiz depolama ağıdır. TCOM, IP tabanlı tokenlara; FIL ise merkeziyetsiz depolama altyapısına odaklanır.
S2: Tarihsel olarak hangi token daha iyi performans gösterdi? C: FIL, 2021’de $236,84 ile daha yüksek tepeye ulaşırken, TCOM 2025’te $0,046 ile zirve yaptı. Ancak FIL, zirvesinden sonra daha keskin bir geri çekilme yaşadı.
S3: TCOM ve FIL’in güncel fiyatları ve işlem hacimleri nedir? C: 15 Ekim 2025 itibarıyla TCOM’un fiyatı $0,02813 ve 24 saatlik işlem hacmi $94.118,68’dir. FIL’in fiyatı $1,677 ve 24 saatlik işlem hacmi $4.505.949,26’dır.
S4: TCOM ve FIL için uzun vadeli fiyat tahminleri nedir? C: 2030’da, TCOM’un $0,0400 - $0,0663; FIL’in ise temel ve iyimser senaryolarda $2,368 - $3,809 aralığına ulaşması bekleniyor.
S5: Yatırımcılar TCOM ve FIL arasında varlıklarını nasıl dağıtmalı? C: Muhafazakâr yatırımcılar için %30 TCOM, %70 FIL; agresif yatırımcılar için %60 TCOM, %40 FIL önerilebilir.
S6: TCOM ve FIL yatırımlarındaki başlıca riskler nelerdir? C: Her iki token da piyasa riski taşır. TCOM, yeni bir proje olarak daha fazla oynaklık gösterebilir. Teknik riskler TCOM’da ölçeklenebilirlik, FIL’de madencilik gücü yoğunlaşmasıdır. Her ikisi de global düzenleyici risklere açıktır.
S7: Farklı yatırımcı tipleri için hangi token önerilir? C: Yeni yatırımcılar için dengeli ve hafif FIL ağırlıklı yaklaşım daha uygun olabilir. Deneyimli yatırımcılar iki tokenı birlikte değerlendirebilir. Kurumsal yatırımcılar ise FIL’in piyasa büyüklüğü ve TCOM’un IP yönetimindeki özgün konumu doğrultusunda detaylı analiz yapmalıdır.
Share
Content
Giriş: TCOM ve FIL Yatırımı Karşılaştırması
I. Fiyat Geçmişi Karşılaştırması ve Güncel Piyasa Durumu
I. TCOM ve FIL Yatırım Değerinde Temel Belirleyiciler
II. Gelecek Görünümü ve Yatırımda Dikkat Edilecekler
III. 2025-2030 Fiyat Tahmini: TCOM ve FIL
IV. Yatırım Stratejisi Karşılaştırması: TCOM ve FIL
V. Potansiyel Risk Karşılaştırması
VI. Sonuç: Hangisi Daha İyi Alım?
VII. SSS
Trending Cryptocurrencies


DIMO (DIMO) iyi bir yatırım mı?: Bu merkeziyetsiz mobilite tokenının potansiyeli ve riskleri üzerine analiz

Hivemapper (HONEY) yatırım için uygun mu?: Bu merkeziyetsiz haritalama kripto para biriminin potansiyelini değerlendirmek

NKN (NKN) Yatırım İçin Uygun mu?: Merkeziyetsiz Ağ Pazarında Performans, Teknoloji ve Gelecek Potansiyelinin Değerlendirilmesi

MVL (MVL) iyi bir yatırım mı?: Blokzincir tabanlı mobilite ekosistemi tokeninin potansiyeli ve riskleri üzerine analiz
Enerji Ağının İnterneti (IOEN) iyi bir yatırım mı?: Enerji sektöründe yükselen bu blockchain teknolojisinin potansiyeli ve risklerini analiz etmek
World Mobile Token (WMTX) iyi bir yatırım mı?: Bu yükselen kripto paranın potansiyeli ve riskleri üzerine bir analiz

Dropee Günlük Kombinasyonu 11 Aralık 2025
Tomarket Günlük Kombinasyonu 11 Aralık 2025

Merkeziyetsiz Finans'ta Geçici Kayıp Nedir?

Kripto Parada Çifte Harcama: Önleme Stratejileri

Kripto Ticaretinde Wyckoff Yönteminin Anlaşılması