TAP ve AAVE: Kentsel Amerika'daki Dilsel Farklılıkları Değerlendirmek


Giriş: TAP ve AAVE Yatırım Karşılaştırması
Kripto para piyasasında TAP ve AAVE karşılaştırması, yatırımcıların sürekli gündeminde olan bir başlıktır. İki proje, sadece piyasa değeri sıralaması, uygulama alanları ve fiyat performansı açısından değil, aynı zamanda kripto varlıkların konumlandırılması bakımından da farklılık taşır.
TAP (TAP): Lansmanından bu yana GameFi ve Metaverse sektörlerindeki konumlanmasıyla piyasanın dikkatini çekmiştir.
AAVE (AAVE): 2020 yılında faaliyete geçtiğinden beri, merkeziyetsiz kredi protokolleri arasında lider olarak anılmış, DeFi ekosisteminde küresel işlem hacmi ve piyasa değeri en yüksek kripto paralardan biri olmuştur.
Bu makale, TAP ve AAVE’nin yatırım değerini kapsamlı şekilde karşılaştıracaktır; tarihsel fiyat eğilimleri, arz mekanizmaları, kurumsal benimsenme, teknolojik ekosistemler ve ileriye dönük öngörüler üzerinden analiz sunacak ve yatırımcıların en çok merak ettiği şu soruya cevap arayacaktır:
"Şu anda hangisi daha avantajlı bir alım?"
I. Fiyat Geçmişi Karşılaştırması ve Güncel Piyasa Durumu
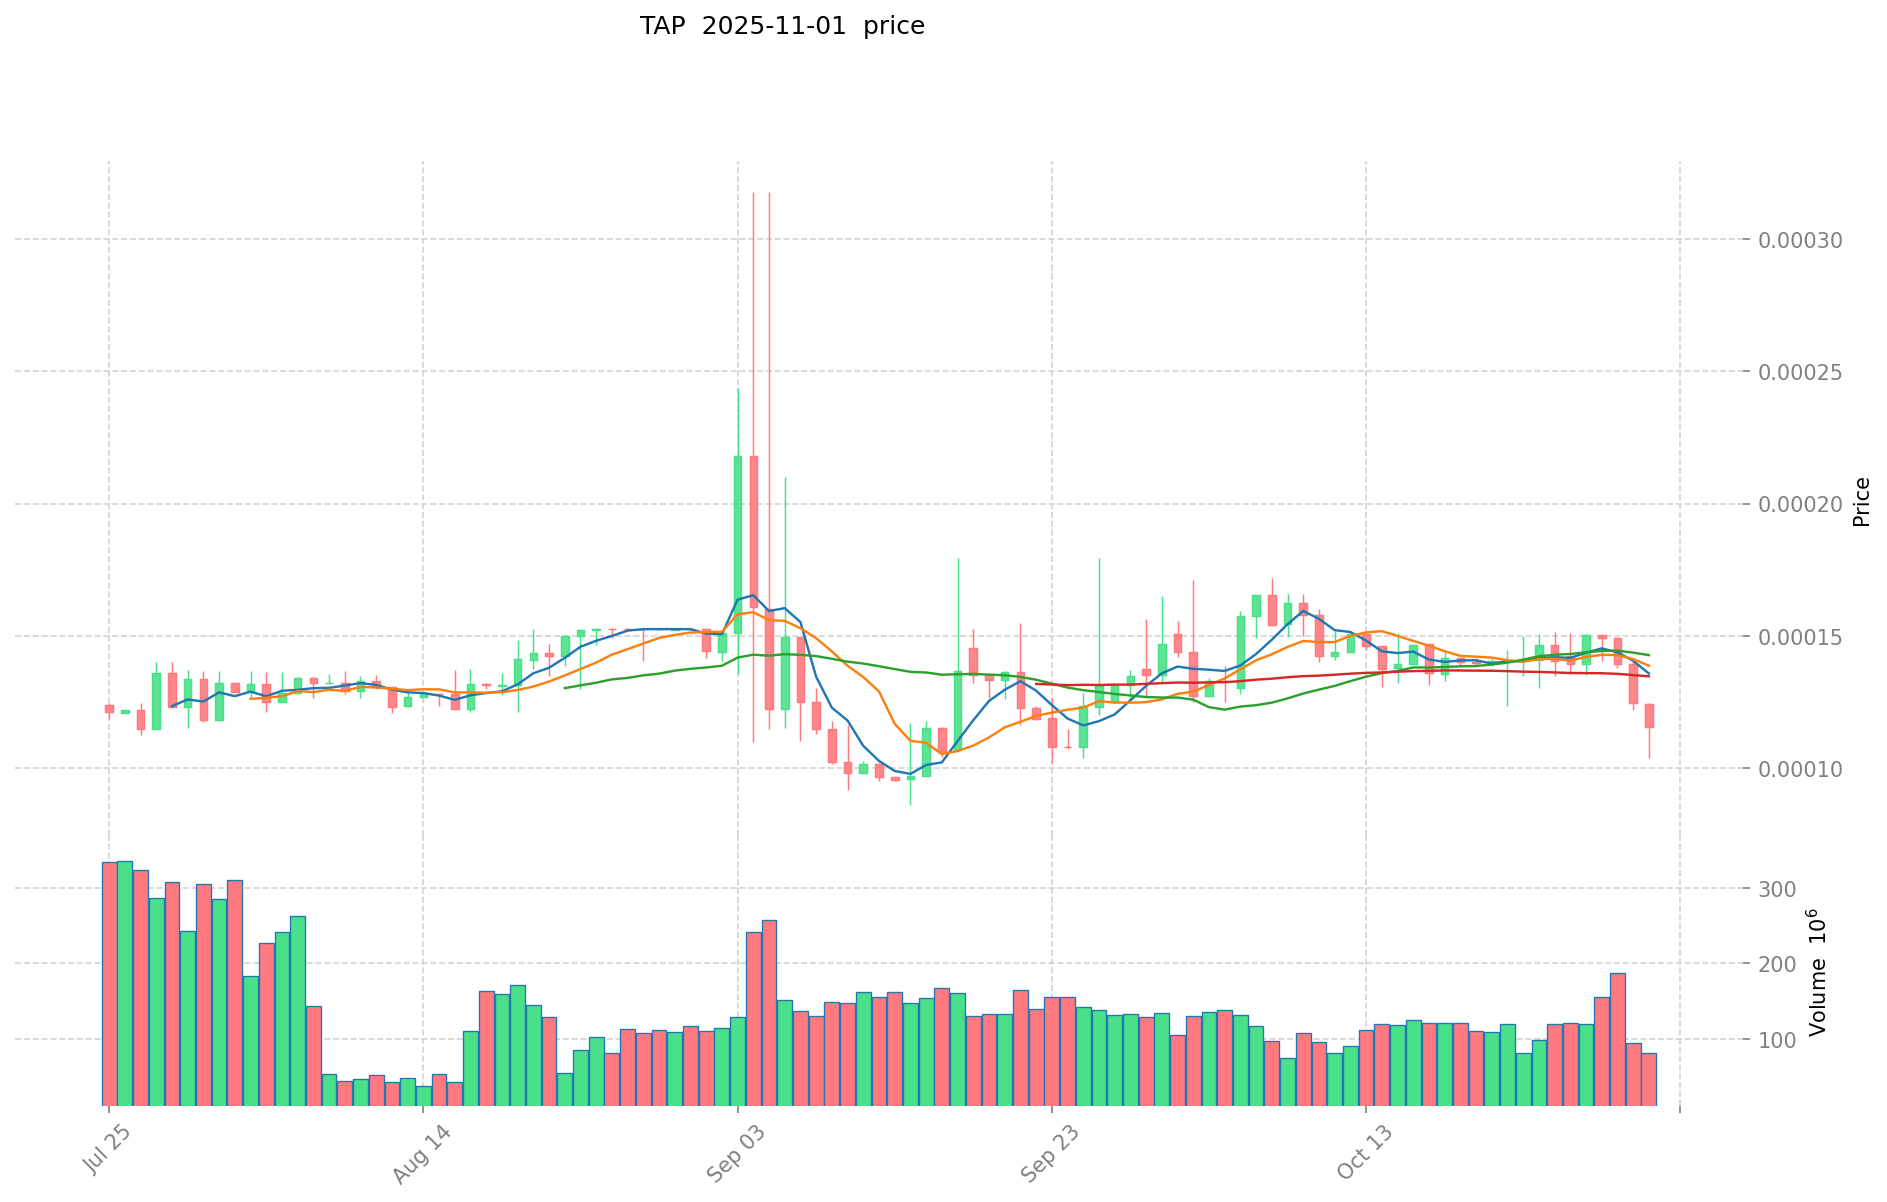
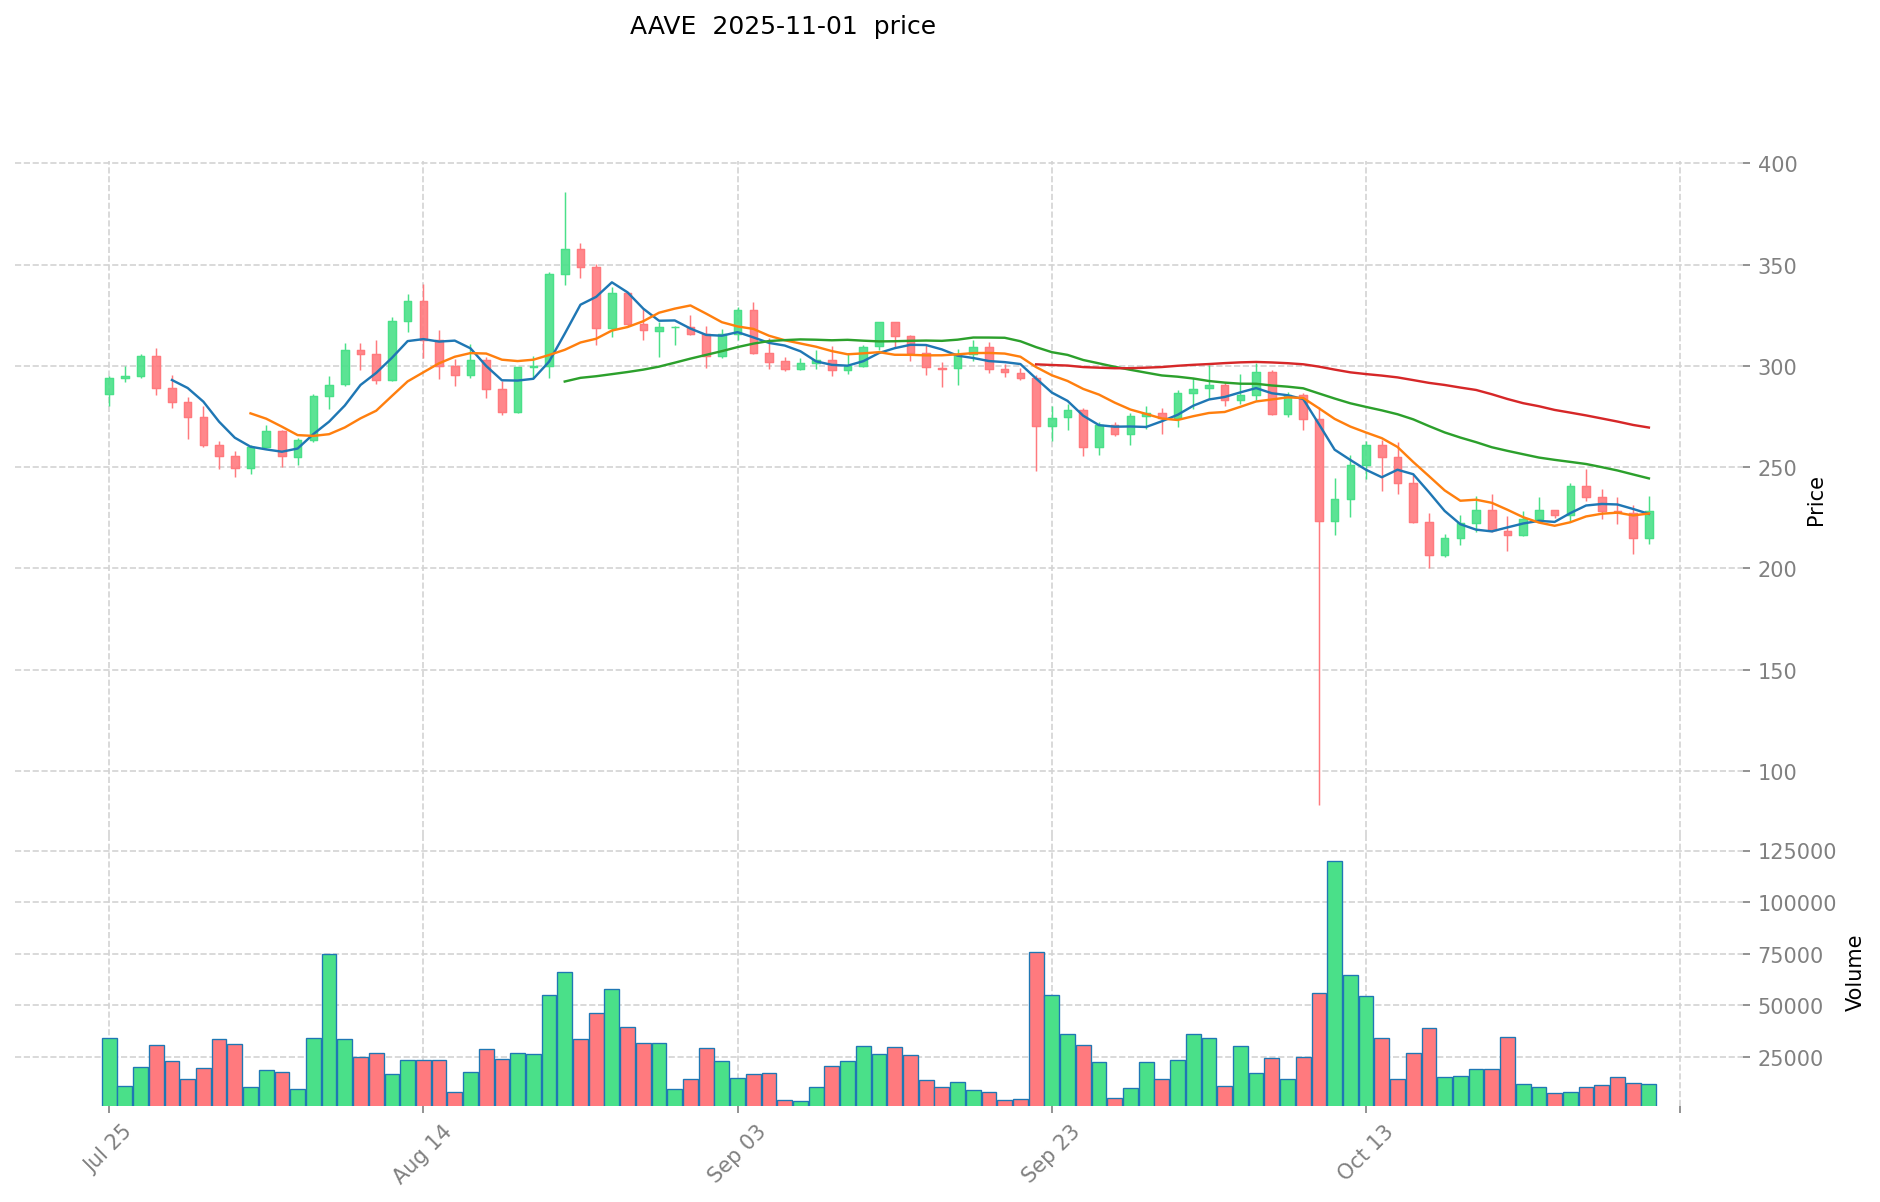
TAP ve AAVE Tarihsel Fiyat Eğilimleri
- 2022: GameFi projelerine artan ilgiyle TAP, $0,256175 ile tüm zamanların en yüksek seviyesine ulaştı.
- 2021: DeFi hareketinin etkisiyle AAVE, $661,69 ile zirveyi gördü.
- Karşılaştırma: Son ayı piyasasında TAP, zirveden $0,00088672 seviyesine kadar gerilerken; AAVE daha dirençli olup yüksek fiyat seviyesini korudu.
Güncel Piyasa Durumu (02 Kasım 2025)
- TAP güncel fiyatı: $0,00011416
- AAVE güncel fiyatı: $222,47
- 24 saatlik işlem hacmi: $10.294,21 (TAP) – $3.087.931,84 (AAVE)
- Piyasa Duyarlılık Endeksi (Korku & Açgözlülük): 33 (Korku)
Gerçek zamanlı fiyatlar için tıklayın:
- TAP güncel fiyatı Piyasa Fiyatı
- AAVE güncel fiyatı Piyasa Fiyatı
Yatırım Değeri Analizi: TAP ve AAVE
Arz Mekanizması Karşılaştırması (Tokenomics)
- AAVE: Sabit toplam arza sahip yönetim token’ı; sahiplerine oy hakkı ve protokol ücretlerinden pay verir.
- TAP: Protokol işlemleriyle token’ların yakıldığı deflasyonist model uygular, zamanla arzı azaltarak kıtlık yaratır.
- 📌 Tarihsel Eğilim: Arz kısıtlamaları genelde fiyat döngülerini tetikler; AAVE’nin sabit arzı öngörülebilirlik sağlarken, TAP’in deflasyonist modeli azalan arzla yukarı yönlü fiyat baskısı oluşturur.
Kurumsal Benimsenme ve Piyasa Uygulamaları
- Kurumsal Varlıklar: AAVE, DeFi protokolü olarak yüksek TVL ile kurumsal tarafta öne çıkar.
- Kurumsal Uygulamalar: AAVE, borç verme/borç alma uygulamalarında liderken TAP, DeFi’ye sade erişim sağlamayı hedefler.
- Düzenleyici Durum: Her iki proje de gelişen düzenleyici denetim ile karşı karşıya; AAVE’nin uzun operasyon geçmişi, daha fazla düzenleyici netlik sunabilir.
Teknolojik Gelişim ve Ekosistem Oluşumu
- AAVE Teknik Güncellemeleri: Likidite protokolleri ve zincirler arası fonksiyonlar sürekli geliştiriliyor, bu da çok yönlülük sağlıyor.
- TAP Teknik Gelişimi: Kullanıcı arayüzlerini sadeleştirme ve zincirler arası uyumluluğa odaklanıyor, erişim bariyerlerini azaltıyor.
- Ekosistem Karşılaştırması: AAVE, olgun bir DeFi ekosistemi ve yerleşik borç piyasalarına sahipken, TAP sadeleştirilmiş erişim noktaları oluşturmayı amaçlıyor.
Makroekonomik Faktörler ve Piyasa Döngüleri
- Enflasyon Performansı: Her iki token, enflasyona karşı potansiyel koruma sunabilir; AAVE’nin yerleşik konumu ekstra istikrar sağlar.
- Para Politikası Etkisi: Faiz değişimi, getiri platformlarını etkileyerek her iki token’ın değerini şekillendirebilir.
- Jeopolitik Faktörler: Finansal belirsizlikte merkeziyetsiz finans hizmetlerine talep artar; bu, her iki platformun da avantajınadır.
III. Fiyat Tahmini: 2025-2030 TAP ve AAVE
Kısa Vadeli Tahmin (2025)
- TAP: Temkinli $0,0000958944 – $0,00011416 | İyimser $0,00011416 – $0,000136992
- AAVE: Temkinli $193,5054 – $222,42 | İyimser $222,42 – $275,8008
Orta Vadeli Tahmin (2027)
- TAP büyüme fazına girebilir; öngörülen fiyat aralığı $0,000130222312 – $0,0001899713728
- AAVE istikrarlı büyüme fazında olabilir; öngörülen fiyat aralığı $250,55524032 – $279,8755344
- Başlıca etkenler: Kurumsal sermaye akışı, ETF, ekosistem gelişimi
Uzun Vadeli Tahmin (2030)
- TAP: Temel senaryo $0,000141097315157 – $0,000201567593082 | İyimser senaryo $0,000201567593082 – $0,000241881111698
- AAVE: Temel senaryo $302,194142253696 – $377,74267781712 | İyimser senaryo $377,74267781712 – $449,5137866023728
Feragatname: Yukarıda yer alan tahminler, geçmiş veriler ve güncel piyasa eğilimleri esas alınarak hazırlanmıştır. Kripto para piyasaları yüksek volatiliteye sahiptir ve ani değişiklikler yaşanabilir. Bu öngörüler yatırım tavsiyesi değildir. Yatırım kararı öncesinde mutlaka kendi araştırmanızı yapınız.
TAP:
| Yıl | Tahmini En Yüksek | Tahmini Ortalama | Tahmini En Düşük | Değişim Oranı |
|---|---|---|---|---|
| 2025 | 0,000136992 | 0,00011416 | 0,0000958944 | 0 |
| 2026 | 0,00018082944 | 0,000125576 | 0,00010799536 | 10 |
| 2027 | 0,0001899713728 | 0,00015320272 | 0,000130222312 | 34 |
| 2028 | 0,000183598139648 | 0,0001715870464 | 0,00015442834176 | 50 |
| 2029 | 0,00022554259314 | 0,000177592593024 | 0,000111883333605 | 55 |
| 2030 | 0,000241881111698 | 0,000201567593082 | 0,000141097315157 | 76 |
AAVE:
| Yıl | Tahmini En Yüksek | Tahmini Ortalama | Tahmini En Düşük | Değişim Oranı |
|---|---|---|---|---|
| 2025 | 275,8008 | 222,42 | 193,5054 | 0 |
| 2026 | 283,985856 | 249,1104 | 239,145984 | 12 |
| 2027 | 279,8755344 | 266,548128 | 250,55524032 | 19 |
| 2028 | 404,353510176 | 273,2118312 | 166,659217032 | 22 |
| 2029 | 416,70268494624 | 338,782670688 | 172,77916205088 | 52 |
| 2030 | 449,5137866023728 | 377,74267781712 | 302,194142253696 | 69 |
IV. Yatırım Stratejisi Karşılaştırması: TAP ve AAVE
Uzun Vadeli ve Kısa Vadeli Yatırım Stratejileri
- TAP: GameFi ve Metaverse potansiyeline odaklananlar için uygun
- AAVE: İstikrar ve DeFi maruziyeti arayanlar için uygun
Risk Yönetimi ve Varlık Dağılımı
- Temkinli yatırımcılar: TAP %20 – AAVE %80
- Agresif yatırımcılar: TAP %40 – AAVE %60
- Koruma araçları: Stablecoin tahsisi, opsiyonlar, çapraz para kombinasyonları
V. Potansiyel Risk Karşılaştırması
Piyasa Riski
- TAP: Düşük piyasa değeri ve gelişmekte olan sektör nedeniyle yüksek volatilite
- AAVE: DeFi piyasa dalgalanmalarına ve rekabete karşı hassas
Teknik Risk
- TAP: Ölçeklenebilirlik ve ağ stabilitesi
- AAVE: Akıllı sözleşme açıkları ve likidite riskleri
Düzenleyici Risk
- Küresel düzenleyici politikalar, iki token üzerinde farklı etkiler yaratabilir
VI. Sonuç: Hangisi Daha Avantajlı Alım?
📌 Yatırım Değeri Özeti:
- TAP avantajları: GameFi ve Metaverse maruziyeti, deflasyonist yapı
- AAVE avantajları: Yerleşik DeFi protokolü, kurumsal benimsenme, yönetim token’ı
✅ Yatırım Tavsiyesi:
- Yeni yatırımcılar: İstikrar için AAVE’ye ağırlık verin
- Deneyimli yatırımcılar: TAP ve AAVE ile dengeli portföy oluşturun
- Kurumsal yatırımcılar: AAVE’nin DeFi’deki yerleşik konumuna odaklanın
⚠️ Risk Uyarısı: Kripto para piyasaları yüksek volatiliteye sahiptir. Bu makale yatırım tavsiyesi değildir. None
VII. Sıkça Sorulan Sorular
S1: TAP ve AAVE arasındaki temel farklar nelerdir? C: TAP, GameFi ve Metaverse sektörlerine odaklanır ve deflasyonist bir model uygular. AAVE ise DeFi’de lider merkeziyetsiz kredi protokolüdür; sabit arz ve yönetim token yapısına sahiptir.
S2: Geçmişte hangi token daha iyi fiyat performansı gösterdi? C: AAVE, piyasa düşüşlerinde daha dirençli olup daha yüksek fiyat seviyesini korudu. 2021’de AAVE $661,69 ile zirve yaptı, TAP ise 2022’de $0,256175 ile en yüksek seviyesine ulaştı.
S3: TAP ve AAVE’nin arz mekanizmaları nasıl farklılık gösteriyor? C: TAP, protokol işlemlerinde token’ların yakıldığı deflasyonist bir model kullanır ve zamanla kıtlık yaratır. AAVE ise sabit arzlı bir yönetim token’ı olup sahiplerine oy hakkı ve protokol ücretlerinden pay sağlar.
S4: Hangi token daha fazla kurumsal benimsenme elde etti? C: AAVE, DeFi alanındaki yerleşik konumu ve yüksek TVL ile kurumsal yatırımcıların ilgisini daha fazla çekti.
S5: TAP ve AAVE için gelecekteki fiyat tahminlerinde ana itici güçler nelerdir? C: Kurumsal sermaye girişi, olası ETF onayları, ekosistem gelişimi ve GameFi, Metaverse ile DeFi sektörlerindeki genel piyasa trendleri başlıca etkenlerdir.
S6: Yatırımcılar portföylerini TAP ve AAVE arasında nasıl dağıtmalı? C: Temkinli yatırımcılar için %20 TAP ve %80 AAVE, agresif yatırımcılar için %40 TAP ve %60 AAVE önerilebilir. Dağılım, risk toleransı ve yatırım hedeflerine bağlıdır.
S7: TAP ve AAVE yatırımlarında başlıca riskler nelerdir? C: TAP, küçük piyasa değeri ve yeni sektör odağı nedeniyle yüksek volatilite riski taşır. AAVE ise DeFi piyasa dalgalanmalarına ve rekabete açık. Her iki token, düzenleyici riskler ve teknik açıklar barındırır.
Share
Content
Giriş: TAP ve AAVE Yatırım Karşılaştırması
I. Fiyat Geçmişi Karşılaştırması ve Güncel Piyasa Durumu
Yatırım Değeri Analizi: TAP ve AAVE
III. Fiyat Tahmini: 2025-2030 TAP ve AAVE
IV. Yatırım Stratejisi Karşılaştırması: TAP ve AAVE
V. Potansiyel Risk Karşılaştırması
VI. Sonuç: Hangisi Daha Avantajlı Alım?
VII. Sıkça Sorulan Sorular
How to Buy Cryptocurrency


Trending Cryptocurrencies


2025 PROM Fiyat Tahmini: Piyasa Trendleri ve Olası Büyüme Faktörlerinin Analizi

CVAULTCORE ve SAND: Metaverse Ekonomisinde Blockchain Devleri Arasındaki Rekabet

ATOZ vs RUNE: DeFi'nin geleceğini belirleyen merkeziyetsiz protokoller arasındaki rekabet

SENSO ve GMX: İki Önde Gelen Blockchain Oyun Platformunu Karşılaştırıyoruz

ATOZ vs RUNE: Merkeziyetsiz finansın geleceğini belirleyen kripto para ekosistemleri arasındaki rekabet

KCAL (KCAL) yatırım için uygun mu?: Bu kripto varlığın oynak piyasadaki potansiyelini değerlendiriyoruz

Solana üzerinde Puff Meme Coin'i keşfetmek için kapsamlı bir rehber