TAO vs ENJ: Comparing Two Leading Blockchain Gaming Platforms
Introduction: TAO vs ENJ Investment Comparison
In the cryptocurrency market, the comparison between Bittensor (TAO) vs Enjin Coin (ENJ) has been an unavoidable topic for investors. The two not only show significant differences in market cap ranking, application scenarios, and price performance but also represent different positions in the crypto asset landscape.
Bittensor (TAO): Since its launch, it has gained market recognition for its decentralized machine learning network.
Enjin Coin (ENJ): Introduced in 2009, it has been hailed as a platform for online game community creation, becoming one of the largest in its field.
This article will provide a comprehensive analysis of the investment value comparison between TAO and ENJ, focusing on historical price trends, supply mechanisms, institutional adoption, technical ecosystems, and future predictions, attempting to answer the question investors care about most:
"Which is the better buy right now?"
I. Price History Comparison and Current Market Status
TAO and ENJ Historical Price Trends
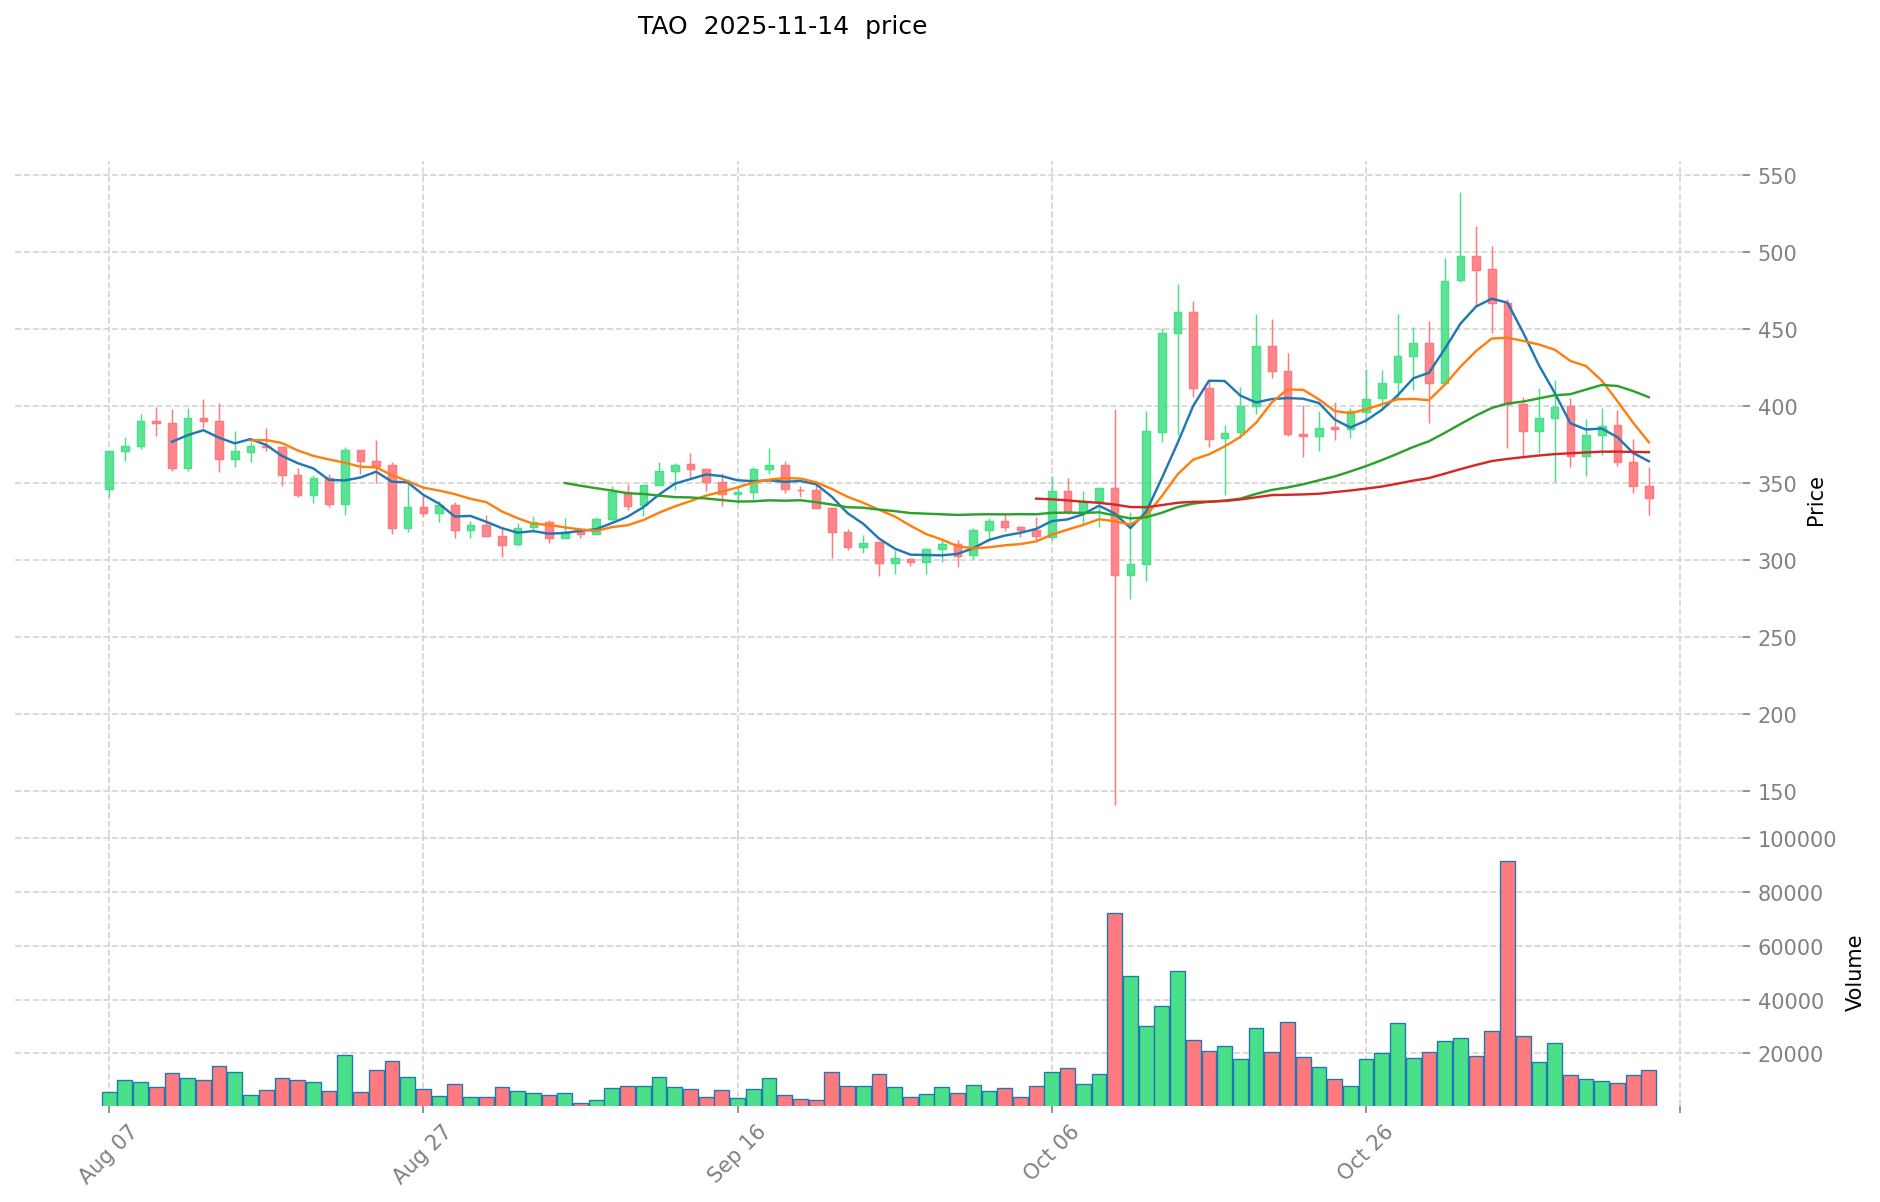
- 2024: TAO reached its all-time high of $795.6 on April 11, 2024, likely due to significant developments or market enthusiasm.
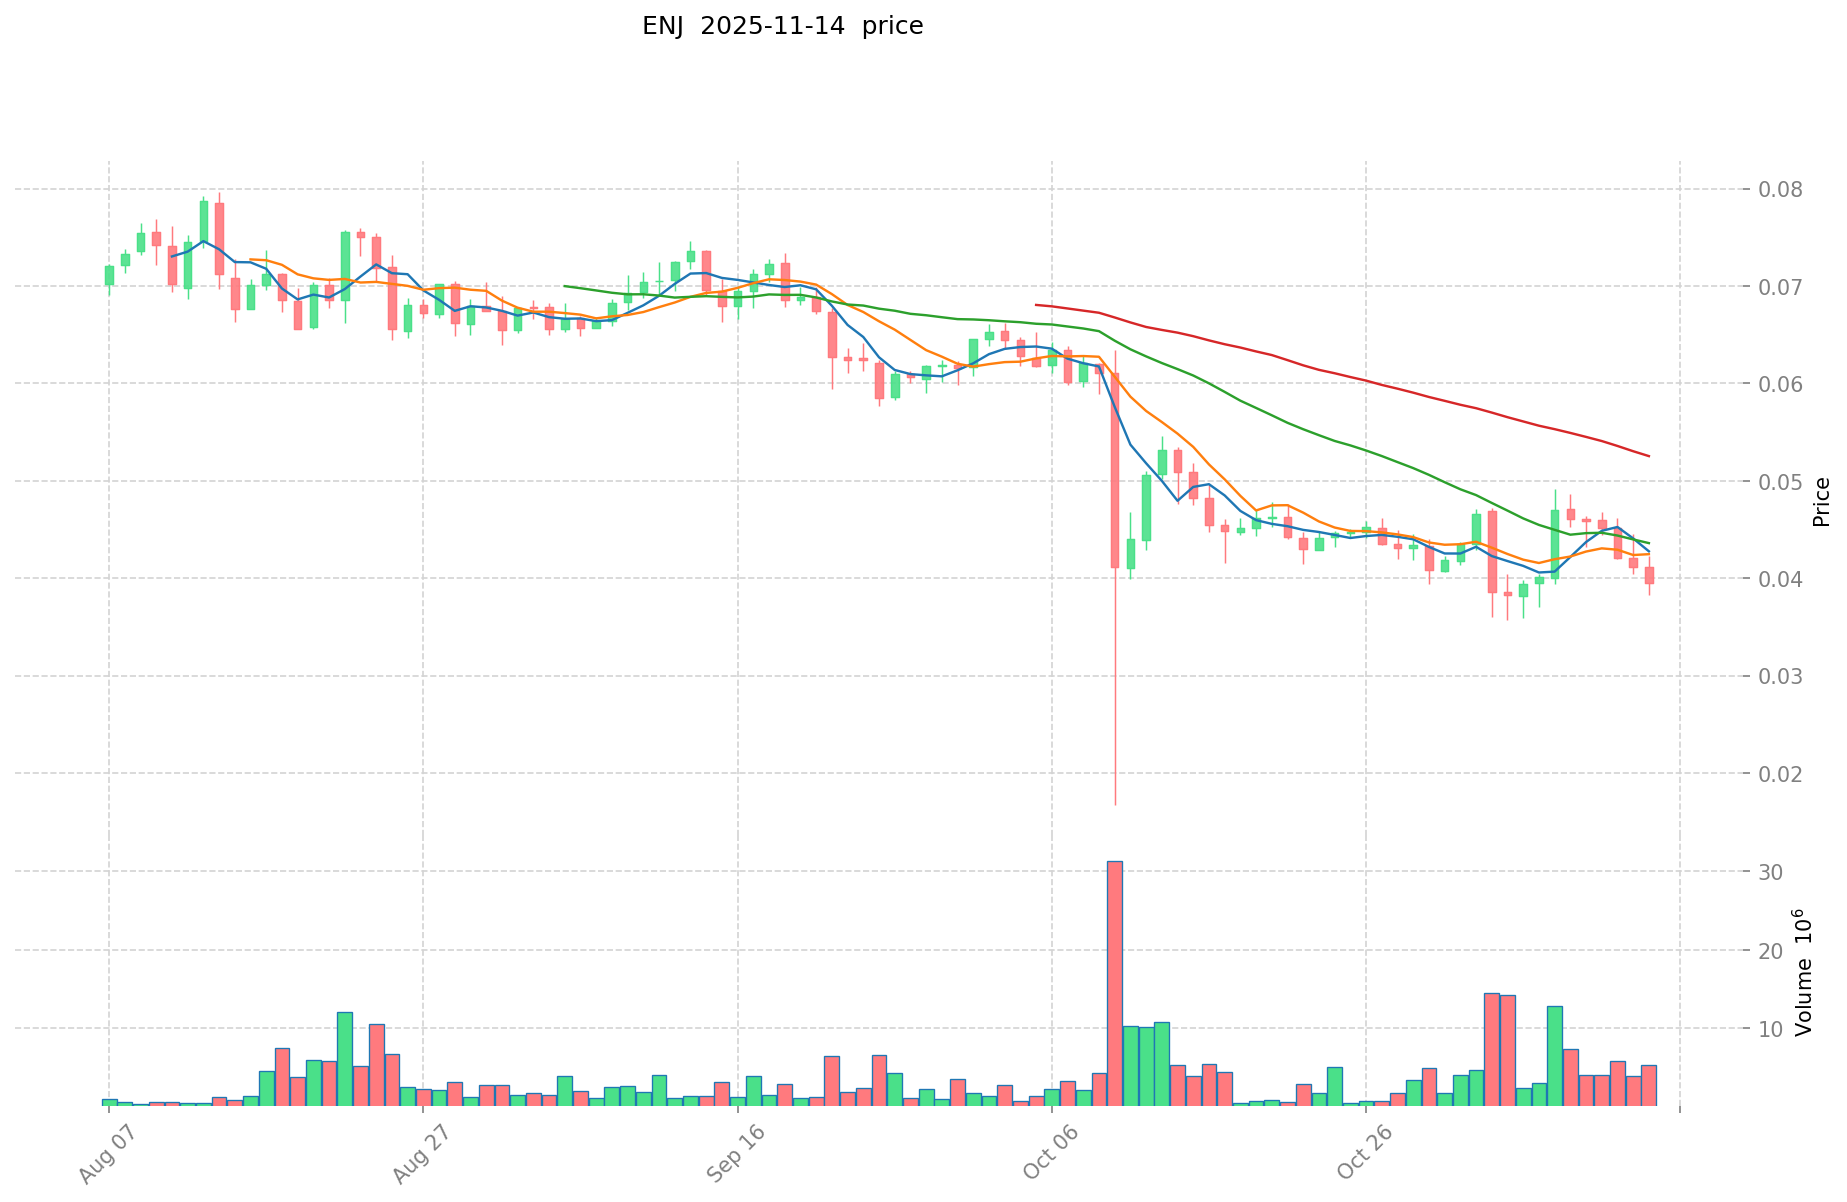
- 2023: ENJ experienced a notable low, reaching $0.01865964 on September 5, 2023, possibly influenced by broader market conditions.
- Comparative Analysis: In recent market cycles, TAO has shown substantial volatility, ranging from a high of $795.6 to a current price of $321.3, while ENJ has seen a significant decline from its all-time high of $4.82 to its current price of $0.03884.
Current Market Situation (2025-11-14)
- TAO current price: $321.3
- ENJ current price: $0.03884
- 24-hour trading volume: TAO $5,324,917.41 vs ENJ $155,800.84
- Market Sentiment Index (Fear & Greed Index): 16 (Extreme Fear)
Click to view real-time prices:
- View TAO current price Market Price
- View ENJ current price Market Price
II. Core Factors Affecting TAO vs ENJ Investment Value
Supply Mechanism Comparison (Tokenomics)
- TAO: Fixed supply of 100 million tokens with no additional minting
- ENJ: Deflationary model where tokens are consumed ("melted") when creating blockchain assets
- 📌 Historical Pattern: Fixed supply models like TAO's tend to create scarcity value, while ENJ's melting mechanism reduces circulating supply as adoption increases.
Institutional Adoption and Market Applications
- Institutional Holdings: ENJ has more established institutional presence due to longer market history
- Enterprise Adoption: ENJ has broader implementation in gaming ecosystems for digital asset creation, while TAO focuses on AI creativity applications
- National Policies: Both face similar regulatory frameworks as ERC-20 tokens within existing crypto regulatory environments
Technical Development and Ecosystem Building
- TAO Technical Upgrades: Integration with the Bittensor network, enhancing AI content generation capabilities
- ENJ Technical Development: Ongoing development of Enjin Platform V2 and Efinity parachain for NFT infrastructure
- Ecosystem Comparison: ENJ has a more mature NFT and gaming ecosystem, while TAO is building in the emerging AI content creation space
Macroeconomic Factors and Market Cycles
- Performance in Inflationary Environments: Both assets are relatively new in terms of tracking through multiple economic cycles
- Macroeconomic Monetary Policy: As speculative crypto assets, both are generally impacted negatively by rising interest rates
- Geopolitical Factors: ENJ's gaming focus may provide more global resilience, while TAO's AI connection could benefit from regions prioritizing AI development
III. 2025-2030 Price Prediction: TAO vs ENJ
Short-term Prediction (2025)
- TAO: Conservative $175.23 - $324.5 | Optimistic $324.5 - $431.585
- ENJ: Conservative $0.0341 - $0.03875 | Optimistic $0.03875 - $0.0538625
Mid-term Prediction (2027)
- TAO may enter a growth phase, with prices expected in the range of $258.01 - $579.54
- ENJ may enter a growth phase, with prices expected in the range of $0.0322 - $0.0689
- Key drivers: Institutional capital inflow, ETF, ecosystem development
Long-term Prediction (2030)
- TAO: Base scenario $459.03 - $596.14 | Optimistic scenario $596.14 - $673.64
- ENJ: Base scenario $0.0432 - $0.0816 | Optimistic scenario $0.0816 - $0.0889
Disclaimer: The above predictions are based on historical data and market analysis. Cryptocurrency markets are highly volatile and subject to rapid changes. These projections should not be considered as financial advice or guarantees of future performance. Always conduct your own research before making investment decisions.
TAO:
| 年份 | 预测最高价 | 预测平均价格 | 预测最低价 | 涨跌幅 |
|---|---|---|---|---|
| 2025 | 431.585 | 324.5 | 175.23 | 1 |
| 2026 | 415.84675 | 378.0425 | 245.727625 | 17 |
| 2027 | 579.5391525 | 396.944625 | 258.01400625 | 23 |
| 2028 | 595.655104275 | 488.24188875 | 375.9462543375 | 52 |
| 2029 | 650.338195815 | 541.9484965125 | 406.461372384375 | 68 |
| 2030 | 673.6419811650375 | 596.14334616375 | 459.0303765460875 | 85 |
ENJ:
| 年份 | 预测最高价 | 预测平均价格 | 预测最低价 | 涨跌幅 |
|---|---|---|---|---|
| 2025 | 0.0538625 | 0.03875 | 0.0341 | 0 |
| 2026 | 0.06482875 | 0.04630625 | 0.030562125 | 19 |
| 2027 | 0.0689037 | 0.0555675 | 0.03222915 | 43 |
| 2028 | 0.078416856 | 0.0622356 | 0.052277904 | 60 |
| 2029 | 0.09283062096 | 0.070326228 | 0.04993162188 | 81 |
| 2030 | 0.0889204826832 | 0.08157842448 | 0.0432365649744 | 110 |
IV. Investment Strategy Comparison: TAO vs ENJ
Long-term vs Short-term Investment Strategies
- TAO: Suitable for investors interested in AI and machine learning potential
- ENJ: Suitable for investors focusing on gaming and NFT ecosystems
Risk Management and Asset Allocation
- Conservative investors: TAO: 30% vs ENJ: 70%
- Aggressive investors: TAO: 60% vs ENJ: 40%
- Hedging tools: Stablecoin allocation, options, cross-currency portfolios
V. Potential Risk Comparison
Market Risks
- TAO: High volatility due to newer market presence
- ENJ: Dependency on gaming industry trends
Technical Risks
- TAO: Scalability, network stability
- ENJ: Smart contract vulnerabilities, platform adoption
Regulatory Risks
- Global regulatory policies may impact both differently, with ENJ potentially facing less scrutiny due to its established gaming focus
VI. Conclusion: Which Is the Better Buy?
📌 Investment Value Summary:
- TAO advantages: Emerging AI sector potential, fixed supply model
- ENJ advantages: Established gaming ecosystem, deflationary tokenomics
✅ Investment Advice:
- New investors: Consider a balanced approach with higher allocation to ENJ due to its more established market presence
- Experienced investors: Explore TAO for its growth potential in the AI sector
- Institutional investors: Evaluate both for portfolio diversification, with ENJ for established presence and TAO for emerging tech exposure
⚠️ Risk Warning: Cryptocurrency markets are highly volatile. This article does not constitute investment advice. None
FAQ
Q1: What are the main differences between TAO and ENJ? A: TAO is focused on decentralized machine learning networks, while ENJ is centered on online game community creation and NFTs. TAO has a fixed supply of 100 million tokens, whereas ENJ has a deflationary model. TAO is newer to the market with higher volatility, while ENJ has a more established presence in the gaming ecosystem.
Q2: Which coin has performed better historically? A: Based on the available data, TAO has shown higher price volatility and reached a significant all-time high of $795.6 in April 2024. ENJ, on the other hand, has experienced a decline from its all-time high of $4.82 to its current price of $0.03884. However, past performance does not guarantee future results.
Q3: What are the key factors affecting the investment value of TAO and ENJ? A: Key factors include supply mechanisms, institutional adoption, technical development, ecosystem building, and macroeconomic factors. TAO's value is influenced by AI and machine learning advancements, while ENJ's value is tied to gaming industry trends and NFT adoption.
Q4: How do the long-term price predictions compare for TAO and ENJ? A: For 2030, TAO's base scenario predicts a range of $459.03 - $596.14, with an optimistic scenario of $596.14 - $673.64. ENJ's base scenario for 2030 is $0.0432 - $0.0816, with an optimistic scenario of $0.0816 - $0.0889. However, these predictions are speculative and subject to market volatility.
Q5: What are the main risks associated with investing in TAO and ENJ? A: TAO faces risks related to high volatility, scalability, and network stability. ENJ's risks include dependency on gaming industry trends and potential smart contract vulnerabilities. Both are subject to regulatory risks, though ENJ may face less scrutiny due to its established gaming focus.
Q6: How should investors allocate their portfolio between TAO and ENJ? A: Conservative investors might consider allocating 30% to TAO and 70% to ENJ, while aggressive investors might opt for 60% TAO and 40% ENJ. However, individual allocation should be based on personal risk tolerance and investment goals.
Q7: Which coin is considered a better buy for different types of investors? A: New investors might prefer a balanced approach with higher allocation to ENJ due to its established presence. Experienced investors could explore TAO for its growth potential in the AI sector. Institutional investors may consider both for portfolio diversification, with ENJ offering established presence and TAO providing exposure to emerging tech.
Share
Content
Introduction: TAO vs ENJ Investment Comparison
I. Price History Comparison and Current Market Status
II. Core Factors Affecting TAO vs ENJ Investment Value
III. 2025-2030 Price Prediction: TAO vs ENJ
IV. Investment Strategy Comparison: TAO vs ENJ
V. Potential Risk Comparison
VI. Conclusion: Which Is the Better Buy?
FAQ

