TA ve DYDX: Teknik Analiz ile Merkeziyetsiz Borsa İşlem Stratejilerinin Karşılaştırılması

Giriş: TA ve DYDX Yatırımı Karşılaştırması
Kripto para piyasasında Trusta.AI (TA) ile dYdX (DYDX) arasındaki karşılaştırma yatırımcılar için kaçınılmaz bir gündem haline geldi. İki proje; piyasa değeri sıralaması, uygulama alanları ve fiyat performansları açısından belirgin farklar taşırken, kripto varlık ekosisteminde farklı konumlandırmaları da temsil ediyor.
Trusta.AI (TA): 2025’te piyasaya sürülen proje, hem yapay zekâ hem de kripto için güvenilir kimlik ağı oluşturma vizyonuyla kısa sürede piyasanın dikkatini çekti.
dYdX (DYDX): 2021’de tanıtılan DYDX, merkeziyetsiz türev işlemler protokolü olarak öne çıkıyor ve DeFi ekosisteminin en önemli platformlarından biri olarak konumlanıyor.
Bu makalede, TA ve DYDX’in yatırım değerleri kapsamlı biçimde analiz edilecek; geçmiş fiyat trendleri, arz mekanizmaları, kurumsal benimsenme, teknolojik ekosistemler ve gelecek öngörüleri incelenecek. Yatırımcılar için en kritik soruya yanıt aranacak:
"Şu anda hangisi daha avantajlı bir alım fırsatı sunuyor?"
I. Fiyat Geçmişi Karşılaştırması ve Güncel Piyasa Durumu
TA ve DYDX Tarihsel Fiyat Eğilimleri
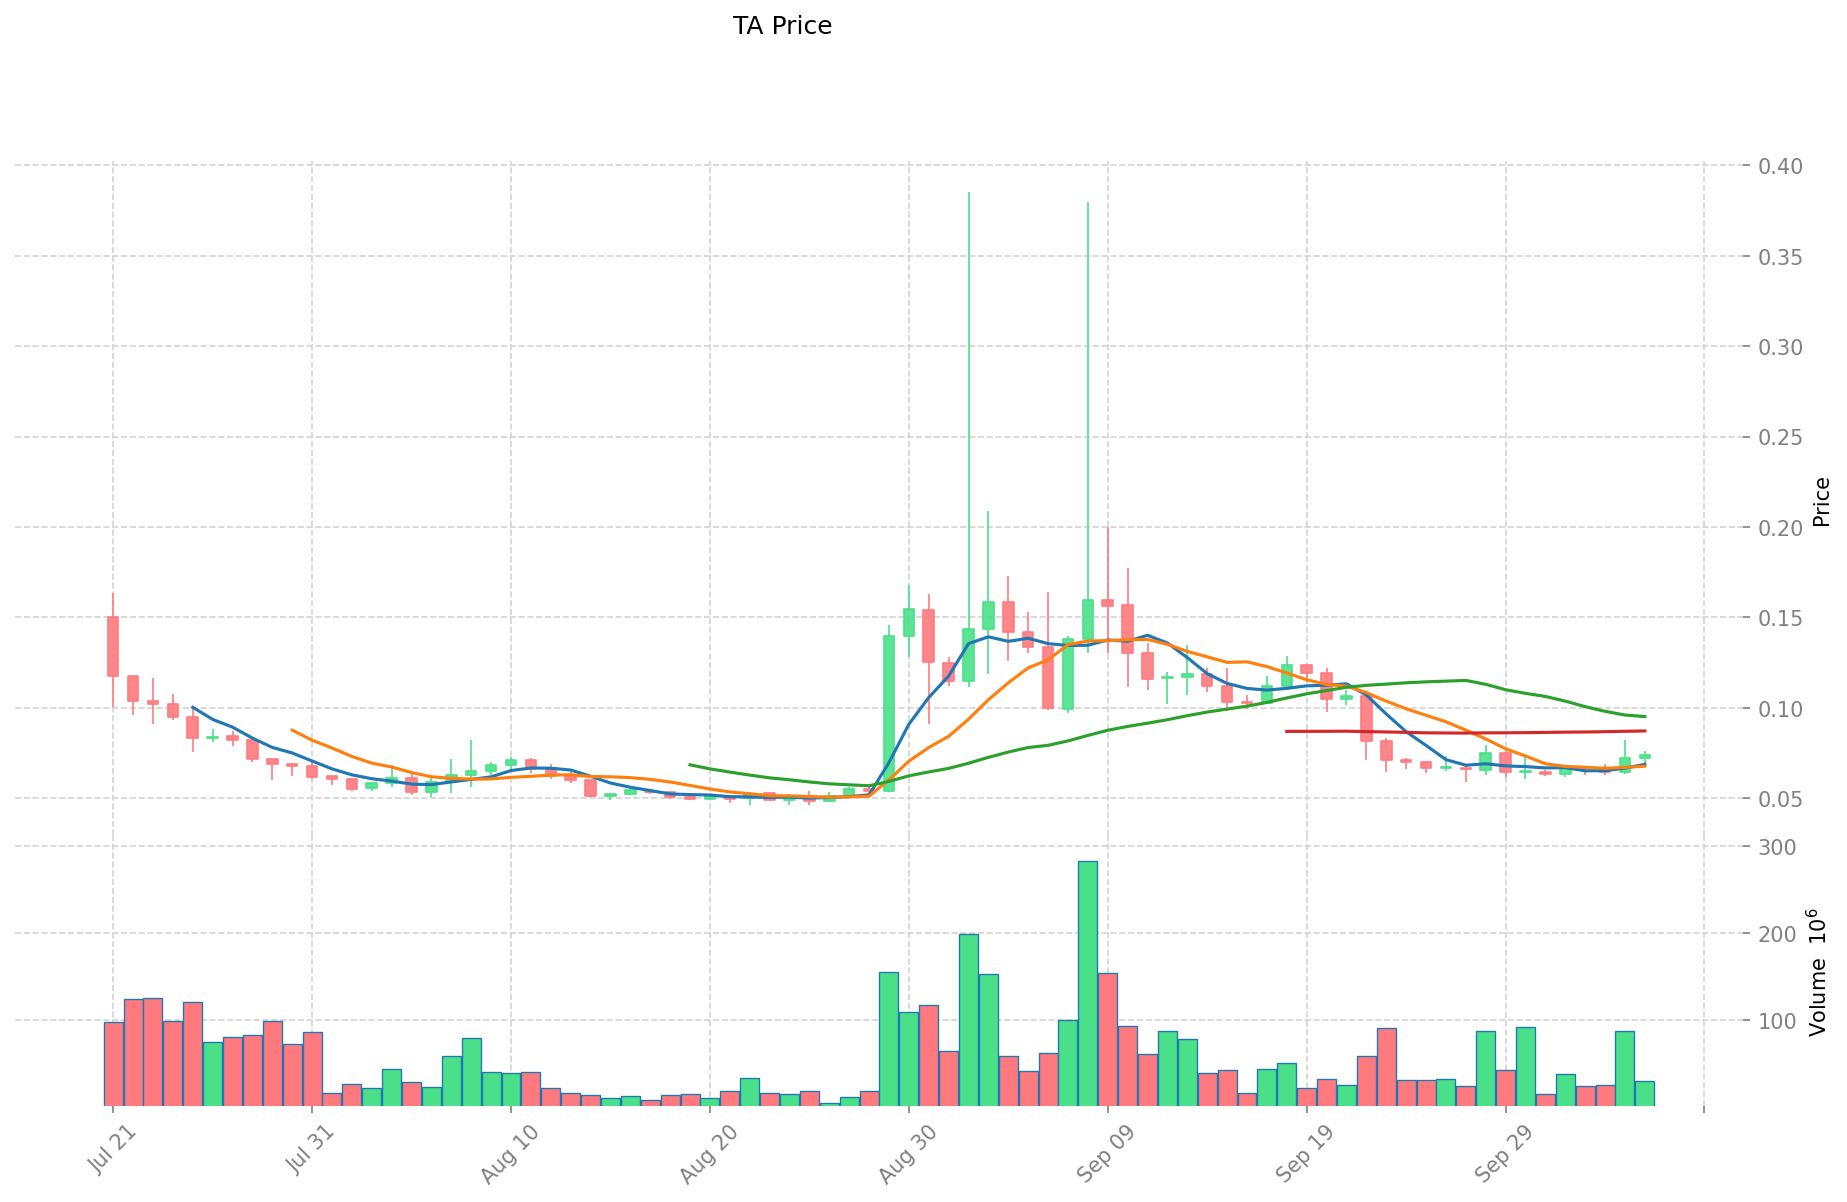
- 2025: TA, $0,1 başlangıç fiyatıyla piyasaya girdi; ilk günlerinde yüksek dalgalanma yaşandı.
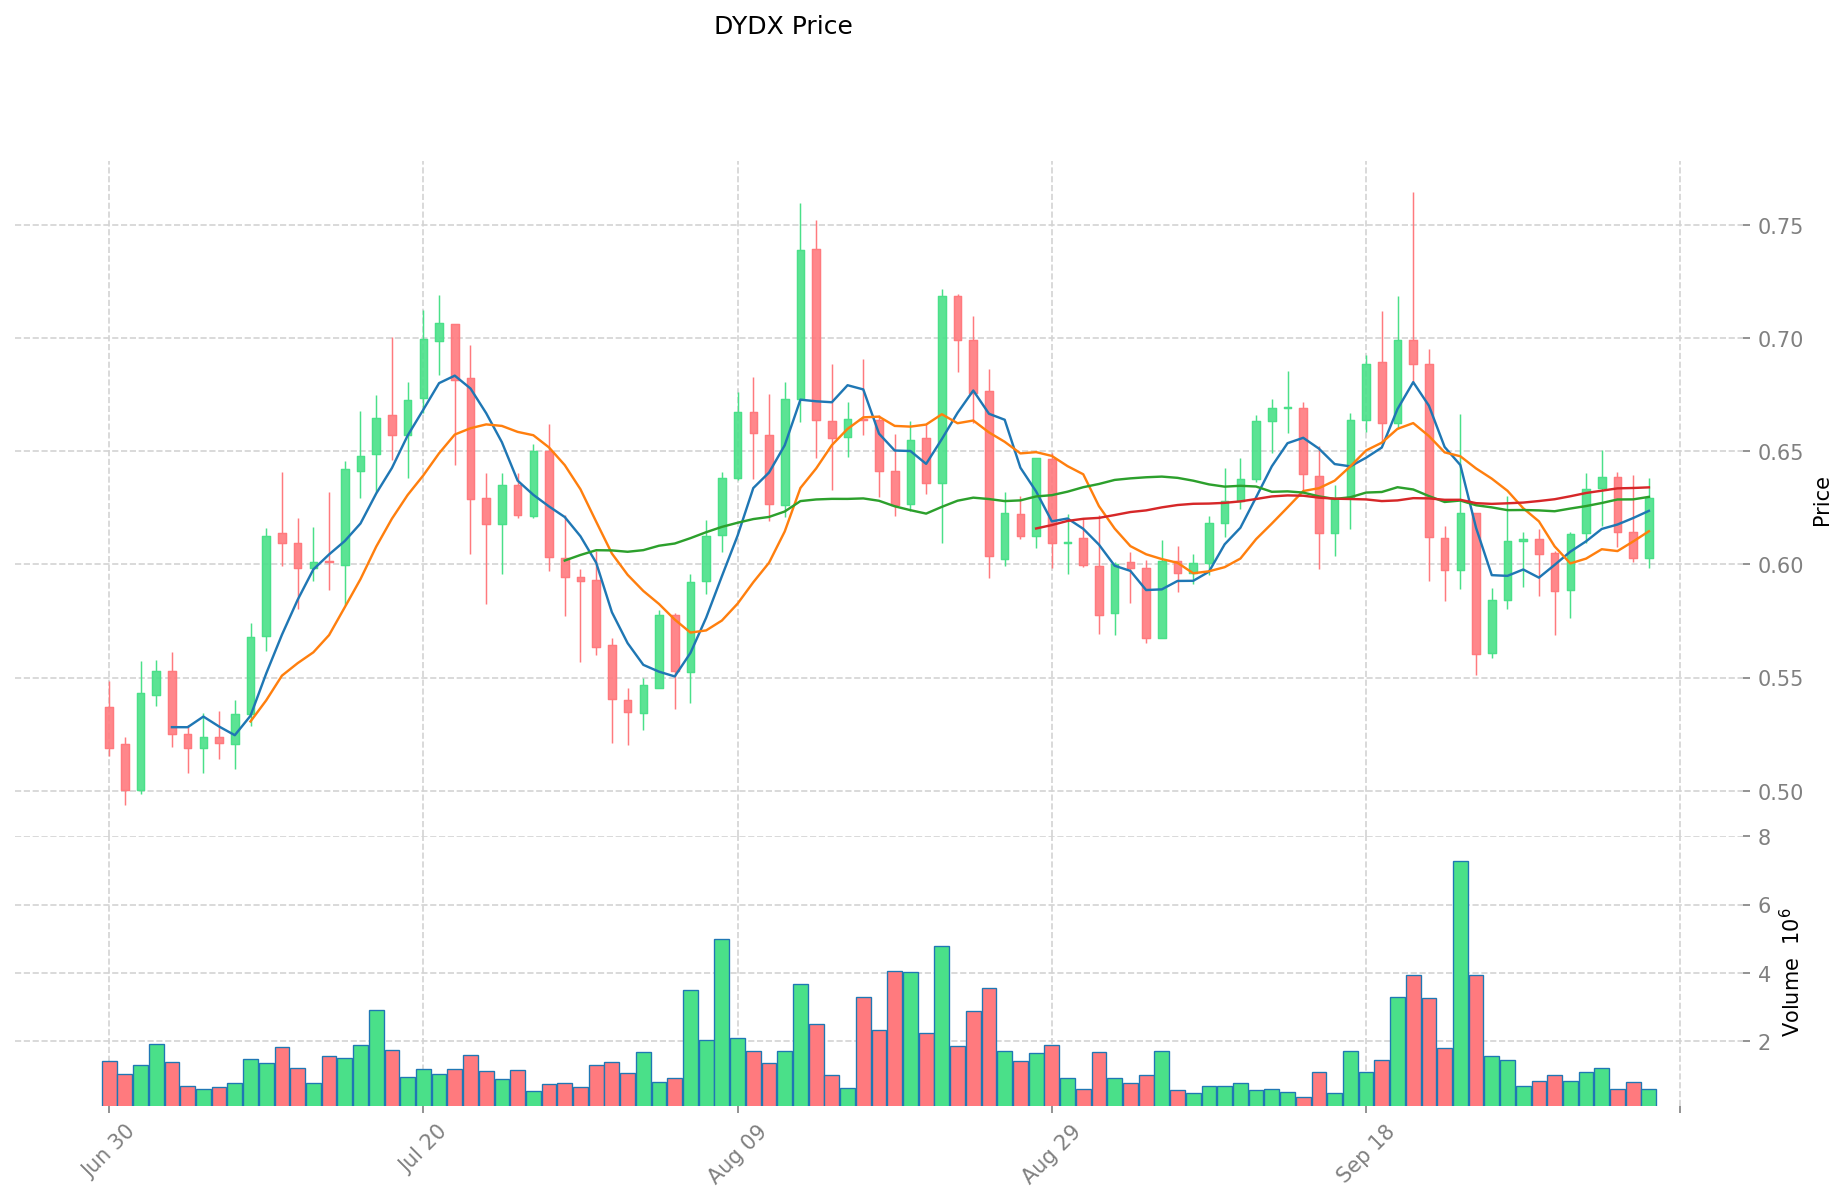
- 2025: DYDX, Mart 2024’teki $4,52’lik zirveden Haziran 2025’te $0,418236’ya düşerek keskin bir değer kaybı yaşadı.
- Karşılaştırma: Son piyasa döngüsünde TA, $0,3854 seviyesine ulaşıp $0,046’ya gerilerken; DYDX daha istikrarlı kalıp $0,5-$0,7 aralığında seyretti.
Güncel Piyasa Durumu (07 Ekim 2025)
- TA güncel fiyat: $0,07251
- DYDX güncel fiyat: $0,6281
- 24 saatlik işlem hacmi: TA $2.258.831,47 ve DYDX $370.952,77
- Piyasa Duyarlılık Endeksi (Korku & Açgözlülük): 70 (Açgözlülük)
Canlı fiyatlar için tıklayın:
- TA güncel fiyatı için Piyasa Fiyatı
- DYDX güncel fiyatı için Piyasa Fiyatı
II. TA ve DYDX Yatırım Değerini Etkileyen Temel Unsurlar
Arz Mekanizmaları Karşılaştırması (Tokenomik)
- dYdX: Borç verme, kaldıraçlı işlem ve sürekli kontratlar gibi kapsamlı fonksiyonlara sahip. Kullanıcı mevduatları, otomatik olarak likidite havuzunu oluşturuyor.
- Piyasa Yapısı: Değer yakalama → sağlam para politikası → para birimi primi → yüksek ekonomik güvenlik. Ücretler ve diğer MEV, değer döngüsünün ilk aşamasını tetikliyor.
Kurumsal Benimsenme ve Piyasa Uygulamaları
- Piyasa Talebi: Küresel perpetual DEX pazarı rekor büyüme dalgası ve rekabet yeniden yapılanması yaşıyor.
- Kullanıcı Büyümesi: dYdX’in kullanıcı tabanındaki artış, platformun değer teklifini doğrudan etkiliyor.
- Düzenleyici Ortam: Farklı ülkelerdeki düzenlemeler, piyasa gelişimi ve benimsenmeyi önemli ölçüde etkiliyor.
Teknik Gelişim ve Ekosistem Oluşturma
- dYdX Teknik Evrimi: StarkEx’ten Cosmos ekosistemine geçiş, platformun teknik ve stratejik konumlanmasında önemli bir dönüm noktası.
- İnovasyon Unsurları: Teknik yenilikler, piyasada farklılaşma ve rekabet avantajı yaratıyor.
- Ekosistem Karşılaştırması: Türev ürünler, kripto piyasasında deneyimli yatırımcıların kaldıraçla "ileri düzey" işlem stratejileri uygulamasını sağlıyor.
Makroekonomik Unsurlar ve Piyasa Döngüleri
- Piyasa Rekabeti: DEX pazarında artan rekabet, değer tekliflerini yeniden şekillendiriyor.
- Teknik Gelişmeler: Sürekli teknik yenilikler, yeni fırsatlar ve riskler doğuruyor.
- Büyüme Eğrisi: Kullanıcı benimseme oranları ve işlem hacmi, uzun vadeli değerlemede anahtar rol oynuyor.
III. 2025-2030 Fiyat Tahmini: TA ve DYDX
Kısa Vadeli Tahmin (2025)
- TA: Muhafazakâr $0,0458-$0,0739 | İyimser $0,0739-$0,0931
- DYDX: Muhafazakâr $0,5284-$0,6290 | İyimser $0,6290-$0,6605
Orta Vadeli Tahmin (2027)
- TA, büyüme fazına geçebilir; öngörülen fiyat aralığı $0,0508-$0,1328
- DYDX, konsolidasyon fazına geçebilir; öngörülen fiyat aralığı $0,7013-$0,9523
- Temel etkenler: Kurumsal sermaye girişi, ETF gelişmeleri, ekosistem büyümesi
Uzun Vadeli Tahmin (2030)
- TA: Temel senaryo $0,1598-$0,1774 | İyimser senaryo $0,1774-$0,1842
- DYDX: Temel senaryo $1,1189-$1,2196 | İyimser senaryo $1,2196-$1,3206
Yasal Uyarı
TA:
| Yıl | Tahmin Edilen En Yüksek Fiyat | Tahmin Edilen Ortalama Fiyat | Tahmin Edilen En Düşük Fiyat | Değişim (%) |
|---|---|---|---|---|
| 2025 | 0,0930762 | 0,07387 | 0,0457994 | 1 |
| 2026 | 0,111853954 | 0,0834731 | 0,060935363 | 15 |
| 2027 | 0,13282239672 | 0,097663527 | 0,05078503404 | 34 |
| 2028 | 0,155577998511 | 0,11524296186 | 0,0656884882602 | 58 |
| 2029 | 0,18415825305228 | 0,1354104801855 | 0,071767554498315 | 86 |
| 2030 | 0,177360646946967 | 0,15978436661889 | 0,126229649628923 | 120 |
DYDX:
| Yıl | Tahmin Edilen En Yüksek Fiyat | Tahmin Edilen Ortalama Fiyat | Tahmin Edilen En Düşük Fiyat | Değişim (%) |
|---|---|---|---|---|
| 2025 | 0,66045 | 0,629 | 0,52836 | 0 |
| 2026 | 0,83169525 | 0,644725 | 0,412624 | 2 |
| 2027 | 0,95229106125 | 0,738210125 | 0,70129961875 | 17 |
| 2028 | 0,98894319395625 | 0,845250593125 | 0,710010498225 | 34 |
| 2029 | 1,3206195266985 | 0,917096893540625 | 0,476890384641125 | 46 |
| 2030 | 1,219555449030323 | 1,118858210119562 | 0,973406642804019 | 78 |
IV. Yatırım Stratejisi Karşılaştırması: TA ve DYDX
Uzun Vadeli ve Kısa Vadeli Yatırım Stratejileri
- TA: Yapay zekâ ve kripto kimlik çözümlerine odaklanan yatırımcılar için uygun
- DYDX: Merkeziyetsiz türev işlemlerine ilgi duyan yatırımcılar için uygun
Risk Yönetimi ve Varlık Dağılımı
- Temkinli yatırımcılar: TA %30, DYDX %70
- Agresif yatırımcılar: TA %60, DYDX %40
- Koruma araçları: Stablecoin tahsisi, opsiyonlar, çapraz para portföyleri
V. Potansiyel Risk Karşılaştırması
Piyasa Riski
- TA: Yeni proje olması nedeniyle yüksek volatiliteye sahip
- DYDX: Genel DeFi piyasasındaki dalgalanmalara maruz kalıyor
Teknik Risk
- TA: Ölçeklenebilirlik ve ağ istikrarı
- DYDX: Akıllı kontrat açıkları ve likidite riskleri
Düzenleyici Risk
- Küresel düzenleyici politikalar her iki token üzerinde farklı etkiler yaratabilir
VI. Sonuç: Hangisi Daha İyi Bir Alım?
📌 Yatırım Değeri Özeti:
- TA avantajları: Yenilikçi AI ve kripto kimlik çözümü, hızla büyüme potansiyeli
- DYDX avantajları: DeFi türevlerinde köklü bir platform, Cosmos ekosistemine geçiş
✅ Yatırım Tavsiyesi:
- Yeni yatırımcılar: DYDX’e daha fazla ağırlık vererek dengeli bir yaklaşım benimseyin
- Deneyimli yatırımcılar: Her iki projede stratejik dağılımla fırsatları değerlendirin
- Kurumsal yatırımcılar: Portföyün farklı segmentleri için DYDX’i DeFi maruziyeti, TA’yı ise yeni teknoloji yatırımı olarak ele alın
⚠️ Risk Uyarısı: Kripto para piyasaları yüksek derecede oynaktır. Bu makale yatırım tavsiyesi niteliği taşımaz. None
VII. Sıkça Sorulan Sorular
S1: TA ile DYDX arasındaki en önemli farklar nedir? C: TA, yapay zekâ ve kripto için güvenilir kimlik ağı oluşturan yeni bir projeyken; DYDX, DeFi alanında yerleşik merkeziyetsiz türev işlem platformudur. TA, 2025’te; DYDX ise 2021’den beri faaliyet göstermektedir.
S2: Son dönemde hangi token daha iyi fiyat performansı sergiledi? C: Son piyasa verilerine göre DYDX, $0,5-$0,7 aralığında daha istikrarlı bir fiyat sergilerken; TA, $0,3854’ten $0,046’ya gerileyerek daha yüksek volatilite gösterdi.
S3: TA ve DYDX’in arz mekanizmaları nasıl karşılaştırılır? C: TA’nın tokenomiğiyle ilgili detaylar sunulmasa da, DYDX borç verme, kaldıraçlı işlem ve perpetual kontratlar gibi kapsamlı işlevler içeriyor. DYDX’te kullanıcı mevduatları otomatik olarak likidite havuzuna dönüşüyor.
S4: Bu tokenlerin yatırım değerini etkileyen ana faktörler nelerdir? C: Kurumsal benimsenme, piyasa uygulamaları, teknik gelişim, ekosistem inşası, makroekonomik faktörler ve piyasa döngüleri öne çıkıyor. DYDX için özellikle kullanıcı büyümesi ve Cosmos ekosistemine geçiş kritik rol oynuyor.
S5: TA ve DYDX için uzun vadeli fiyat öngörüleri nedir? C: 2030 yılına kadar, iyimser senaryoda TA’nın $0,1598-$0,1842; DYDX’in $1,1189-$1,3206 aralığına ulaşması bekleniyor. Ancak bu öngörüler piyasa koşullarına bağlıdır ve finansal tavsiye olarak değerlendirilmemelidir.
S6: Yatırımcılar TA ve DYDX’i değerlendirirken risk yönetimine nasıl yaklaşmalı? C: Temkinli yatırımcılar portföylerinin %30’unu TA’ya, %70’ini DYDX’e ayırabilir; agresif yatırımcılar ise %60 TA ve %40 DYDX tercih edebilir. Hedge için stablecoin tahsisi, opsiyonlar ve çapraz para portföyleri önerilir.
S7: TA ve DYDX yatırımlarında karşılaşılabilecek potansiyel riskler nelerdir? C: Her iki token da piyasa riskine açıktır; TA yeni olması nedeniyle daha yüksek volatilite gösterebilir. Teknik riskler arasında TA için ölçeklenebilirlik ve ağ istikrarı, DYDX içinse akıllı kontrat açıkları bulunur. Düzenleyici riskler ise küresel politikalara göre değişkenlik gösterir.
Share
Content
Giriş: TA ve DYDX Yatırımı Karşılaştırması
I. Fiyat Geçmişi Karşılaştırması ve Güncel Piyasa Durumu
II. TA ve DYDX Yatırım Değerini Etkileyen Temel Unsurlar
III. 2025-2030 Fiyat Tahmini: TA ve DYDX
IV. Yatırım Stratejisi Karşılaştırması: TA ve DYDX
V. Potansiyel Risk Karşılaştırması
VI. Sonuç: Hangisi Daha İyi Bir Alım?
VII. Sıkça Sorulan Sorular
How to Buy Cryptocurrency


Trending Cryptocurrencies


2025'te Kripto Takasını Nasıl Kopyalarım: Yeni Başlayanlar için Bir Rehber

DEAI vs DYDX: Kripto Piyasasında Önde Gelen İki Merkeziyetsiz Alım Satım Platformunun Karşılaştırılması

TAKE vs DYDX: DeFi Ekosisteminde İki Lider Kripto Para Alım-Satım Platformunun Karşılaştırılması
NETMIND ve GMX: Kurumsal Seviyede Kullanıma Yönelik Yeni Nesil Yapay Zeka Altyapı Çözümlerinin Karşılaştırılması

MEFAI'nin yapay zeka tabanlı sistemi, kripto varlıkların ve fon akışının yönetimini nasıl gerçekleştiriyor?

2025 yılında kripto projelerinin geleceği, rekabet analizi sayesinde nasıl yönleniyor?
Kripto Para Borsası Klon Scripti Fiyatlandırmasıyla İlgili En Sık Sorulan Sorular | Sektör Uzmanlarının Değerlendirmeleri