SYNT ve GMX: DeFi Ekosisteminde Sentetik Varlık Platformlarının Karşılaştırmalı Analizi


Giriş: SYNT ve GMX Yatırım Değeri Karşılaştırması
Kripto para piyasasında Synternet ile GMX’in karşılaştırılması, yatırımcıların gündeminden hiç düşmeyen bir başlıktır. Bu iki proje; piyasa değeri sıralaması, kullanım alanları ve fiyat performansı açısından belirgin farklara sahip olmanın yanı sıra, farklı kripto varlık stratejilerini temsil etmektedir.
Synternet (SYNT): Lansmanından itibaren, bütün büyük blokzincirlerde modüler ve birlikte çalışabilir veri altyapısına güç vermesiyle piyasa tarafından kabul gördü.
GMX (GMX): İlk gününden bu yana merkeziyetsiz ve sürdürülebilir bir borsa olarak öne çıkmakta, token’ı hem fayda hem de yönetişim aracı olarak kullanılmaktadır.
Bu makalede, Synternet ile GMX’in yatırım değerini; geçmiş fiyat hareketleri, arz yapısı, kurumsal benimsenme, teknolojik ekosistem ve gelecek öngörüleri ekseninde kapsamlı biçimde analiz edecek, yatırımcıların en çok merak ettiği şu soruya odaklanacağız:
"Şu anda hangisi daha cazip bir yatırım?"
I. Fiyat Geçmişi Karşılaştırması ve Güncel Piyasa Görünümü
SYNT ve GMX Tarihsel Fiyat Hareketleri
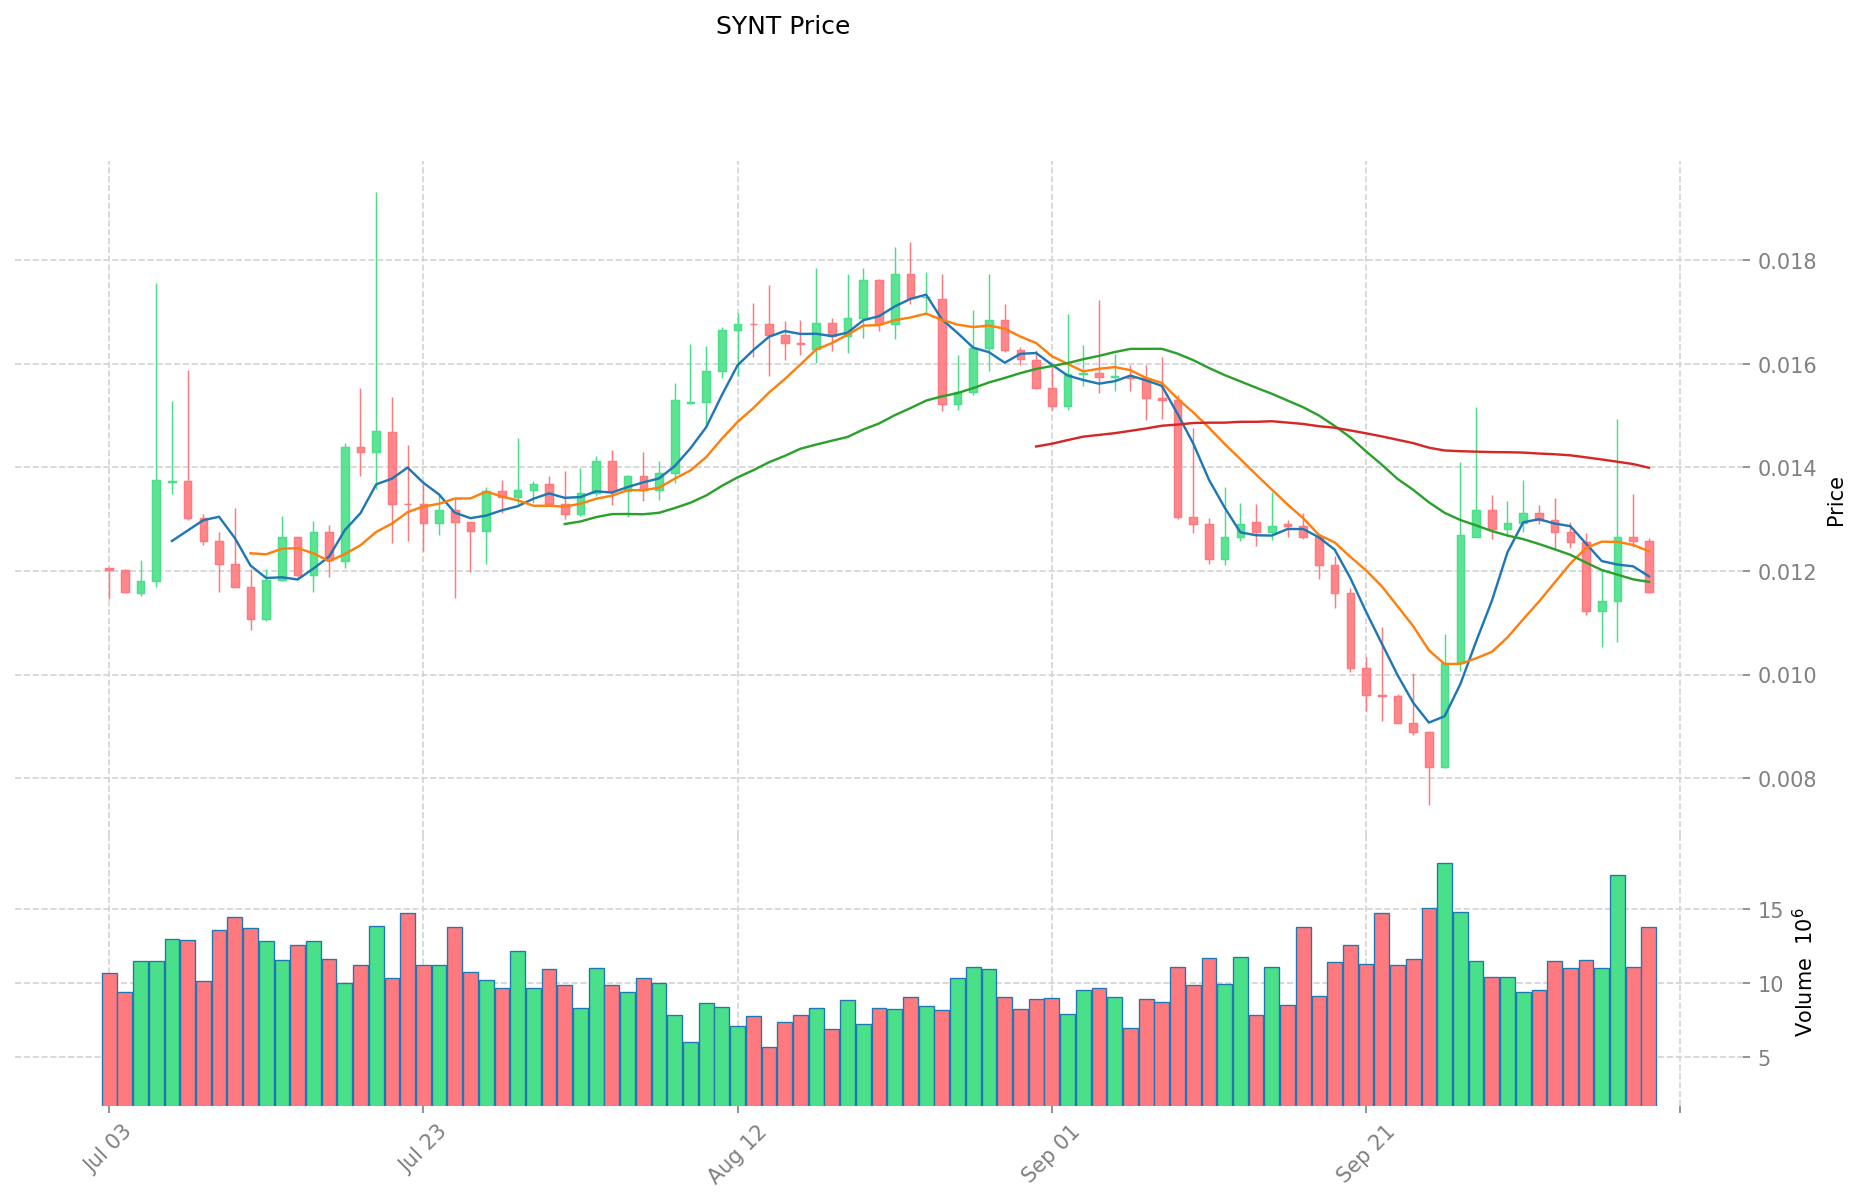
- 2024: SYNT, 25 Temmuz 2024’te 0,09812 $ ile rekor seviyeye ulaştı.
- 2025: SYNT, 25 Eylül 2025’te 0,007474 $ ile en düşük seviyesini gördü.
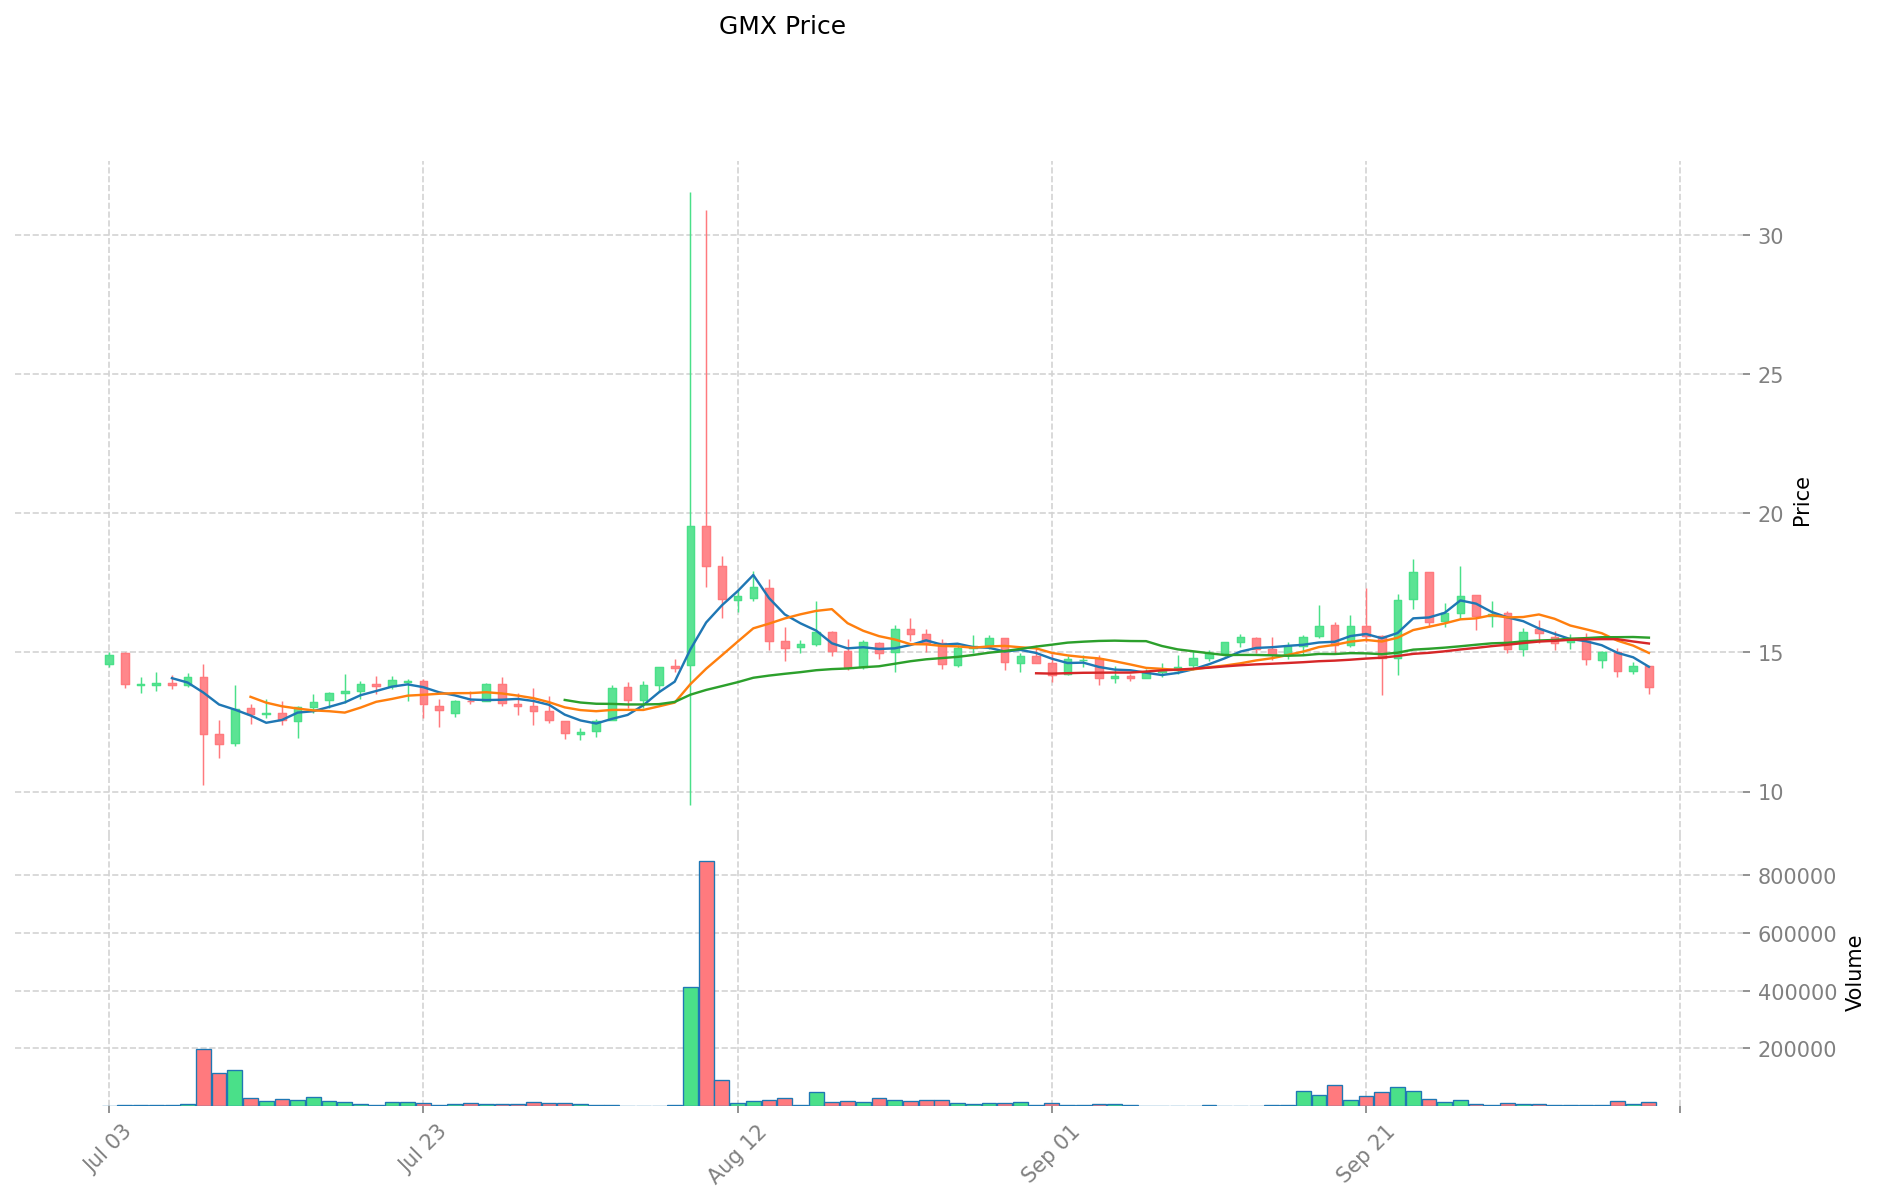
- Karşılaştırmalı analiz: Bu döngüde SYNT, zirveden 0,007474 $’a gerilerken; GMX’in tüm zamanların en yüksek seviyesi 18 Nisan 2023’te 91,07 $ ve en düşük seviyesi 7 Nisan 2025’te 9,61 $ olarak gerçekleşti.
Güncel Piyasa Durumu (10 Ekim 2025)
- SYNT güncel fiyatı: 0,0116 $
- GMX güncel fiyatı: 13,77 $
- 24 saatlik işlem hacmi: SYNT 168.211,998308 $ | GMX 182.944,11878 $
- Piyasa Duyarlılık Endeksi (Korku & Açgözlülük): 70 (Açgözlülük)
Canlı fiyatları görüntülemek için tıklayın:
- SYNT güncel fiyatı için Piyasa Fiyatı
- GMX güncel fiyatı için Piyasa Fiyatı
II. SYNT ve GMX’in Yatırım Değerini Belirleyen Temel Etkenler
Arz Mekanizması Karşılaştırması (Tokenomik)
- SYNT: Ücret yakımı yoluyla deflasyonist, sınırlı arz
- GMX: Sabit maksimum arz, emisyon takvimi ve stake edenlere ücret dağılımı
- 📌 Tarihsel gözlem: Deflasyonist mekanizma, yoğun kullanımda fiyatı yukarı çekebilir; emisyon ise yeterli protokol gelirine eşlik etmezse değeri seyreltebilir.
Kurumsal Benimsenme ve Piyasa Uygulamaları
- Kurumsal portföyler: GMX, güçlü türev işlem hacmi ve gelir modeliyle daha fazla kurumsal ilgi çekiyor
- Kurumsal kullanım: GMX, türev işlem platformlarında daha yaygın; SYNT ise erken benimsenme aşamasında
- Düzenleyici yaklaşım: Her iki proje de türev işlemler alanında yasal belirsizlikle karşı karşıya; GMX’in geçmişi daha fazla açıklık sağlıyor
Teknolojik Gelişim ve Ekosistem Kurulumu
- SYNT teknik güncellemeleri: Düşük kayma ve düşük tasfiye riskiyle sentetik varlık ihraç platformu
- GMX teknik gelişimi: Gerçek getiri dağıtımı ve çoklu zincir varlığıyla sürekli işlem platformu
- Ekosistem karşılaştırması: GMX, işlem hacmi bakımından daha gelişmiş; SYNT ise yenilikçi sentetik varlık erişimi sunuyor
Makroekonomik Etkenler ve Piyasa Döngüleri
- Enflasyonist ortamda performans: GMX, volatil piyasada ücret gelirleriyle daha iyi koruma sunabilir
- Makro para politikası: Faiz artışları, türev işlem hacmini etkileyerek her iki protokolün performansını etkiler
- Jeopolitik faktörler: Sınır aşan işlem kısıtlamaları, SYNT ve GMX gibi merkeziyetsiz türev platformlarına avantaj sağlayabilir
III. 2025-2030 Fiyat Öngörüleri: SYNT vs GMX
Kısa Vadeli Tahmin (2025)
- SYNT: Temkinli 0,0059109 $ - 0,01159 $ | İyimser 0,01159 $ - 0,015067 $
- GMX: Temkinli 12,393 $ - 13,77 $ | İyimser 13,77 $ - 18,3141 $
Orta Vadeli Tahmin (2027)
- SYNT, büyüme sürecine girebilir; tahmini fiyat aralığı 0,0097964475 $ - 0,0204325905 $
- GMX, istikrarlı büyüme fazına geçebilir; tahmini fiyat aralığı 16,56181242 $ - 21,95835804 $
- Temel etkenler: Kurumsal sermaye girişi, ETF, ekosistem gelişimi
Uzun Vadeli Tahmin (2030)
- SYNT: Temel senaryo 0,024355315496531 $ - 0,033610335385213 $ | İyimser senaryo 0,033610335385213 $+
- GMX: Temel senaryo 21,833232616728 $ - 28,16487007557912 $ | İyimser senaryo 28,16487007557912 $+
Uyarı: Yukarıdaki tahminler, geçmiş veriler ve piyasa analizine dayanır. Kripto para piyasası aşırı oynak ve öngörülemezdir. Bu tahminler finansal tavsiye değildir. Yatırım kararı öncesinde mutlaka kendi araştırmanızı yapınız.
SYNT:
| Yıl | Tahmini En Yüksek Fiyat | Tahmini Ortalama Fiyat | Tahmini En Düşük Fiyat | Değişim Oranı |
|---|---|---|---|---|
| 2025 | 0,015067 | 0,01159 | 0,0059109 | 0 |
| 2026 | 0,01466135 | 0,0133285 | 0,011862365 | 15 |
| 2027 | 0,0204325905 | 0,013994925 | 0,0097964475 | 20 |
| 2028 | 0,0249599487375 | 0,01721375775 | 0,0160087947075 | 48 |
| 2029 | 0,027623777749312 | 0,02108685324375 | 0,011176032219187 | 81 |
| 2030 | 0,033610335385213 | 0,024355315496531 | 0,023137549721704 | 110 |
GMX:
| Yıl | Tahmini En Yüksek Fiyat | Tahmini Ortalama Fiyat | Tahmini En Düşük Fiyat | Değişim Oranı |
|---|---|---|---|---|
| 2025 | 18,3141 | 13,77 | 12,393 | 0 |
| 2026 | 21,175506 | 16,04205 | 9,1439685 | 16 |
| 2027 | 21,95835804 | 18,608778 | 16,56181242 | 35 |
| 2028 | 21,7034177814 | 20,28356802 | 15,8211830556 | 47 |
| 2029 | 22,672972332756 | 20,9934929007 | 12,59609574042 | 52 |
| 2030 | 28,16487007557912 | 21,833232616728 | 12,88160724386952 | 58 |
IV. Yatırım Stratejisi Karşılaştırması: SYNT vs GMX
Uzun Vadeli vs Kısa Vadeli Strateji
- SYNT: Sentetik varlık erişimi ve ekosistem potansiyeline odaklananlar için uygun
- GMX: Yerleşik türev işlem platformu ve gelir odaklı yatırımcılar için uygun
Risk Yönetimi ve Varlık Dağılımı
- Temkinli yatırımcılar: SYNT için %30, GMX için %70
- Agresif yatırımcılar: SYNT için %60, GMX için %40
- Korumalı portföy: Stabilcoin tahsisi, opsiyonlar, çapraz para portföyü
V. Potansiyel Risk Analizi
Piyasa Riski
- SYNT: Düşük piyasa değeri ve hacmi nedeniyle yüksek oynaklık riski
- GMX: Genel kripto trendlerine ve türev piyasası algısına maruz kalma
Teknik Risk
- SYNT: Geliştirme aşamasında ölçeklenebilirlik ve ağ istikrarı
- GMX: Akıllı kontrat açıkları, oracle güvenilirliği
Düzenleyici Risk
- Küresel regülasyonlar iki projeyi de etkileyebilir; GMX’in türev platformu nedeniyle denetim riski daha yüksektir
VI. Sonuç: Hangisi Daha Avantajlı?
📌 Yatırım Değeri Özeti:
- SYNT’nin avantajları: Yenilikçi sentetik varlık platformu, yüksek büyüme potansiyeli
- GMX’in avantajları: Kanıtlanmış gelir modeli, güçlü kurumsal ilgi
✅ Yatırım Tavsiyesi:
- Yeni yatırımcılar: GMX’in geçmiş performansı nedeniyle portföyde daha yüksek ağırlıkla dengeli strateji benimseyebilir
- Deneyimli yatırımcılar: SYNT’nin büyüme potansiyelini değerlendirip GMX’i portföylerinde tutabilir
- Kurumsal yatırımcılar: GMX’in platformunu analiz ederek, sentetik varlıklara çeşitlendirme için SYNT’yi değerlendirebilir
⚠️ Risk Uyarısı: Kripto para piyasaları son derece oynaktır. Bu içerik yatırım tavsiyesi değildir. None
VII. Sıkça Sorulan Sorular
S1: SYNT ve GMX’in ana farkları nelerdir? C: SYNT, düşük kayma ve minimum tasfiye riskiyle sentetik varlık ihraç platformudur. GMX ise gerçek getiri dağıtımı ve çoklu zincir entegrasyonu ile tanınan, sürekli işlem platformudur. SYNT, deflasyonist mekanizmalı sınırlı arza sahipken; GMX sabit maksimum arz ve emisyon takvimine sahiptir.
S2: Tarihsel olarak hangi token daha iyi performans gösterdi? C: GMX, tarihsel olarak daha güçlü performans sergiledi. Tüm zamanların zirvesi 91,07 $ ile 18 Nisan 2023’te gerçekleşti. SYNT’nin zirvesi 0,09812 $ ile 25 Temmuz 2024’te kaydedildi. GMX’in güncel fiyatı ve işlem hacmi de daha yüksektir.
S3: SYNT ve GMX’in kurumsal benimsenme ve piyasa uygulamaları nasıl karşılaştırılır? C: GMX, yerleşik türev işlem hacmi ve gelir modeliyle daha fazla kurumsal ilgi görürken, türev platformlarda daha yaygın kullanılıyor. SYNT ise henüz erken benimsenme aşamasında.
S4: SYNT ve GMX için kısa vadeli fiyat tahminleri nedir? C: 2025 için SYNT’de temkinli tahmin aralığı 0,0059109 $ - 0,01159 $, iyimser aralık ise 0,01159 $ - 0,015067 $. GMX için temkinli tahmin 12,393 $ - 13,77 $, iyimser tahmin 13,77 $ - 18,3141 $’dır.
S5: Uzun vadeli fiyat tahminleri nasıl karşılaştırılır? C: 2030’da SYNT için temel senaryo 0,024355315496531 $ - 0,033610335385213 $; iyimser senaryoda daha yüksek potansiyel öngörülmektedir. GMX için temel senaryo 21,833232616728 $ - 28,16487007557912 $; iyimser senaryoda daha yüksek seviyeler mümkündür.
S6: SYNT ve GMX yatırımlarında başlıca riskler nelerdir? C: SYNT; düşük piyasa değeri ve hacmi nedeniyle yüksek oynaklık, ayrıca erken geliştirme aşamasında ölçeklenebilirlik ve ağ istikrarı riski taşır. GMX; kripto genel trendlerine, türev piyasası algısına maruz kalır ve akıllı kontrat, oracle güvenilirliği gibi teknik riskler barındırır. Her ikisi de regülasyon riskleriyle karşı karşıyadır, GMX’in platformu nedeniyle denetim riski daha fazladır.
S7: Farklı yatırımcı tipleri için hangi token öne çıkar? C: Yeni yatırımcılar, GMX’in yerleşik geçmişine ağırlık vererek dengeli dağılımı tercih edebilir. Deneyimli yatırımcılar, SYNT’nin büyüme potansiyelini değerlendirirken portföylerinde GMX’i de tutabilir. Kurumsal yatırımcılar, GMX’in platformunu analiz edip sentetik varlık çeşitliliği için SYNT’ye yönlenebilir.
Share
Content
Giriş: SYNT ve GMX Yatırım Değeri Karşılaştırması
I. Fiyat Geçmişi Karşılaştırması ve Güncel Piyasa Görünümü
II. SYNT ve GMX’in Yatırım Değerini Belirleyen Temel Etkenler
III. 2025-2030 Fiyat Öngörüleri: SYNT vs GMX
IV. Yatırım Stratejisi Karşılaştırması: SYNT vs GMX
V. Potansiyel Risk Analizi
VI. Sonuç: Hangisi Daha Avantajlı?
VII. Sıkça Sorulan Sorular
How to Buy Cryptocurrency


Trending Cryptocurrencies


Aerodrome Finance (AERO) iyi bir yatırım mı?: Bu DeFi protokolünün potansiyelini ve risklerini değerlendirmek

Polytrade (TRADE) iyi bir yatırım mı?: Bu DeFi borç verme platformu tokeninin potansiyelini ve risklerini inceliyoruz

PancakeSwap (CAKE) iyi bir yatırım olarak değerlendirilebilir mi?: Popüler DeFi tokenının sunduğu potansiyel ve taşıdığı riskler üzerine analiz
GateToken (GT) iyi bir yatırım mı?: Kripto para piyasasında bu borsa tokeninin potansiyelini ve risklerini değerlendirmek
GMX (GMX) iyi bir yatırım mı?: Bu merkeziyetsiz perpetual borsa tokeninin potansiyelini inceliyoruz

DYDX vs BNB: Merkeziyetsiz Finans Ekosistemindeki İki Büyük Oyuncunun Karşılaştırılması
Bitcoin fiyatı pound cinsinden, traderların şimdi bilmesi gerekenler.

Kripto para piyasasında Pivot Noktası ticaret stratejilerini ustalıkla kullanmak
Yeni Madenciler İçin En İyi Kripto Madencilik Platformları
Blockchain’de Kriptografik Hashleme’nin Temelleri: Kapsamlı Bir Rehber

Ethereum fiyatı düşüşte, bu uzun vadeli long aç fırsatı olabilir.
