SQUID vs UNI: Getiri Tarımı Amaçlı İki Önde Gelen DeFi Protokolünün Karşılaştırılması


Giriş: SQUID ve UNI Yatırım Karşılaştırması
Kripto para piyasasında SQUID ve UNI karşılaştırması, yatırımcıların göz ardı edemeyeceği bir başlıktır. Bu iki varlık; piyasa değeri sıralaması, kullanım alanları ve fiyat performansı gibi önemli noktalarda farklılık gösterirken, aynı zamanda kripto varlıklarının konumlandırılması bakımından da farklı yaklaşımlar sunuyor.
SQUID (SQUID): 2021 yılında Binance Smart Chain (BSC) üzerinde meme token olarak piyasaya sürülmesinden bu yana piyasa tarafından tanındı.
UNI (UNI): 2020’de piyasaya çıkan UNI, Ethereum blokzinciri üzerinde inşa edilen ilk otomatik piyasa yapıcı protokol olarak öne çıkmakta olup, küresel ölçekte en yüksek işlem hacmi ve piyasa değerine sahip kripto varlıklardan biridir.
Bu makalede, SQUID ve UNI’nin yatırım değeri karşılaştırması kapsamlı olarak ele alınacak; geçmiş fiyat hareketleri, arz mekanizmaları, kurumsal benimseme, teknolojik ekosistemler ve gelecek öngörüleri odağında incelenecek; yatırımcıların en çok merak ettiği şu sorunun yanıtı aranacaktır:
"Şu anda hangisi daha avantajlı alım?" İşte verilen şablon ve bilgiler ışığında hazırlanan analiz:
I. Fiyat Geçmişi Karşılaştırması ve Mevcut Piyasa Durumu
SQUID ve UNI Fiyat Geçmişi
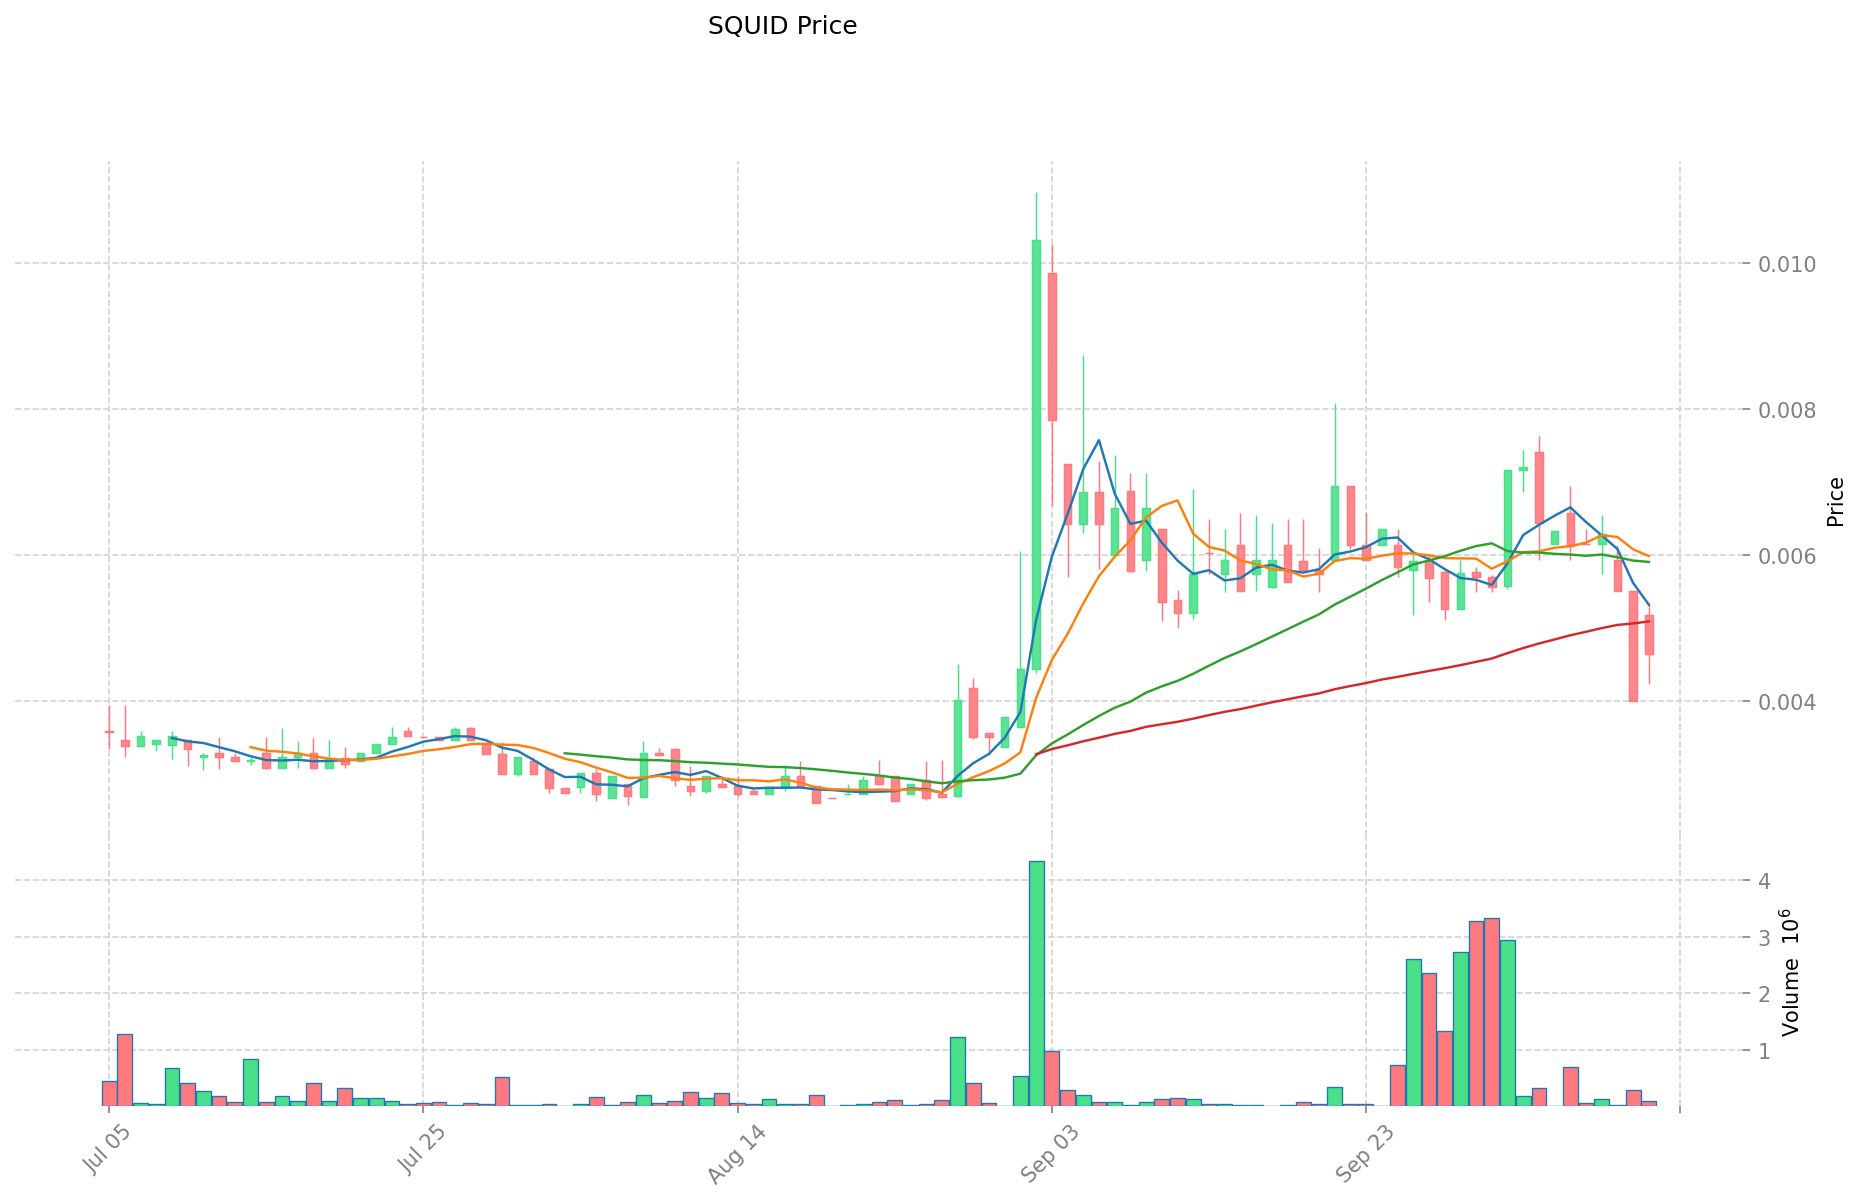
- 2021: SQUID, rug pull vakası nedeniyle fiyatında ani bir yükseliş ve ardından sert bir düşüş yaşadı; değeri 2.861 dolardan neredeyse sıfıra indi.
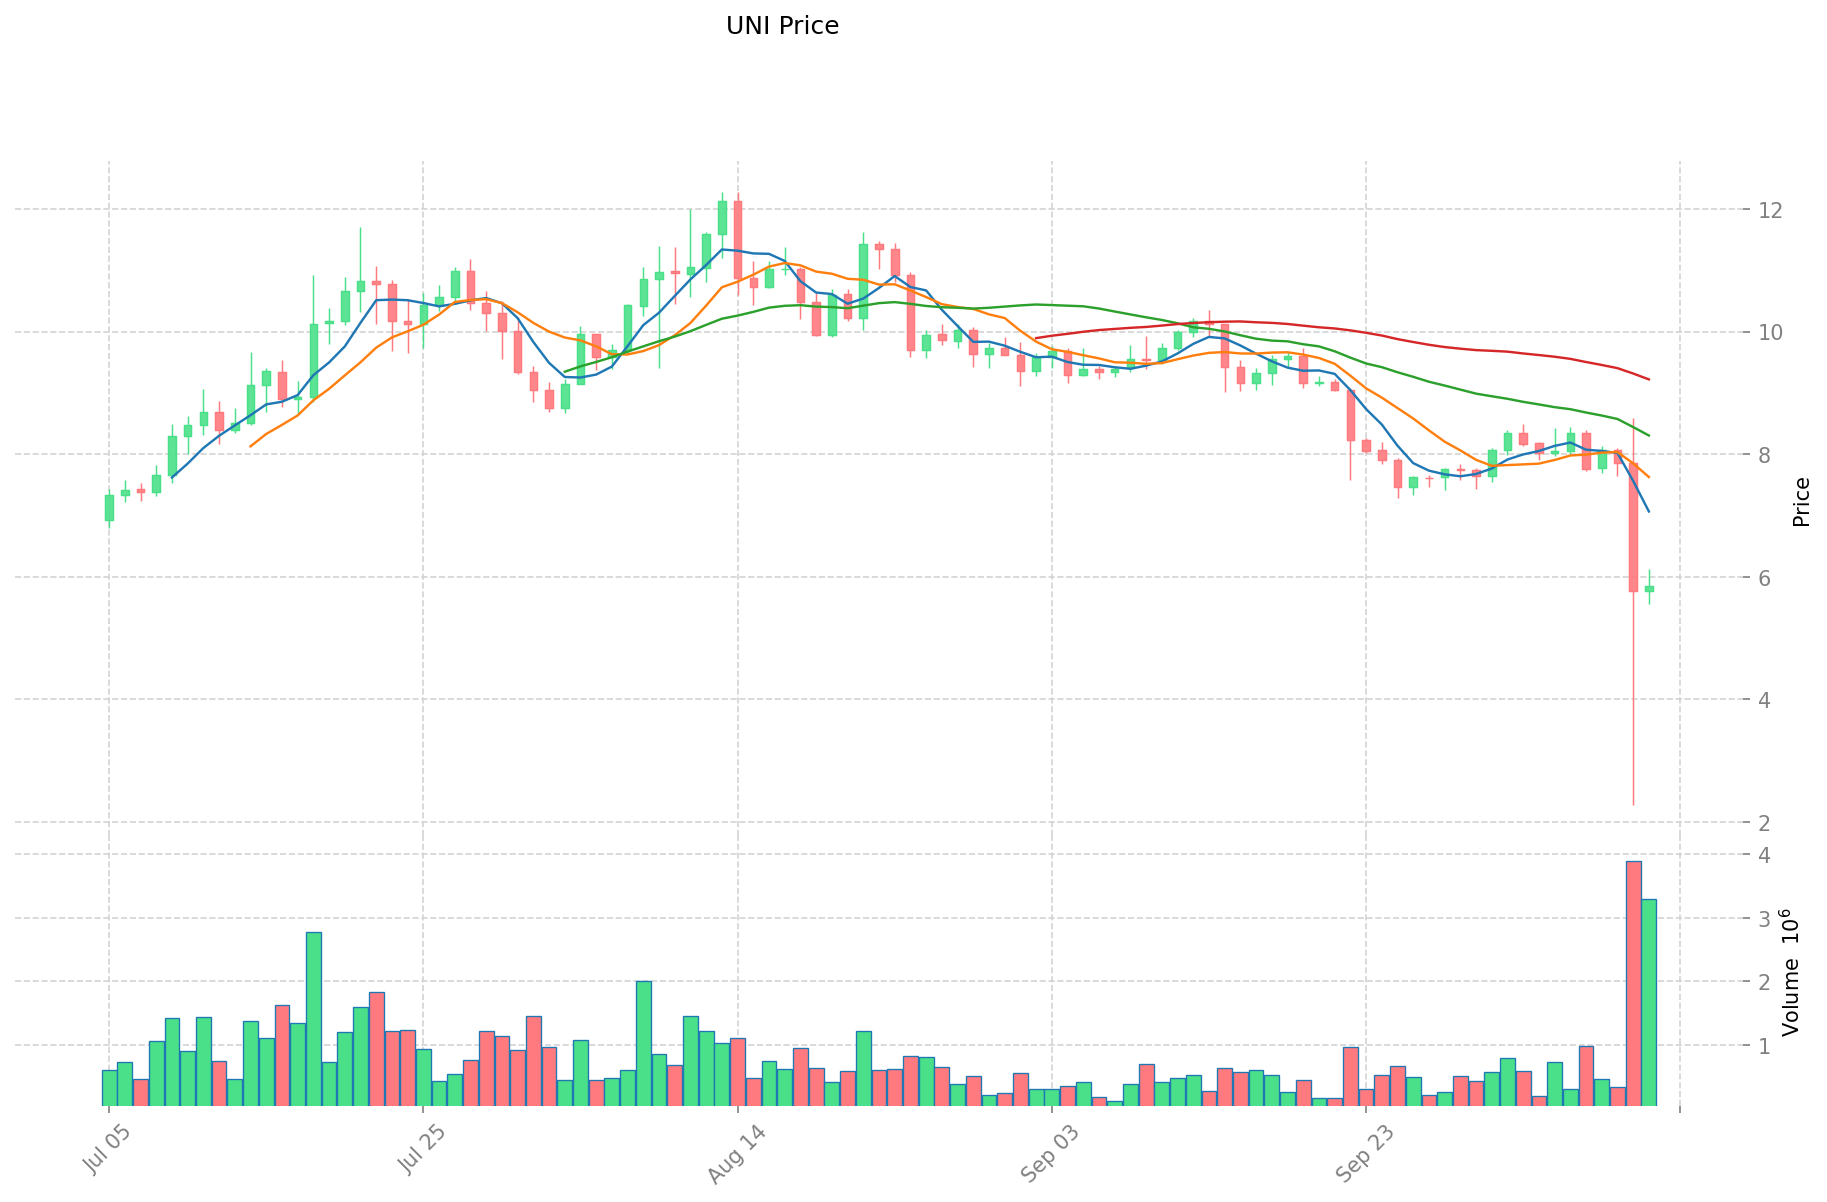
- 2021: UNI, merkeziyetsiz finans (DeFi) ilgiyle Mayıs ayında tüm zamanların zirvesi olan 44,92 dolara çıktı.
- Karşılaştırmalı analiz: 2021 kripto boğa piyasasında SQUID aşırı yükselip tamamen değer kaybederken, UNI piyasa dalgalanmalarına rağmen istikrarlı kalarak değerini büyük ölçüde korudu.
Mevcut Piyasa Durumu (12 Ekim 2025)
- SQUID güncel fiyatı: 0,004644 $
- UNI güncel fiyatı: 5,84 $
- 24 saatlik işlem hacmi: SQUID 244.196 $ – UNI 17.883.317 $
- Piyasa Duyarlılık Endeksi (Korku & Açgözlülük): 24 (Aşırı Korku)
Canlı fiyatları görmek için tıklayın:
- SQUID anlık fiyatı için Piyasa Fiyatı
- UNI anlık fiyatı için Piyasa Fiyatı
II. SQUID ve UNI Yatırım Değerine Etki Eden Temel Faktörler
Arz Mekanizması Karşılaştırması (Tokenomik)
- SQUID: Arz mekanizması hakkında sınırlı bilgi bulunuyor
- UNI: Arz mekanizması hakkında sınırlı bilgi bulunuyor
- 📌 Tarihsel örüntü: Arz mekanizmalarının fiyat döngülerine etkisine dair yeterli veri yok.
Kurumsal Benimseme ve Piyasa Uygulamaları
- Kurumsal portföyler: Tercihler hakkında yeterli veri bulunmuyor
- Kurum kullanımı: Sınır ötesi ödeme, mutabakat ve portföy uygulamalarına ilişkin bilgi yetersiz
- Düzenleyici tutum: Çeşitli ülkelerdeki düzenleyici yaklaşımlar konusunda sınırlı bilgi mevcut
Teknolojik Gelişim ve Ekosistem Oluşumu
- SQUID teknik güncellemeleri: Gelişim sürecine dair yeterli veri yok
- UNI teknik gelişimi: Gelişim sürecine dair yeterli veri yok
- Ekosistem karşılaştırması: DeFi, NFT, ödeme ve akıllı sözleşme uygulamaları hakkında sınırlı bilgi
Makroekonomik Faktörler ve Piyasa Döngüleri
- Enflasyonist ortamlarda performans: Anti-enflasyon özellikleri hakkında sınırlı veri var
- Makroekonomik para politikaları: Faiz ve USD endeksinin bu tokenlar üzerindeki etkisi hakkında yeterli bilgi yok
- Jeopolitik faktörler: Sınır ötesi işlem talebi ve uluslararası gelişmelere ilişkin veri eksikliği
III. 2025-2030 Fiyat Tahmini: SQUID ve UNI
Kısa Vadeli Tahmin (2025)
- SQUID: Muhafazakar 0,00320436 $ – 0,004644 $ | İyimser 0,004644 $ – 0,00552636 $
- UNI: Muhafazakar 3,82005 $ – 5,877 $ | İyimser 5,877 $ – 6,40593 $
Orta Vadeli Tahmin (2027)
- SQUID’in büyüme fazına geçmesi halinde beklenen fiyat aralığı: 0,004280704524 $ – 0,008251213068 $
- UNI’nin büyüme fazına geçmesi halinde beklenen fiyat aralığı: 5,390977977 $ – 8,29926872775 $
- Ana etkenler: Kurumsal sermaye girişi, ETF’ler, ekosistem gelişimi
Uzun Vadeli Tahmin (2030)
- SQUID: Temel senaryo 0,004782986572851 $ – 0,008857382542317 $ | İyimser senaryo 0,008857382542317 $ – 0,010806006701626 $
- UNI: Temel senaryo 5,688758008837134 $ – 9,8082034635123 $ | İyimser senaryo 9,8082034635123 $ – 12,162172294755252 $
Feragatname
SQUID:
| Yıl | Tahmini En Yüksek Fiyat | Tahmini Ortalama Fiyat | Tahmini En Düşük Fiyat | Değişim Oranı |
|---|---|---|---|---|
| 2025 | 0,00552636 | 0,004644 | 0,00320436 | 0 |
| 2026 | 0,0073226592 | 0,00508518 | 0,0026951454 | 9 |
| 2027 | 0,008251213068 | 0,0062039196 | 0,004280704524 | 33 |
| 2028 | 0,0083117012841 | 0,007227566334 | 0,00592660439388 | 55 |
| 2029 | 0,009945131275584 | 0,00776963380905 | 0,004273298594977 | 67 |
| 2030 | 0,010806006701626 | 0,008857382542317 | 0,004782986572851 | 90 |
UNI:
| Yıl | Tahmini En Yüksek Fiyat | Tahmini Ortalama Fiyat | Tahmini En Düşük Fiyat | Değişim Oranı |
|---|---|---|---|---|
| 2025 | 6,40593 | 5,877 | 3,82005 | 0 |
| 2026 | 8,04531915 | 6,141465 | 5,7729771 | 5 |
| 2027 | 8,29926872775 | 7,093392075 | 5,390977977 | 21 |
| 2028 | 8,927743265595 | 7,696330401375 | 7,46544048933375 | 31 |
| 2029 | 11,3043700935396 | 8,312036833485 | 4,8209813634213 | 42 |
| 2030 | 12,162172294755252 | 9,8082034635123 | 5,688758008837134 | 67 |
IV. Yatırım Stratejisi Karşılaştırması: SQUID ve UNI
Uzun Vadeli ve Kısa Vadeli Yatırım Stratejileri
- SQUID: Potansiyel meme token getirisi arayan yüksek risk toleranslı yatırımcılar için uygundur
- UNI: DeFi ekosisteminin büyümesi ve yönetişim katılımıyla ilgilenen yatırımcılar için uygundur
Risk Yönetimi ve Varlık Dağılımı
- Temkinli yatırımcılar: SQUID %0 – UNI %5
- Agresif yatırımcılar: SQUID %1 – UNI %10
- Koruma araçları: Stablecoin tahsisi, opsiyonlar, çapraz döviz portföyleri
V. Potansiyel Risk Karşılaştırması
Piyasa Riski
- SQUID: Aşırı oynaklık ve ani fiyat çöküşü riski taşır
- UNI: Genel kripto piyasa eğilimleri ve DeFi sektör performansından etkilenir
Teknik Risk
- SQUID: Akıllı sözleşme açıkları ve olası yeni istismar riskleri
- UNI: Ethereum’da ölçeklenebilirlik sorunları ve ağ tıkanıklığı
Düzenleyici Risk
- Küresel düzenleyici politikalar her iki token üzerinde farklı etkilere yol açabilir; UNI, DeFi alanındaki görünürlüğü nedeniyle daha fazla denetime tabi olabilir
VI. Sonuç: Hangisi Daha Avantajlı Alım?
📌 Yatırım Değeri Özeti:
- SQUID avantajları: Yüksek risk, yüksek getiri potansiyeliyle spekülatif yatırımcılar için cazip
- UNI avantajları: DeFi’de yerleşik konum, yönetişim hakları ve geniş ekosistem
✅ Yatırım Tavsiyesi:
- Yeni başlayan yatırımcılar: Daha köklü ve düşük riskli bir proje arıyorsanız UNI’yi düşünün
- Deneyimli yatırımcılar: Yüksek risk fırsatları arıyorsanız portföyde küçük bir SQUID payı tutabilir, UNI’ye ağırlık verebilirsiniz
- Kurumsal yatırımcılar: Piyasadaki köklü varlığı ve DeFi ekosistemindeki rolü nedeniyle UNI’ye odaklanın
⚠️ Risk Uyarısı: Kripto para piyasasında yüksek dalgalanma riski bulunur; bu içerik yatırım tavsiyesi değildir. None
VII. Sıkça Sorulan Sorular
S1: SQUID ve UNI arasındaki temel farklar nelerdir? C: SQUID, Binance Smart Chain üzerinde meme token olarak işlem görürken; UNI, Ethereum’daki Uniswap merkeziyetsiz borsasının yönetişim token’ıdır. UNI, daha büyük piyasa değerine, daha yüksek işlem hacmine ve DeFi ekosisteminde köklü konuma sahiptir.
S2: Hangi token tarihsel olarak daha fazla fiyat istikrarı gösterdi? C: UNI, SQUID’e kıyasla daha istikrarlı fiyat performansı sergiledi. UNI dalgalanmalara rağmen değerini korudu; SQUID ise 2021’de rug pull sonrası ani bir yükseliş ve çöküş yaşadı.
S3: SQUID ve UNI’nin güncel fiyatları ve işlem hacimleri nedir? C: 12 Ekim 2025 tarihi itibarıyla SQUID’in fiyatı 0,004644 $ ve 24 saatlik işlem hacmi 244.196 $’dır. UNI’nin fiyatı 5,84 $ ve 24 saatlik işlem hacmi 17.883.317 $’dır.
S4: SQUID ve UNI yatırım stratejileri nasıl farklılık gösteriyor? C: SQUID, yüksek risk toleransı olan ve meme token potansiyeli arayan yatırımcılar için uygundur. UNI ise DeFi ekosisteminin büyümesi ve yönetişim katılımı isteyenler için daha uygundur. Temkinli yatırımcılar portföylerinde SQUID’e %0, UNI’ye %5 ayırabilirken; agresif yatırımcılar SQUID’e %1, UNI’ye %10 ayırabilir.
S5: SQUID ve UNI yatırımlarındaki ana riskler nelerdir? C: SQUID aşırı oynaklık ve ani fiyat çöküşü riski taşır. UNI ise kripto piyasasının genel eğilimlerinden ve DeFi sektörünün performansından etkilenir. Her ikisi de düzenleyici risklerle karşı karşıyadır; UNI, DeFi’deki görünürlüğü nedeniyle daha fazla incelemeye tabi olabilir.
S6: 2030 yılına kadar SQUID ve UNI için uzun vadeli fiyat tahminleri nedir? C: SQUID için temel senaryo 0,004782986572851 $ – 0,008857382542317 $ arası, iyimser senaryo ise 0,010806006701626 $’a kadar çıkabilir. UNI için temel senaryo 5,688758008837134 $ – 9,8082034635123 $ arası, iyimser senaryo ise 12,162172294755252 $’a kadar çıkabilir.
Share
Content
Giriş: SQUID ve UNI Yatırım Karşılaştırması
I. Fiyat Geçmişi Karşılaştırması ve Mevcut Piyasa Durumu
II. SQUID ve UNI Yatırım Değerine Etki Eden Temel Faktörler
III. 2025-2030 Fiyat Tahmini: SQUID ve UNI
IV. Yatırım Stratejisi Karşılaştırması: SQUID ve UNI
V. Potansiyel Risk Karşılaştırması
VI. Sonuç: Hangisi Daha Avantajlı Alım?
VII. Sıkça Sorulan Sorular
How to Buy Cryptocurrency


Trending Cryptocurrencies


2025 PUMP Fiyat Tahmini: Kripto Para Yatırımcılarına Yönelik Piyasa Trendleri ve Büyüme Potansiyelinin Analizi
RichQUACK (QUACK) Yatırım İçin Uygun mu? 2024'te Bu Meme Token'ın Potansiyeli ve Risklerinin Değerlendirilmesi

WOJAK vs SNX: Modern kripto piyasalarında meme kültürü ile sentetik varlık protokollerinin mücadelesi

PEPE vs AAVE: Kripto Arenasında Meme Coin'ler ve DeFi Devleri Arasındaki Rekabet

PEPE Coin'un Temel Özelliklerinin 2025'teki Geleceği Ne Olacak?
SPX ve LRC: Dalgalı Piyasa Koşullarında Performans ve Yatırım Potansiyelinin Karşılaştırılması

Dropee Günlük Kombinasyonu 11 Aralık 2025
Tomarket Günlük Kombinasyonu 11 Aralık 2025

Merkeziyetsiz Finans'ta Geçici Kayıp Nedir?

Kripto Parada Çifte Harcama: Önleme Stratejileri

Kripto Ticaretinde Wyckoff Yönteminin Anlaşılması