SNEK vs SOL: DeFi Ekosisteminde Blockchain Liderliği Yarışı

Giriş: SNEK ve SOL Yatırımı Karşılaştırması
Kripto para piyasasında SNEK ile SOL arasındaki kıyaslama, yatırımcılar için kaçınılmaz bir gündemdir. İki varlık, piyasa değeri sıralaması, kullanım alanları ve fiyat performansı bakımından belirgin farklılıklar gösterirken, aynı zamanda kripto para evreninde farklı pozisyonları temsil eder.
SNEK (SNEK): 2023’te piyasaya sürülmesinden bu yana, Web3 dünyasında kültürel bir kripto hareketi ve ikon olarak kabul görmüştür.
Solana (SOL): 2017’den beri yüksek performanslı bir blockchain protokolü olarak öne çıkmış, en yüksek küresel işlem hacmine ve piyasa değerine sahip kripto paralardan biri haline gelmiştir.
Bu makale, SNEK ile SOL’un yatırım değerini tarihsel fiyat eğilimleri, arz mekanizmaları, kurumsal benimseme, teknolojik ekosistemler ve gelecek öngörüleri açısından kapsamlı biçimde analiz ederek, yatırımcıların en çok merak ettiği şu soruya odaklanacaktır:
"Şu anda hangisi daha avantajlı bir alım fırsatı?"
I. Fiyat Geçmişi Karşılaştırması ve Güncel Piyasa Durumu
SNEK (Coin A) ve SOL (Coin B) Tarihsel Fiyat Eğilimleri
- 2023: SNEK, Cardano ekosisteminde piyasaya çıktı; yeni bir meme coin olarak fiyatı yüksek oynaklık gösterdi.
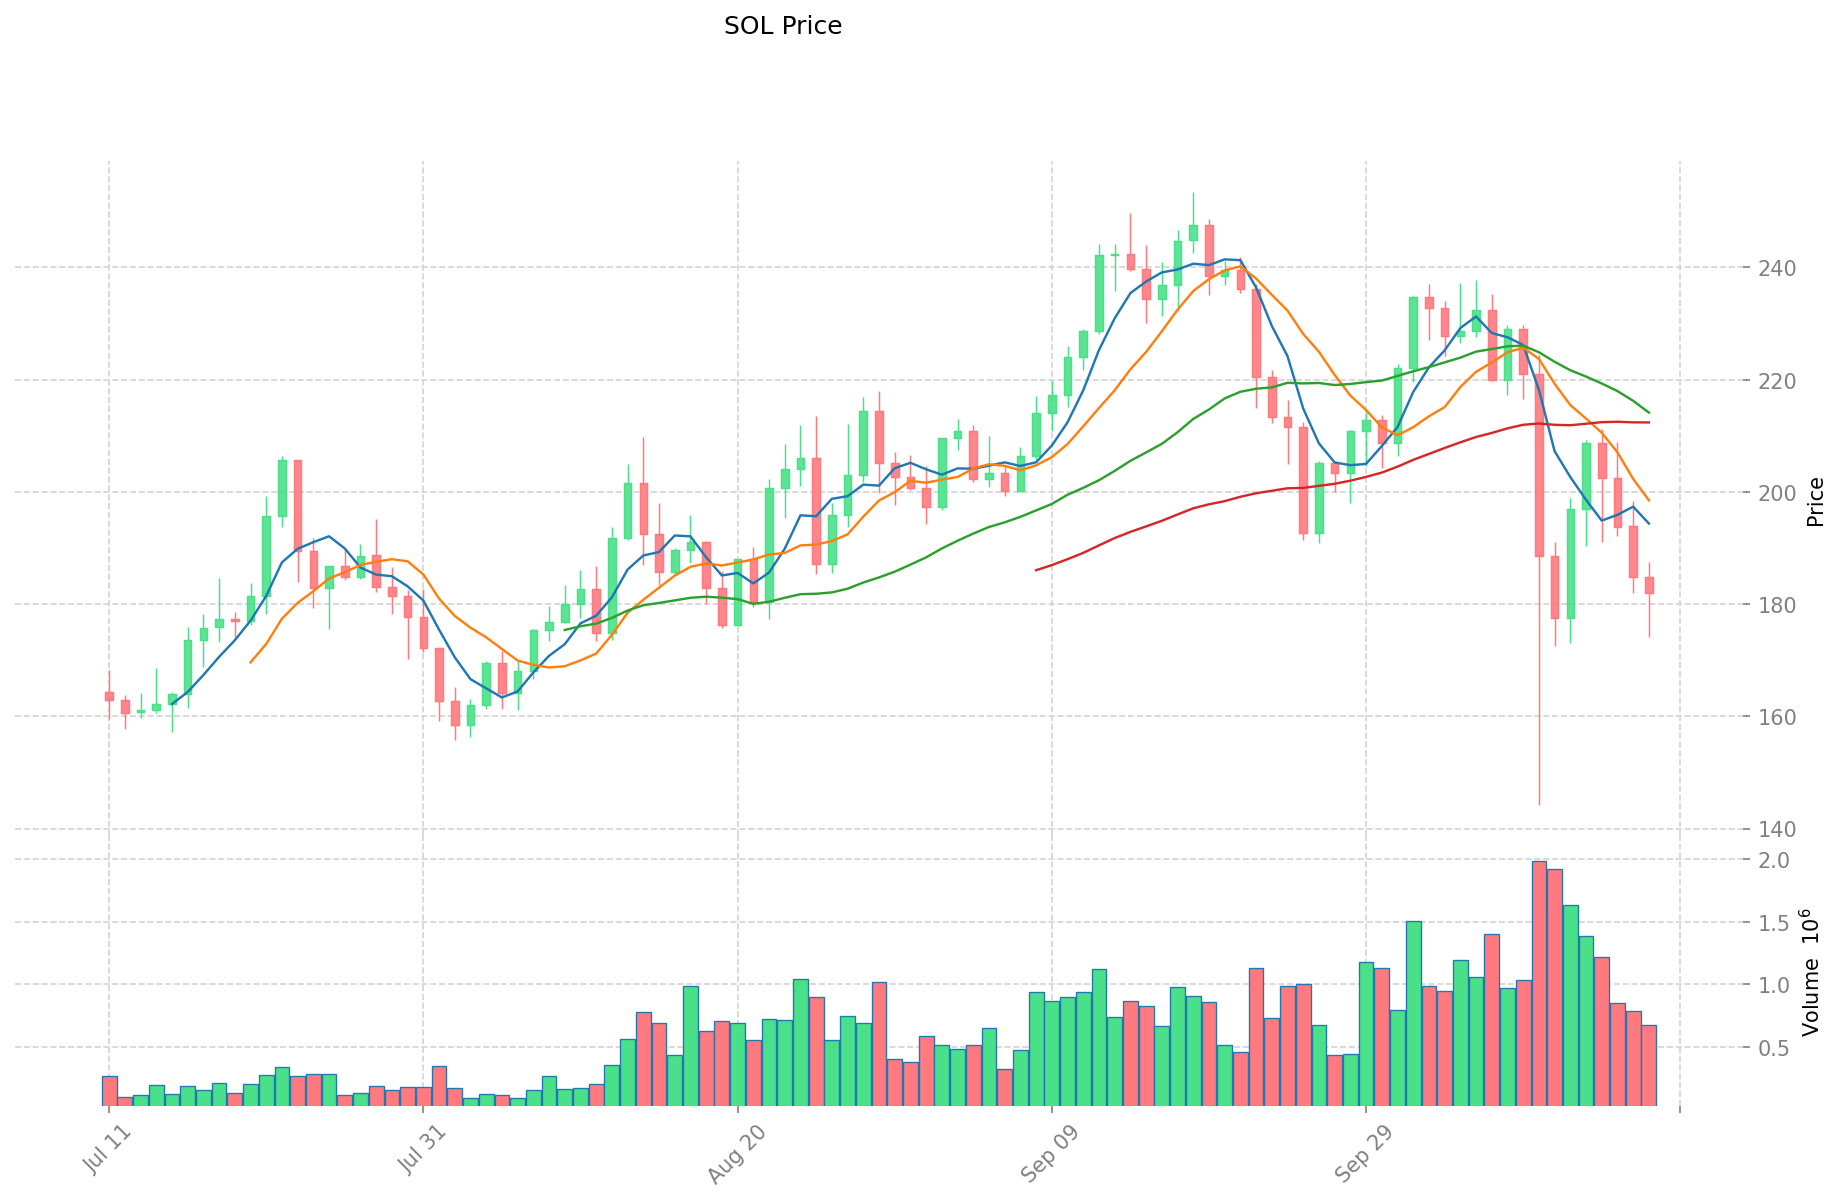
- 2024: SOL, benimsemenin ve ekosistemin büyümesiyle 19 Ocak 2025’te 293,31 $ ile tüm zamanların zirvesine ulaştı.
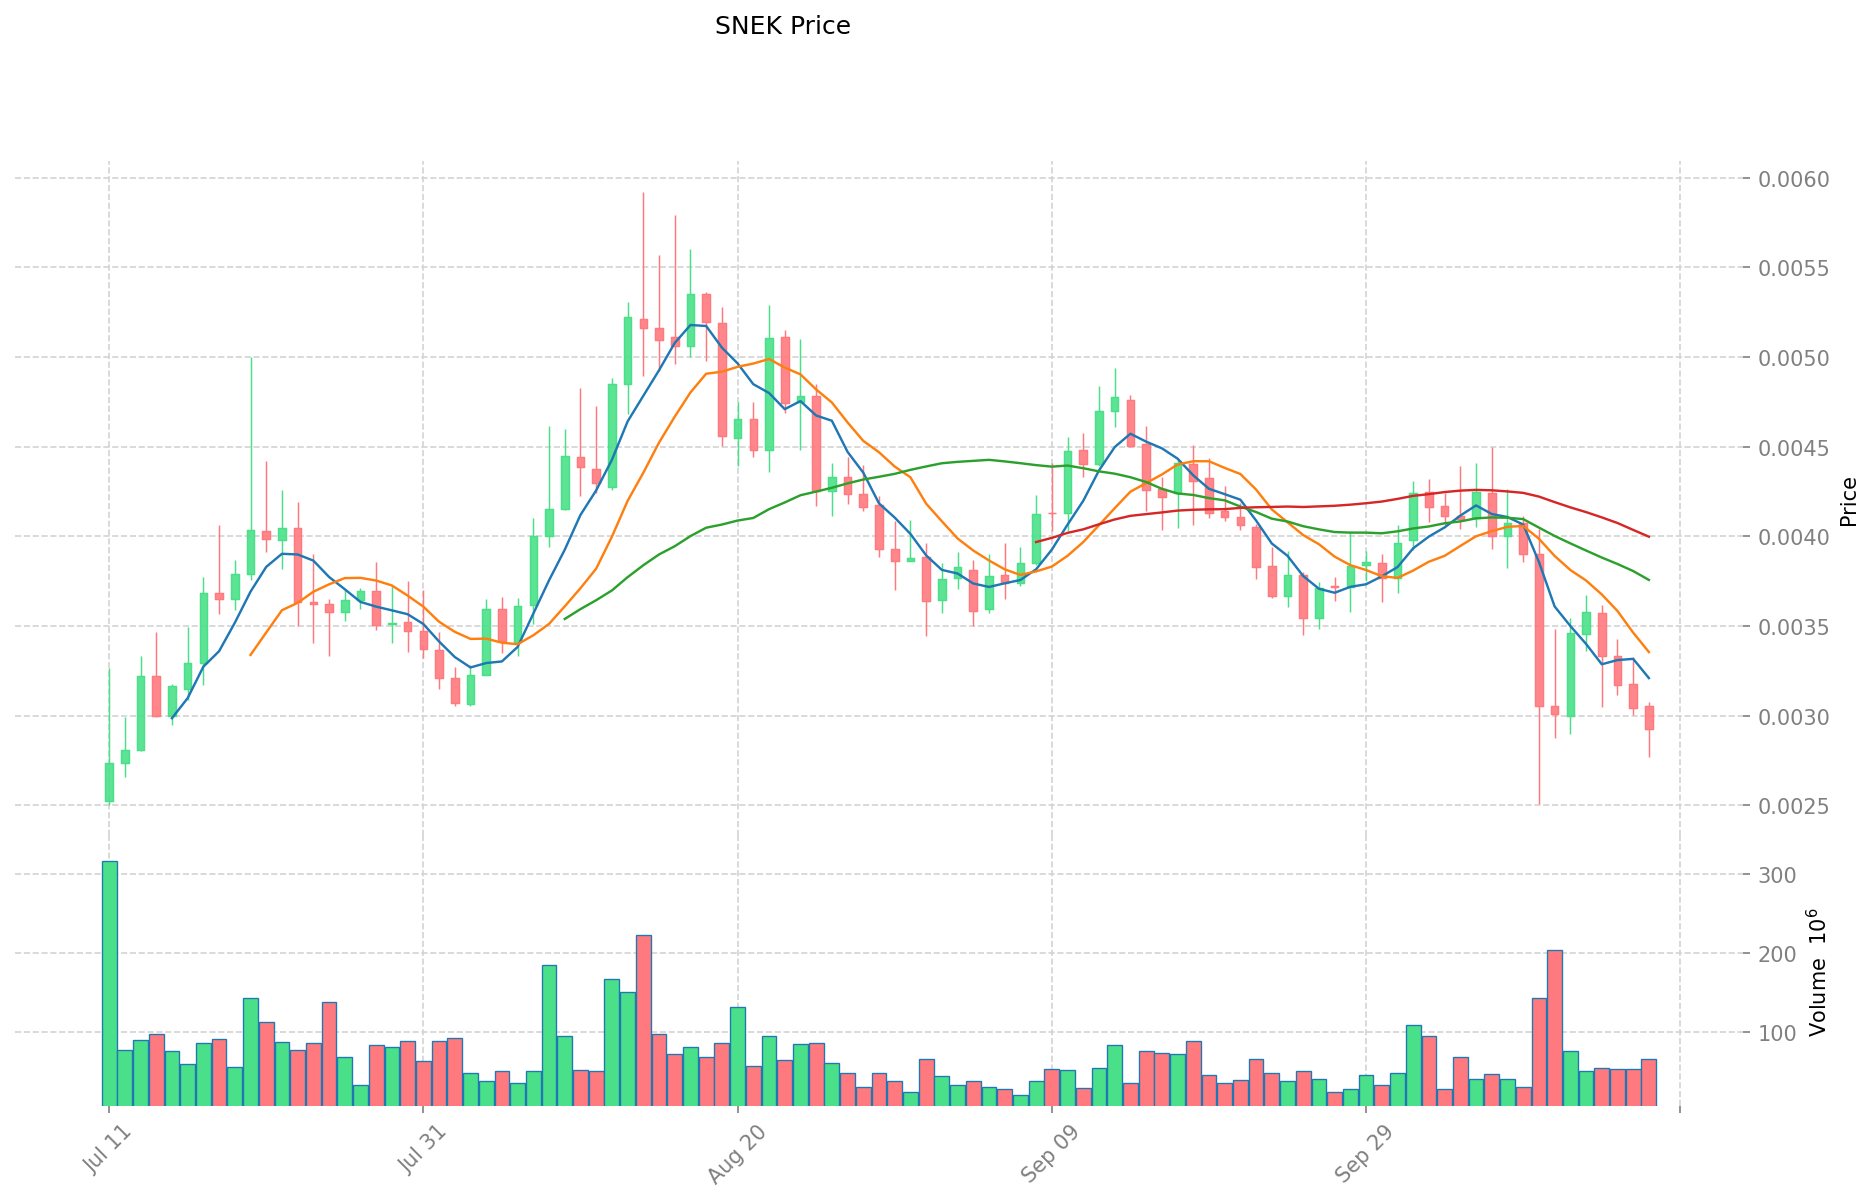
- Karşılaştırmalı analiz: Son piyasa döngüsünde SNEK, en düşük seviyesi olan 0,0001 $’dan en yükseği olan 0,0097 $’a yükselirken, SOL daha istikrarlı bir seyirle piyasa değeri açısından ilk 10’da yerini korudu.
Güncel Piyasa Durumu (18 Ekim 2025)
- SNEK güncel fiyatı: 0,0029353 $
- SOL güncel fiyatı: 182,66 $
- 24 saatlik işlem hacmi: SNEK 187.225,59 $ – SOL 120.812.636,78 $
- Piyasa Duyarlılığı Endeksi (Korku & Açgözlülük): 23 (Aşırı Korku)
Anlık fiyatları görüntülemek için tıklayın:
- SNEK güncel fiyatı için Piyasa Fiyatı
- SOL güncel fiyatı için Piyasa Fiyatı
II. SNEK ve SOL Yatırım Değerini Etkileyen Temel Faktörler
Arz Mekanizması Karşılaştırması (Tokenomik)
- SNEK: Toplam 1.000.000.000 sabit arz ve sürekli yakım mekanizmasıyla deflasyonist model
- SOL: Başlangıçta %8 enflasyonla başlayıp, zaman içinde %1,5 uzun vadeli enflasyona inen dezenflasyonist model
- 📌 Tarihsel örnek: SNEK gibi deflasyonist tokenlar zamanla kıtlık değeri yaratırken, SOL’un kontrollü enflasyonu ağ güvenliği ve katılımını destekler, seyrelme etkisi azalır.
Kurumsal Benimseme ve Piyasa Kullanımları
- Kurumsal varlıklar: SOL, Alameda Research, Multicoin Capital ve FTX Ventures gibi büyük fonlardan daha fazla destek aldı
- Kurumsal benimseme: SOL, ödeme, oyun ve finansal hizmetlerde daha geniş uygulama alanına sahip; SNEK ise kurumsal kullanımını henüz geliştiriyor
- Regülasyon tutumları: SOL, piyasa görünürlüğü sebebiyle daha yoğun düzenleyici denetime tabi; SNEK ise yeni bir varlık olarak daha düşük regülasyon riski taşıyor
Teknik Gelişim ve Ekosistem Oluşumu
- SNEK teknik güncellemesi: Cardano’nun eUTXO modeliyle düşük işlem maliyeti ve yüksek güvenlik avantajı
- SOL teknik gelişimi: Proof of History konsensüs mekanizmasının sürekli iyileştirilmesi, ölçeklenebilirlik ve işlem hacmine odaklanıyor
- Ekosistem karşılaştırması: SOL, DeFi, NFT ve dApp’lerde 2 milyar $’dan fazla kilitli varlık ile daha olgun bir ekosisteme sahip; SNEK ise Cardano altyapısını kullanarak kendi ekosistemini inşa ediyor
Makroekonomik Faktörler ve Piyasa Döngüleri
- Enflasyon döneminde performans: SOL, köklü piyasa konumu sayesinde enflasyon zamanlarında daha istikrarlı performans gösterdi
- Para politikası etkileri: Her iki varlık da faiz değişimlerine duyarlı; SOL tarihi olarak geleneksel piyasalarla daha güçlü korelasyon gösterdi
- Jeopolitik faktörler: SOL’un uluslararası yaygınlığı, belirsizlik dönemlerinde daha güçlü likidite sağlarken, SNEK yeni alternatif yatırım olarak öne çıkabilir
III. 2025-2030 Fiyat Tahmini: SNEK ve SOL
Kısa Vadeli Tahmin (2025)
- SNEK: Muhafazakâr 0,002536746 $ – 0,0029158 $ | İyimser 0,0029158 $ – 0,003994646 $
- SOL: Muhafazakâr 148,1733 $ – 182,93 $ | İyimser 182,93 $ – 206,7109 $
Orta Vadeli Tahmin (2027)
- SNEK büyüme aşamasına geçebilir, tahmini fiyat aralığı 0,0024649560882 $ – 0,0052274068767 $
- SOL boğa piyasasına girebilir, tahmini fiyat aralığı 166,68837702 $ – 335,79252762 $
- Temel belirleyiciler: Kurumsal sermaye akışı, ETF, ekosistem gelişimi
Uzun Vadeli Tahmin (2030)
- SNEK: Temel senaryo 0,006578097096166 $ – 0,009669802731365 $ | İyimser senaryo 0,009669802731365 $
- SOL: Temel senaryo 362,11917513729375 $ – 477,99731118122775 $ | İyimser senaryo 477,99731118122775 $
Yasal Uyarı: Bu analiz yalnızca bilgilendirme amaçlıdır; yatırım tavsiyesi değildir. Kripto para piyasaları çok dalgalı ve öngörülemezdir. Yatırım kararı öncesinde mutlaka kendi araştırmanızı yapınız.
SNEK:
| Yıl | Tahmini En Yüksek | Tahmini Ortalama | Tahmini En Düşük | Değişim (%) |
|---|---|---|---|---|
| 2025 | 0,003994646 | 0,0029158 | 0,002536746 | 0 |
| 2026 | 0,00504462558 | 0,003455223 | 0,00245320833 | 17 |
| 2027 | 0,0052274068767 | 0,00424992429 | 0,0024649560882 | 44 |
| 2028 | 0,00582855866752 | 0,00473866558335 | 0,003743545810846 | 61 |
| 2029 | 0,007872582066898 | 0,005283612125435 | 0,003223003396515 | 80 |
| 2030 | 0,009669802731365 | 0,006578097096166 | 0,004407325054431 | 124 |
SOL:
| Yıl | Tahmini En Yüksek | Tahmini Ortalama | Tahmini En Düşük | Değişim (%) |
|---|---|---|---|---|
| 2025 | 206,7109 | 182,93 | 148,1733 | 0 |
| 2026 | 288,334266 | 194,82045 | 177,2866095 | 6 |
| 2027 | 335,79252762 | 241,577358 | 166,68837702 | 32 |
| 2028 | 360,8561785125 | 288,68494281 | 233,8348036761 | 57 |
| 2029 | 399,4677896133375 | 324,77056066125 | 168,88069154385 | 77 |
| 2030 | 477,99731118122775 | 362,11917513729375 | 351,255599883174937 | 98 |
IV. Yatırım Stratejisi Karşılaştırması: SNEK ve SOL
Uzun Vadeli ve Kısa Vadeli Yatırım Stratejileri
- SNEK: Meme coin potansiyeli ve Cardano ekosistemi büyümesine odaklananlar için uygun
- SOL: Güçlü ekosistemli, köklü blockchain platformlarını tercih edenler için uygun
Risk Yönetimi ve Varlık Dağılımı
- Temkinli yatırımcılar: SNEK %5, SOL %15
- Agresif yatırımcılar: SNEK %15, SOL %30
- Koruma araçları: Stablecoin tahsisi, opsiyonlar, çapraz döviz portföyleri
V. Potansiyel Risk Karşılaştırması
Piyasa Riski
- SNEK: Meme coin statüsü ve erken aşama piyasası nedeniyle yüksek oynaklık
- SOL: Geniş kripto piyasa trendlerinden ve diğer akıllı kontrat platformlarıyla rekabetten etkilenebilir
Teknik Risk
- SNEK: Cardano üzerindeki ölçeklenebilirlik ve ağ istikrarı
- SOL: Ağ kesintileri ve merkezileşme riskleri
Regülasyon Riski
- Küresel düzenleyici politikalar, SOL’u yüksek piyasa değeri ve yaygın benimseme nedeniyle daha fazla etkileyebilir
VI. Sonuç: Hangisi Daha Avantajlı Bir Alım?
📌 Yatırım Değeri Özeti:
- SNEK’in avantajları: Yüksek büyüme potansiyeli, deflasyonist model, düşük regülasyon riski
- SOL’un avantajları: Oturmuş ekosistem, kurumsal benimseme, kanıtlanmış ölçeklenebilirlik
✅ Yatırım Tavsiyesi:
- Yeni yatırımcılar: Yüksek risk-yüksek getiri potansiyeli için SNEK’e küçük, istikrar için SOL’a büyük pay ayırmayı değerlendirin
- Deneyimli yatırımcılar: Risk toleransına göre dengeli SNEK ve SOL portföyü oluşturun
- Kurumsal yatırımcılar: SOL’un köklü piyasa konumu ve ekosistemine odaklanırken, çeşitlendirme için SNEK’e küçük pay ayırabilirsiniz
⚠️ Risk Uyarısı: Kripto para piyasaları son derece dalgalıdır. Bu makale yatırım tavsiyesi değildir. None
VII. Sıkça Sorulan Sorular
S1: SNEK ile SOL arasındaki ana farklar nelerdir? C: SNEK, Cardano ekosisteminde sabit arzlı ve deflasyonist modele sahip yeni bir meme coin; SOL ise yüksek performanslı, dezenflasyonist modelde köklü bir blokzincir protokolüdür ve DeFi, NFT, dApp gibi alanlarda olgun bir ekosisteme sahiptir.
S2: Son dönemde hangi coin daha iyi fiyat performansı gösterdi? C: SOL, Ocak 2025’te 293,31 $ ile zirveye ulaşarak daha istikrarlı seyretti; SNEK ise yeni meme coin olarak 0,0001 $’dan 0,0097 $’a çıkarak yüksek oynaklık yaşadı.
S3: SNEK ile SOL’un arz mekanizmaları nasıl farklılık gösteriyor? C: SNEK, toplam 1.000.000.000 sabit arzlı ve sürekli yakım mekanizmasıyla deflasyonist modelde; SOL ise %8 başlangıç enflasyonu olup zamanla %1,5 uzun vadeli enflasyona inen dezenflasyonist modelde.
S4: Hangi coin daha fazla kurumsal benimsemeye sahip? C: SOL, Alameda Research, Multicoin Capital ve FTX Ventures gibi büyük fonlardan destek alırken, SNEK’in kurumsal varlığı henüz gelişiyor.
S5: 2030 için SNEK ve SOL’un tahmini fiyat aralıkları nedir? C: SNEK için temel senaryo 0,006578097096166 $ – 0,009669802731365 $; SOL için temel senaryo 362,11917513729375 $ – 477,99731118122775 $ aralığında.
S6: Yatırımcılar portföylerini SNEK ve SOL arasında nasıl dağıtmalı? C: Temkinli yatırımcılar SNEK’e %5, SOL’a %15; agresif yatırımcılar SNEK’e %15, SOL’a %30 oranında pay ayırabilir. Kişisel risk toleransı ve hedefler belirleyicidir.
S7: SNEK ve SOL yatırımlarında başlıca riskler nelerdir? C: SNEK, meme coin statüsü ve erken aşama nedeniyle yüksek oynaklık riski taşır; SOL ise genel kripto trendlerine duyarlı ve ağ kesintileri yaşamıştır. İkisi de regülasyon riskinden etkilenebilir; SOL daha fazla incelemeye tabi olabilir.
Share
Content
Giriş: SNEK ve SOL Yatırımı Karşılaştırması
I. Fiyat Geçmişi Karşılaştırması ve Güncel Piyasa Durumu
II. SNEK ve SOL Yatırım Değerini Etkileyen Temel Faktörler
III. 2025-2030 Fiyat Tahmini: SNEK ve SOL
IV. Yatırım Stratejisi Karşılaştırması: SNEK ve SOL
V. Potansiyel Risk Karşılaştırması
VI. Sonuç: Hangisi Daha Avantajlı Bir Alım?
VII. Sıkça Sorulan Sorular
How to Buy Cryptocurrency


Trending Cryptocurrencies


Bonk (BONK) iyi bir yatırım mı?: Meme Coin Fenomeninin Riskleri ve Potansiyelinin Değerlendirilmesi

Pumpfun (PUMP) iyi bir yatırım mı?: Bu Yükselen Kripto Paranın Potansiyeli ve Risklerinin Analizi

PUNDU vs SNX: Kripto Arenasında DeFi Devlerinin Mücadelesi
WEN vs SOL: Bir Sonraki Boğa Piyasasında DeFi Liderliği İçin Mücadele

JUP vs DOGE: Kripto Arenasında Meme Coin'lerin Mücadelesi

En İyi Kripto Satın Alınacak: 2025 Listesi
Dropee Günlük Kombinasyonu 11 Aralık 2025

Tomarket Günlük Kombinasyonu 11 Aralık 2025

Merkeziyetsiz Finans'ta Geçici Kayıp Nedir?

Kripto Parada Çifte Harcama: Önleme Stratejileri

Kripto Ticaretinde Wyckoff Yönteminin Anlaşılması