SMART vs ETH: Comparing the Future of Blockchain Technology
Introduction: SMART vs ETH Investment Comparison
In the cryptocurrency market, SMART vs ETH comparison has always been a topic that investors can't avoid. The two not only have significant differences in market cap ranking, application scenarios, and price performance, but also represent different positioning in crypto assets.
SMART (SMART): Since its launch, it has gained market recognition for its ability to quickly create decentralized networks and tokens based on the Google Protobuf system.
Ethereum (ETH): Since its inception in 2015, it has been hailed as the foundation for decentralized applications and smart contracts, and is one of the cryptocurrencies with the highest global trading volume and market capitalization.
This article will comprehensively analyze the investment value comparison between SMART and ETH, focusing on historical price trends, supply mechanisms, institutional adoption, technological ecosystems, and future predictions, and attempt to answer the question investors are most concerned about:
"Which is the better buy right now?"
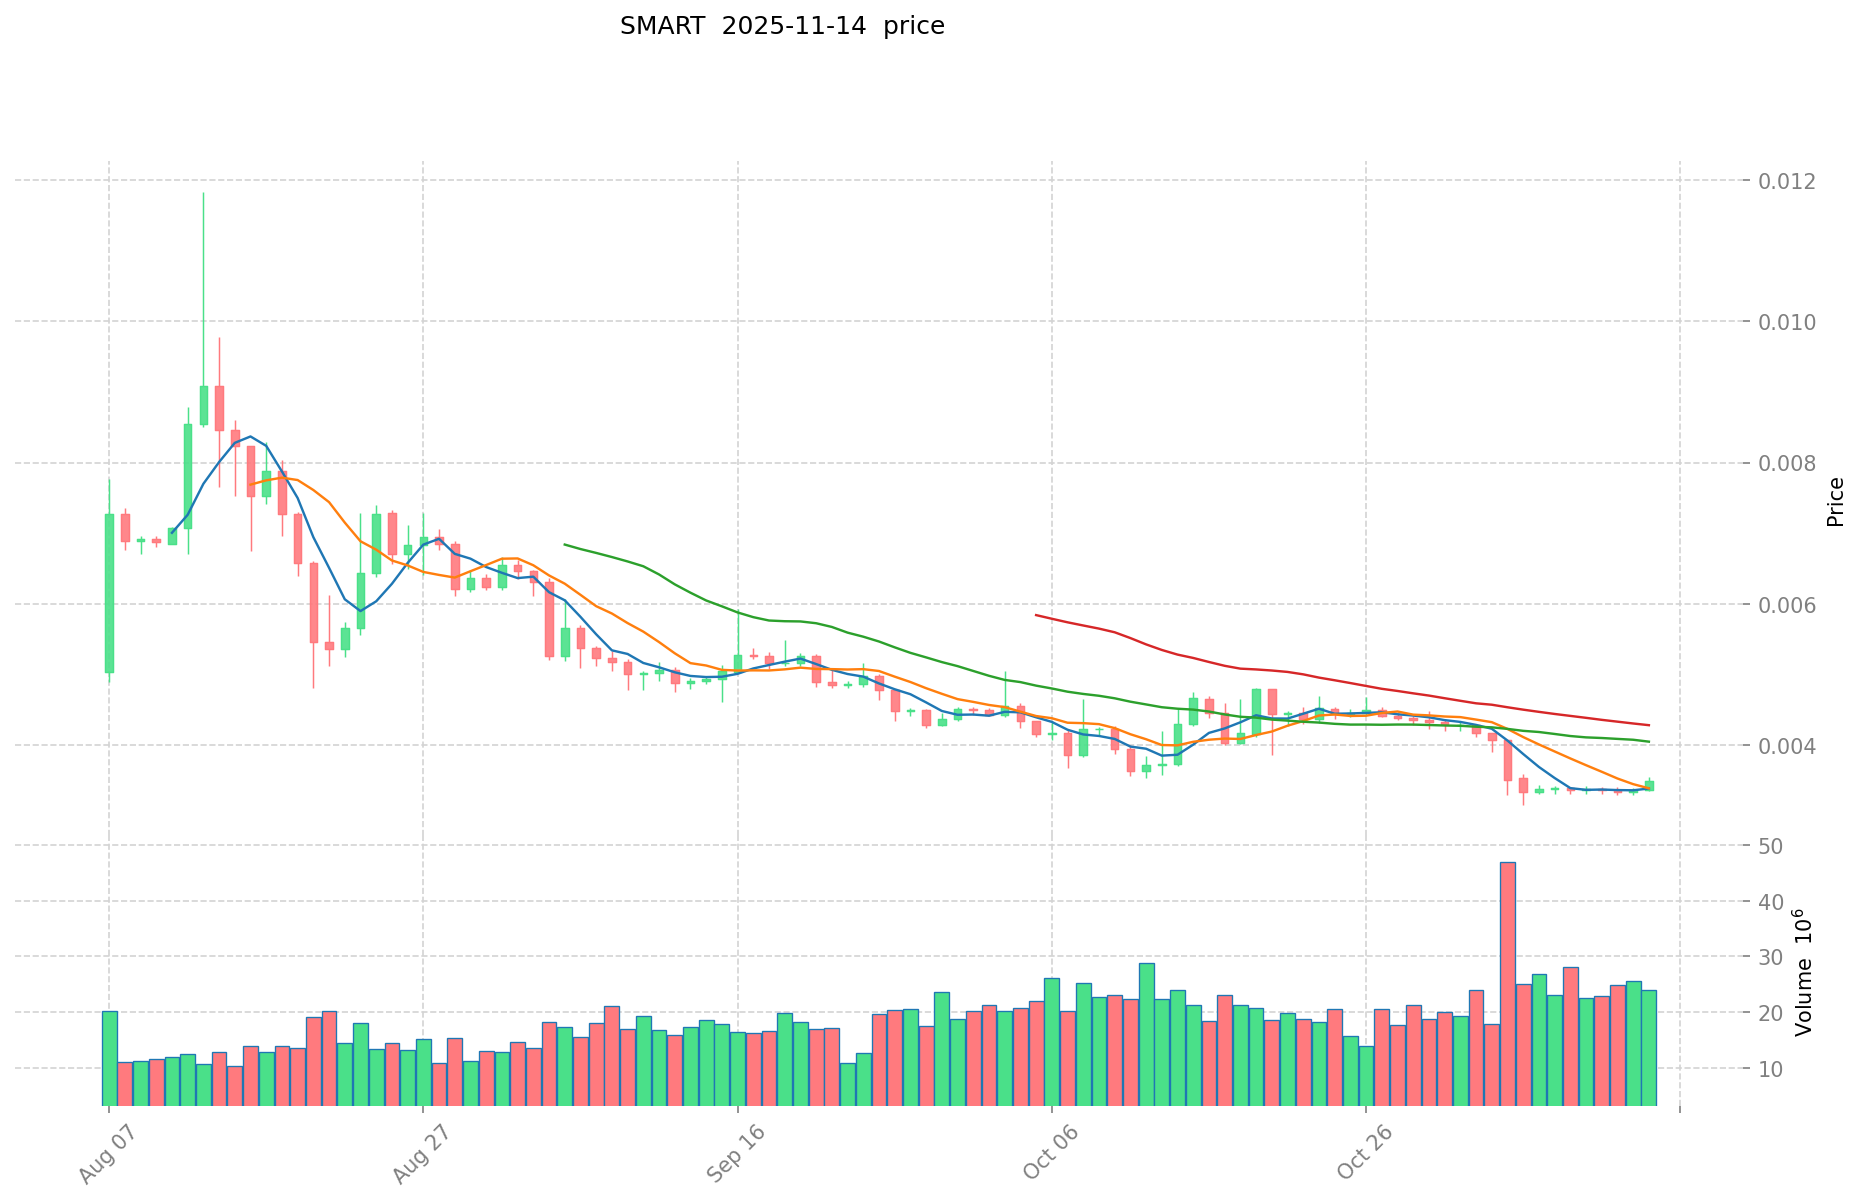
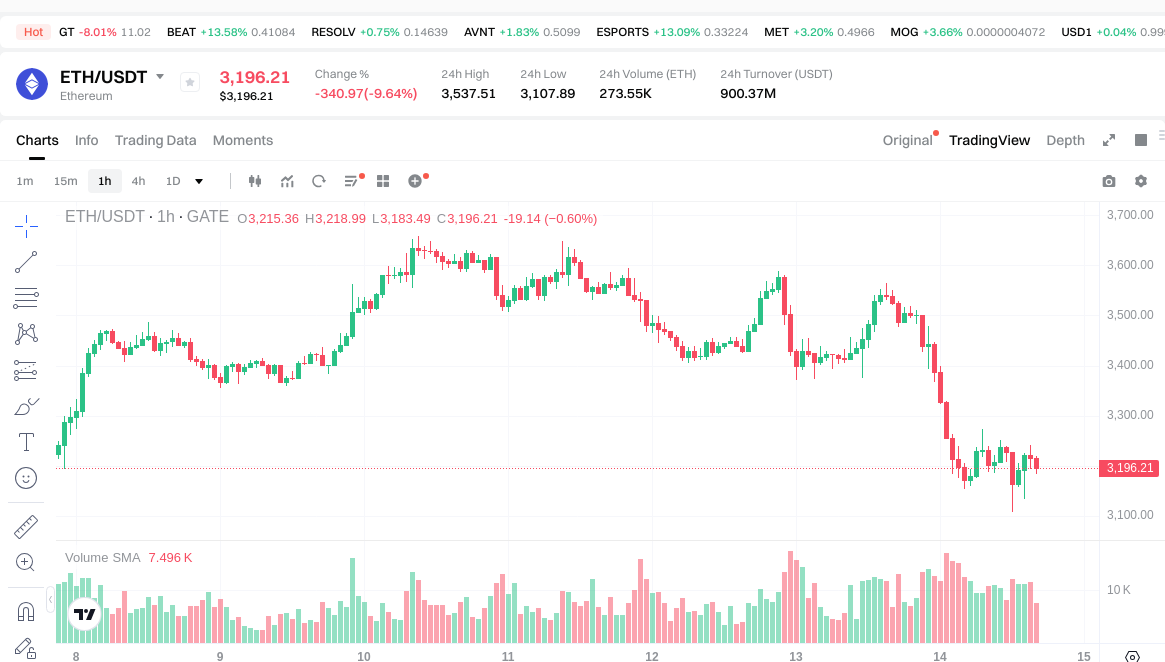
I. Price History Comparison and Current Market Status
SMART and ETH Historical Price Trends
- 2024: SMART reached its all-time low of $0.0003871791 on March 9, 2024.
- 2025: SMART hit its all-time high of $0.011835 on August 13, 2025.
- 2025: ETH achieved its all-time high of $4,946.05 on August 25, 2025.
- Comparative analysis: In 2025, SMART experienced a significant price surge from its all-time low to its all-time high, while ETH also reached new heights.
Current Market Situation (2025-11-14)
- SMART current price: $0.00346
- ETH current price: $3,201.95
- 24-hour trading volume: SMART $82,240.40 vs ETH $898,262,594.65
- Market Sentiment Index (Fear & Greed Index): 16 (Extreme Fear)
Click to view real-time prices:
- Check SMART current price Market Price
- Check ETH current price Market Price
II. Core Factors Affecting SMART vs ETH Investment Value
Supply Mechanism Comparison (Tokenomics)
- SMART: Smart Bitcoin (SMART) follows a fixed supply model with a maximum cap of 21 million tokens, mirroring Bitcoin's supply limit.
- ETH: Ethereum has a non-fixed supply with a controlled issuance rate. Since the implementation of EIP-1559, ETH has introduced a burning mechanism that can make it deflationary during periods of high network activity.
- 📌 Historical pattern: Fixed supply models like SMART's tend to create scarcity-driven price appreciation over time, while ETH's controlled issuance with burning mechanism creates a dynamic supply that responds to network usage.
Institutional Adoption and Market Applications
- Institutional holdings: ETH has gained significant institutional adoption with multiple ETFs, institutional investment products, and corporate treasury allocations. SMART has limited institutional presence currently.
- Enterprise adoption: ETH is widely used in enterprise blockchain applications across finance, supply chain, and digital identity sectors. SMART's enterprise adoption remains nascent compared to Ethereum's established ecosystem.
- National policies: Regulatory approaches vary significantly across jurisdictions, with ETH generally receiving clearer regulatory treatment in most developed markets, while SMART faces the standard regulatory uncertainty of newer cryptocurrencies.
Technical Development and Ecosystem Building
- SMART technical upgrades: Built on Bitcoin Core with smart contract capability, SMART combines Bitcoin's security with enhanced functionality.
- ETH technical development: Ethereum continues to evolve through its roadmap including the transition to proof-of-stake, layer 2 scaling solutions, and upcoming sharding implementations.
- Ecosystem comparison: Ethereum dominates in DeFi applications, NFT markets, and enterprise blockchain solutions with thousands of active dApps and billions in total value locked. SMART's ecosystem is still developing with fewer applications and lower TVL.
Macroeconomic Factors and Market Cycles
- Performance in inflationary environments: ETH has demonstrated mixed correlation with inflation metrics, while SMART, following Bitcoin's model, is positioned as a potential inflation hedge but lacks sufficient market history to confirm this property.
- Macroeconomic monetary policy: Both assets show sensitivity to Federal Reserve policy changes and interest rate movements, with ETH typically displaying higher volatility during such shifts.
- Geopolitical factors: Cross-border transaction demand tends to benefit both assets during periods of geopolitical uncertainty, though ETH's greater liquidity and market depth provide advantages for larger cross-border value transfers. III. 2025-2030 Price Prediction: SMART vs ETH
Short-term Prediction (2025)
- SMART: Conservative $0.002490984 - $0.0034597 | Optimistic $0.0034597 - $0.004117043
- ETH: Conservative $2658.4568 - $3202.96 | Optimistic $3202.96 - $3875.5816
Mid-term Prediction (2027)
- SMART may enter a growth phase, with an estimated price range of $0.0025503316938 - $0.0050620219983
- ETH may enter a bullish market, with an estimated price range of $2402.81094612 - $5425.7021364
- Key drivers: Institutional capital inflow, ETF, ecosystem development
Long-term Prediction (2030)
- SMART: Base scenario $0.005293548161516 - $0.00656399972028 | Optimistic scenario $0.00656399972028
- ETH: Base scenario $6083.91731557584 - $9004.1976270522432 | Optimistic scenario $9004.1976270522432
Disclaimer: This analysis is for informational purposes only and should not be considered as financial advice. Cryptocurrency markets are highly volatile and unpredictable. Always conduct your own research before making any investment decisions.
SMART:
| 年份 | 预测最高价 | 预测平均价格 | 预测最低价 | 涨跌幅 |
|---|---|---|---|---|
| 2025 | 0.004117043 | 0.0034597 | 0.002490984 | 0 |
| 2026 | 0.00393990636 | 0.0037883715 | 0.002007836895 | 9 |
| 2027 | 0.0050620219983 | 0.00386413893 | 0.0025503316938 | 11 |
| 2028 | 0.00566811218947 | 0.00446308046415 | 0.002722479083131 | 28 |
| 2029 | 0.005521499996223 | 0.00506559632681 | 0.004559036694129 | 46 |
| 2030 | 0.00656399972028 | 0.005293548161516 | 0.004975935271825 | 52 |
ETH:
| 年份 | 预测最高价 | 预测平均价格 | 预测最低价 | 涨跌幅 |
|---|---|---|---|---|
| 2025 | 3875.5816 | 3202.96 | 2658.4568 | 0 |
| 2026 | 4211.732252 | 3539.2708 | 2335.918728 | 10 |
| 2027 | 5425.7021364 | 3875.501526 | 2402.81094612 | 21 |
| 2028 | 5162.168032632 | 4650.6018312 | 3069.397208592 | 45 |
| 2029 | 7261.44969923568 | 4906.384931916 | 3777.91639757532 | 53 |
| 2030 | 9004.1976270522432 | 6083.91731557584 | 4684.6163329933968 | 90 |
IV. Investment Strategy Comparison: SMART vs ETH
Long-term vs Short-term Investment Strategy
- SMART: Suitable for investors focused on Bitcoin-like scarcity and potential ecosystem growth
- ETH: Suitable for investors seeking established ecosystem, DeFi exposure, and deflationary properties
Risk Management and Asset Allocation
- Conservative investors: SMART: 10% vs ETH: 90%
- Aggressive investors: SMART: 30% vs ETH: 70%
- Hedging tools: Stablecoin allocation, options, cross-currency portfolios
V. Potential Risk Comparison
Market Risk
- SMART: High volatility, low liquidity, and limited market depth
- ETH: Correlation with broader crypto market, susceptibility to macro trends
Technical Risk
- SMART: Scalability, network stability
- ETH: Network congestion, execution risks in ongoing upgrades
Regulatory Risk
- Global regulatory policies may impact both, with ETH potentially facing more scrutiny due to its larger market presence
VI. Conclusion: Which Is the Better Buy?
📌 Investment Value Summary:
- SMART advantages: Fixed supply model, potential for rapid growth
- ETH advantages: Established ecosystem, institutional adoption, ongoing technical improvements
✅ Investment Advice:
- New investors: Consider ETH for its established market position and ecosystem
- Experienced investors: Diversify with both, weighted towards ETH
- Institutional investors: Focus on ETH for liquidity and market depth, consider small SMART allocation for potential growth
⚠️ Risk Warning: Cryptocurrency markets are highly volatile. This article does not constitute investment advice. None
VII. FAQ
Q1: What are the main differences between SMART and ETH in terms of supply mechanisms? A: SMART follows a fixed supply model with a maximum cap of 21 million tokens, similar to Bitcoin. ETH has a non-fixed supply with a controlled issuance rate and a burning mechanism introduced by EIP-1559, potentially making it deflationary during high network activity periods.
Q2: How do SMART and ETH compare in terms of institutional adoption? A: ETH has gained significant institutional adoption with multiple ETFs, institutional investment products, and corporate treasury allocations. SMART currently has limited institutional presence compared to Ethereum's established ecosystem.
Q3: What are the key technical developments for SMART and ETH? A: SMART is built on Bitcoin Core with added smart contract capability, combining Bitcoin's security with enhanced functionality. ETH continues to evolve through its roadmap, including the transition to proof-of-stake, layer 2 scaling solutions, and upcoming sharding implementations.
Q4: How do the ecosystems of SMART and ETH compare? A: Ethereum dominates in DeFi applications, NFT markets, and enterprise blockchain solutions with thousands of active dApps and billions in total value locked. SMART's ecosystem is still developing with fewer applications and lower TVL.
Q5: What are the long-term price predictions for SMART and ETH by 2030? A: For SMART, the base scenario predicts a range of $0.005293548161516 - $0.00656399972028. For ETH, the base scenario predicts a range of $6083.91731557584 - $9004.1976270522432.
Q6: How should investors allocate their portfolio between SMART and ETH? A: Conservative investors might consider allocating 10% to SMART and 90% to ETH, while aggressive investors might allocate 30% to SMART and 70% to ETH.
Q7: What are the main risks associated with investing in SMART and ETH? A: SMART faces risks such as high volatility, low liquidity, and limited market depth. ETH risks include correlation with the broader crypto market and susceptibility to macro trends. Both face potential regulatory risks, with ETH possibly facing more scrutiny due to its larger market presence.
Share
Content

