SDN vs XLM: Comparing Network Virtualization Technologies for Enterprise Infrastructure
Introduction: SDN vs XLM Investment Comparison
In the cryptocurrency market, the comparison between ShidenNetwork (SDN) and Stellar (XLM) has been an unavoidable topic for investors. The two not only have significant differences in market cap ranking, application scenarios, and price performance, but also represent different cryptocurrency positioning.
ShidenNetwork (SDN): Launched in 2021, it has gained market recognition as a multi-chain decentralized application layer on the Kusama network.
Stellar (XLM): Since its inception in 2014, it has been hailed as a decentralized gateway for transferring between digital and fiat currencies, making it one of the cryptocurrencies with the highest global trading volume and market capitalization.
This article will provide a comprehensive analysis of the investment value comparison between SDN and XLM, focusing on historical price trends, supply mechanisms, institutional adoption, technological ecosystems, and future predictions, attempting to answer the question investors care about most:
"Which is the better buy right now?"
I. Price History Comparison and Current Market Status
SDN and XLM Historical Price Trends
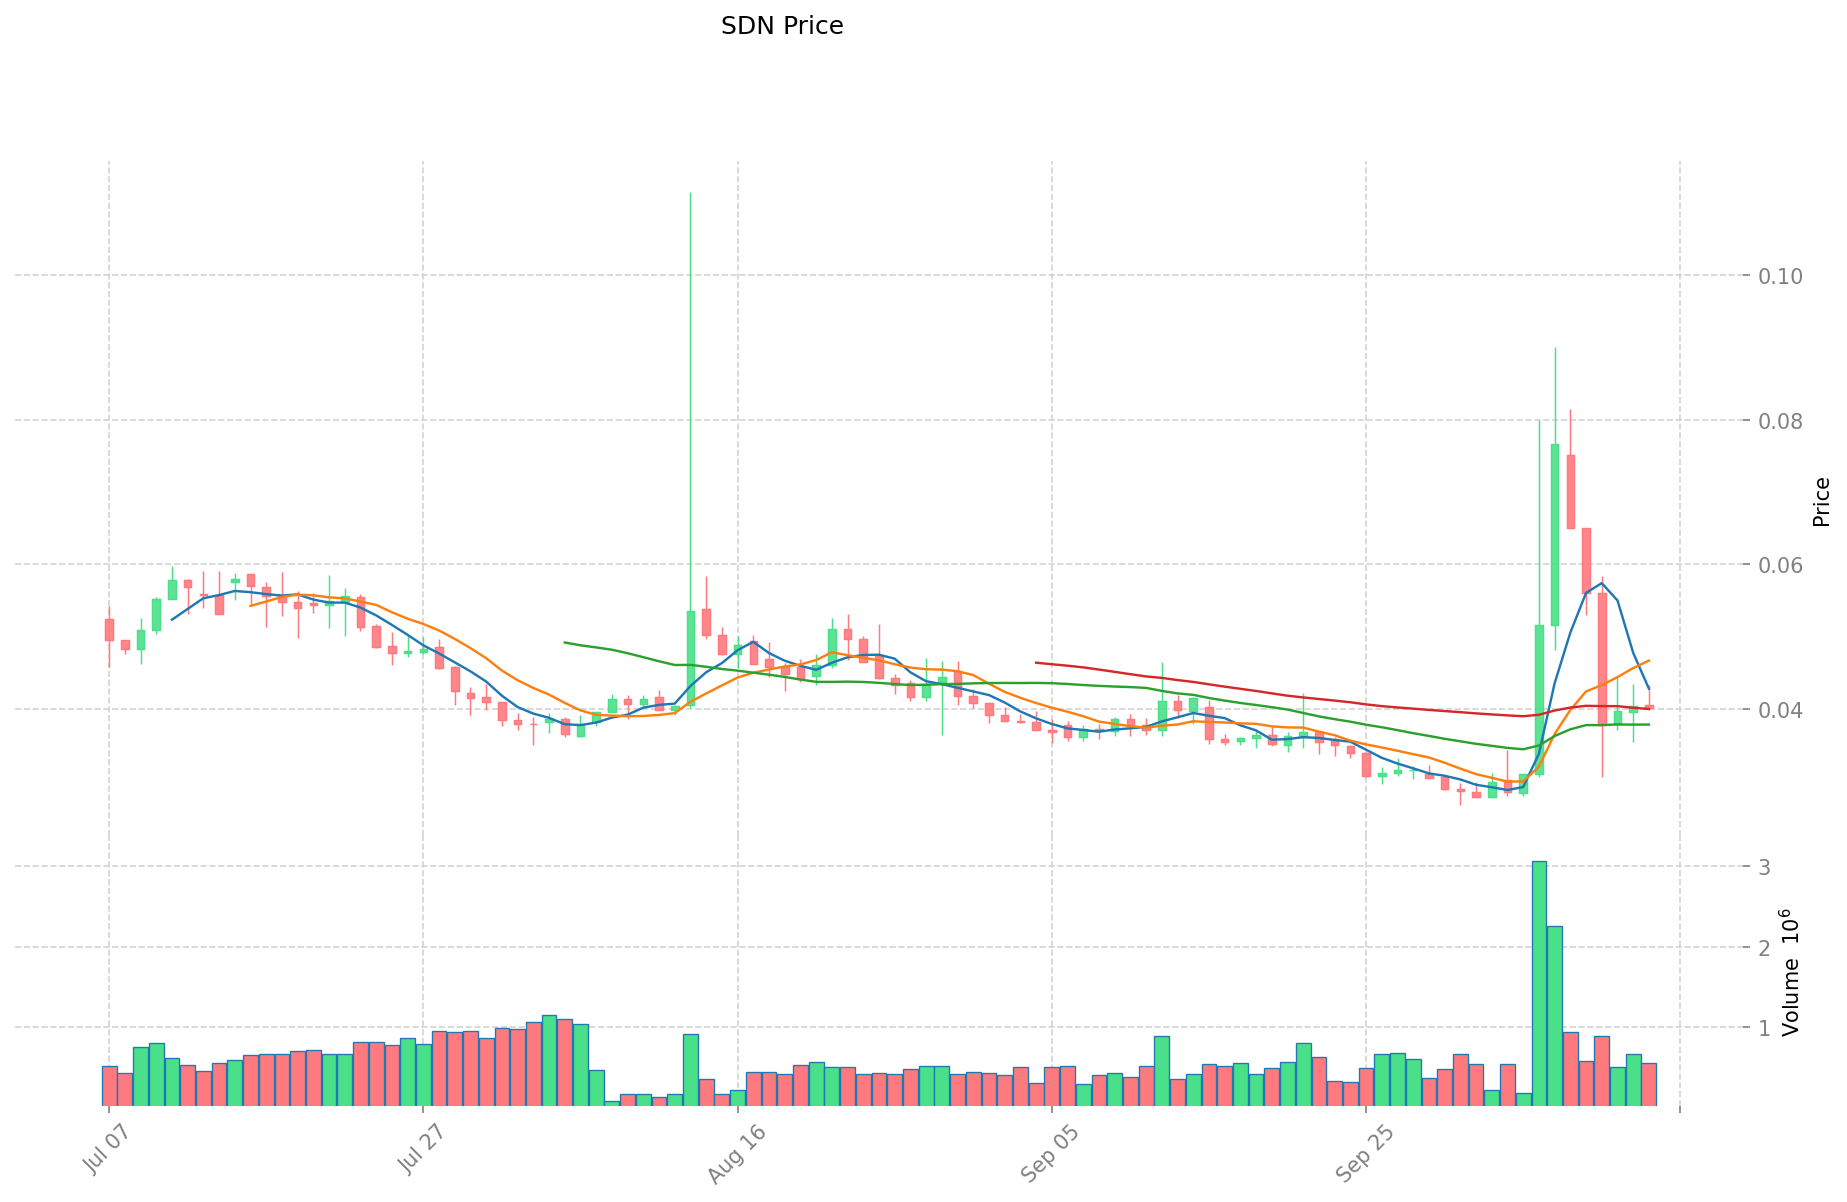
- 2021: SDN reached its all-time high of $8.36 on September 12, 2021.
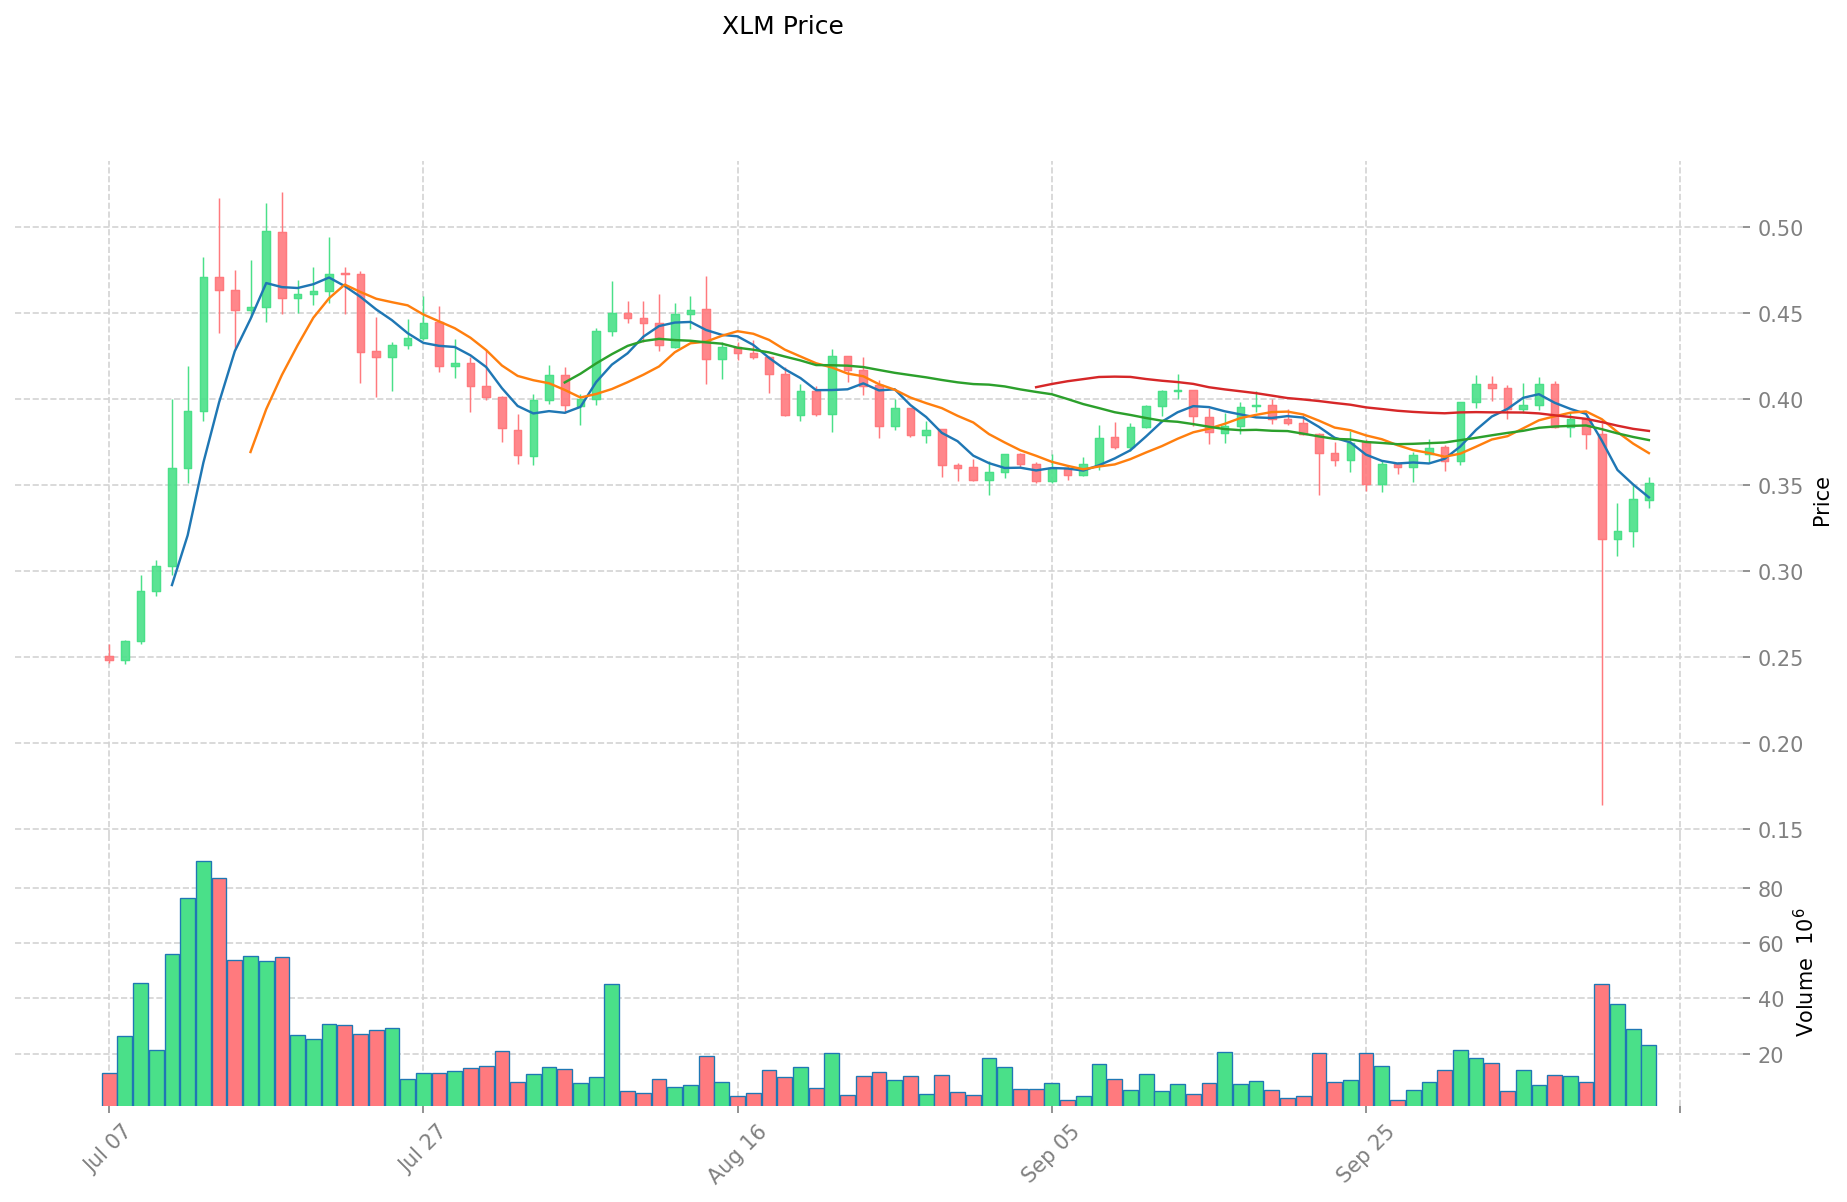
- 2018: XLM reached its all-time high of $0.875563 on January 3, 2018.
- Comparative analysis: SDN has experienced a significant decline from its all-time high of $8.36 to its current price of $0.03981, while XLM has shown more stability, currently trading at $0.35214.
Current Market Situation (2025-10-14)
- SDN current price: $0.03981
- XLM current price: $0.35214
- 24-hour trading volume: SDN $23,444.69 vs XLM $7,848,744.16
- Market Sentiment Index (Fear & Greed Index): 38 (Fear)
Click to view real-time prices:
- View SDN current price Market Price
- View XLM current price Market Price
II. Key Factors Affecting Investment Value of SDN vs XLM
Supply Mechanisms Comparison (Tokenomics)
- SDN: Fixed supply cap of 1 billion tokens with no further issuance, creating deflationary pressure
- XLM: Fixed supply of 50 billion tokens, with approximately 30 billion in circulation and remaining tokens allocated to Stellar Development Foundation
- 📌 Historical Pattern: Limited supply tokens like SDN typically experience higher price volatility during bull markets, while XLM's larger supply provides more stability but potentially lower percentage gains.
Institutional Adoption and Market Applications
- Institutional Holdings: XLM has gained more institutional adoption through partnerships with IBM, MoneyGram, and various financial institutions
- Enterprise Adoption: XLM has stronger positioning in cross-border payments and banking settlement systems, while SDN focuses more on decentralized finance applications
- Regulatory Attitudes: XLM benefits from clearer regulatory status in most jurisdictions due to Stellar's compliance-focused approach and engagement with regulators
Technical Development and Ecosystem Building
- SDN Technical Upgrades: Implementation of zero-knowledge proofs for enhanced privacy and scalability improvements through sharding
- XLM Technical Development: Soroban smart contracts platform launch, Stellar Turrets for enhanced security, and ongoing protocol upgrades for greater throughput
- Ecosystem Comparison: XLM has stronger presence in payment systems and banking integration, while SDN shows more activity in DeFi protocols and yield-generating applications
Macroeconomic Factors and Market Cycles
- Performance in Inflationary Environments: SDN's fixed supply model positions it better as an inflation hedge
- Macroeconomic Monetary Policy: Both tokens show negative correlation with rising interest rates, with XLM showing slightly more resilience during tightening cycles
- Geopolitical Factors: XLM benefits more directly from increased cross-border payment demand, particularly in emerging markets with currency volatility
III. 2025-2030 Price Prediction: SDN vs XLM
Short-term Prediction (2025)
- SDN: Conservative $0.0302556 - $0.03981 | Optimistic $0.03981 - $0.0529473
- XLM: Conservative $0.246589 - $0.35227 | Optimistic $0.35227 - $0.3698835
Mid-term Prediction (2027)
- SDN may enter a growth phase, with estimated prices ranging from $0.0328013002125 to $0.069405649725
- XLM may enter a bullish market, with estimated prices ranging from $0.22812829065 to $0.61419155175
- Key drivers: Institutional fund inflows, ETF developments, ecosystem growth
Long-term Prediction (2030)
- SDN: Base scenario $0.064507350749469 - $0.071674834166077 | Optimistic scenario $0.071674834166077 - $0.07454182753272
- XLM: Base scenario $0.58947648370758 - $0.633845681406 | Optimistic scenario $0.633845681406 - $0.88104549715434
Disclaimer: This analysis is based on historical data and market projections. Cryptocurrency markets are highly volatile and unpredictable. These predictions should not be considered as financial advice. Always conduct your own research before making investment decisions.
SDN:
| 年份 | 预测最高价 | 预测平均价格 | 预测最低价 | 涨跌幅 |
|---|---|---|---|---|
| 2025 | 0.0529473 | 0.03981 | 0.0302556 | 0 |
| 2026 | 0.0486975825 | 0.04637865 | 0.040813212 | 16 |
| 2027 | 0.069405649725 | 0.04753811625 | 0.0328013002125 | 19 |
| 2028 | 0.074259291394125 | 0.0584718829875 | 0.041515036921125 | 46 |
| 2029 | 0.076984081141342 | 0.066365587190812 | 0.052428813880741 | 66 |
| 2030 | 0.07454182753272 | 0.071674834166077 | 0.064507350749469 | 79 |
XLM:
| 年份 | 预测最高价 | 预测平均价格 | 预测最低价 | 涨跌幅 |
|---|---|---|---|---|
| 2025 | 0.3698835 | 0.35227 | 0.246589 | 0 |
| 2026 | 0.5163397525 | 0.36107675 | 0.2563644925 | 2 |
| 2027 | 0.61419155175 | 0.43870825125 | 0.22812829065 | 24 |
| 2028 | 0.605417386725 | 0.5264499015 | 0.373779430065 | 49 |
| 2029 | 0.7017577186995 | 0.5659336441125 | 0.481043597495625 | 60 |
| 2030 | 0.88104549715434 | 0.633845681406 | 0.58947648370758 | 79 |
IV. Investment Strategy Comparison: SDN vs XLM
Long-term vs Short-term Investment Strategies
- SDN: Suitable for investors focused on DeFi potential and ecosystem growth
- XLM: Suitable for investors seeking stability and exposure to cross-border payment solutions
Risk Management and Asset Allocation
- Conservative investors: SDN: 20% vs XLM: 80%
- Aggressive investors: SDN: 40% vs XLM: 60%
- Hedging tools: Stablecoin allocation, options, cross-currency portfolio
V. Potential Risk Comparison
Market Risk
- SDN: Higher volatility and potential for significant price swings
- XLM: More established but potentially lower percentage gains
Technical Risk
- SDN: Scalability, network stability
- XLM: Centralization concerns, security vulnerabilities
Regulatory Risk
- Global regulatory policies may have differing impacts on both tokens
VI. Conclusion: Which Is the Better Buy?
📌 Investment Value Summary:
- SDN advantages: Fixed supply cap, DeFi focus, potential for higher gains in bull markets
- XLM advantages: Established partnerships, stronger institutional adoption, cross-border payment utility
✅ Investment Advice:
- New investors: Consider a higher allocation to XLM for stability
- Experienced investors: Balanced approach with exposure to both SDN and XLM
- Institutional investors: Focus on XLM for its regulatory clarity and established use cases
⚠️ Risk Warning: Cryptocurrency markets are highly volatile. This article does not constitute investment advice. None
VII. FAQ
Q1: What are the main differences between SDN and XLM? A: SDN is a multi-chain decentralized application layer on the Kusama network, launched in 2021, with a focus on DeFi. XLM, launched in 2014, is a decentralized gateway for transferring between digital and fiat currencies, with a strong presence in cross-border payments and banking integration.
Q2: Which token has shown better price stability? A: XLM has shown more price stability compared to SDN. While SDN has experienced a significant decline from its all-time high of $8.36 to its current price of $0.03981, XLM has maintained more consistent trading levels, currently at $0.35214.
Q3: How do the supply mechanisms of SDN and XLM differ? A: SDN has a fixed supply cap of 1 billion tokens with no further issuance, creating deflationary pressure. XLM has a fixed supply of 50 billion tokens, with approximately 30 billion in circulation and the remaining allocated to the Stellar Development Foundation.
Q4: Which token has gained more institutional adoption? A: XLM has gained more institutional adoption through partnerships with companies like IBM and MoneyGram, as well as various financial institutions. It also has a stronger positioning in cross-border payments and banking settlement systems.
Q5: What are the key technical developments for each token? A: SDN has implemented zero-knowledge proofs for enhanced privacy and scalability improvements through sharding. XLM has launched the Soroban smart contracts platform, Stellar Turrets for enhanced security, and ongoing protocol upgrades for greater throughput.
Q6: How do SDN and XLM compare in terms of long-term price predictions? A: By 2030, SDN's base scenario price range is predicted to be $0.064507350749469 - $0.071674834166077, while XLM's base scenario range is $0.58947648370758 - $0.633845681406. XLM is projected to have a higher absolute price, but both tokens are expected to show significant growth.
Q7: Which token might be more suitable for different types of investors? A: SDN may be more suitable for investors focused on DeFi potential and ecosystem growth, and for those willing to take on higher risk for potentially higher rewards. XLM might be more appropriate for investors seeking stability and exposure to cross-border payment solutions, as well as those who prefer more established projects with stronger institutional adoption.
Share
Content