SAROS vs LINK: Geleceğin Veri Yönetimine Yönelik İki Merkeziyetsiz Depolama Çözümünün Karşılaştırılması


Giriş: SAROS ve LINK Yatırım Karşılaştırması
Kripto para piyasasında SAROS ile LINK’in karşılaştırılması, yatırımcıların gündeminden düşmeyen bir konudur. Her iki token; piyasa değeri sıralaması, kullanım alanları ve fiyat performansı açısından ciddi farklılıklar gösterirken, kripto varlık ekosisteminde de birbirinden ayrı konumlarda yer alıyor.
SAROS (SAROS): 2024’te piyasaya çıkan bu token, Solana ekosisteminde kapsamlı Web3 deneyimi sunmasıyla piyasa tarafından kabul gördü.
LINK (LINK): 2017’den bu yana lider oracle ağı olarak tanınan LINK, küresel ölçekte en yüksek işlem hacmine ve piyasa değerine sahip kripto paralardan biri oldu.
Bu makalede, SAROS ve LINK’in yatırım değerleri; geçmiş fiyat trendleri, arz mekanizmaları, kurumsal benimseme, teknolojik ekosistemler ve gelecek öngörüleri üzerinden kapsamlı biçimde incelenecek, yatırımcıların en çok merak ettiği şu soruya yanıt aranacaktır:
"Şu anda en iyi alım hangisi?"
I. Fiyat Geçmişi Karşılaştırması ve Mevcut Piyasa Görünümü
SAROS ve LINK’in Tarihsel Fiyat Trendleri
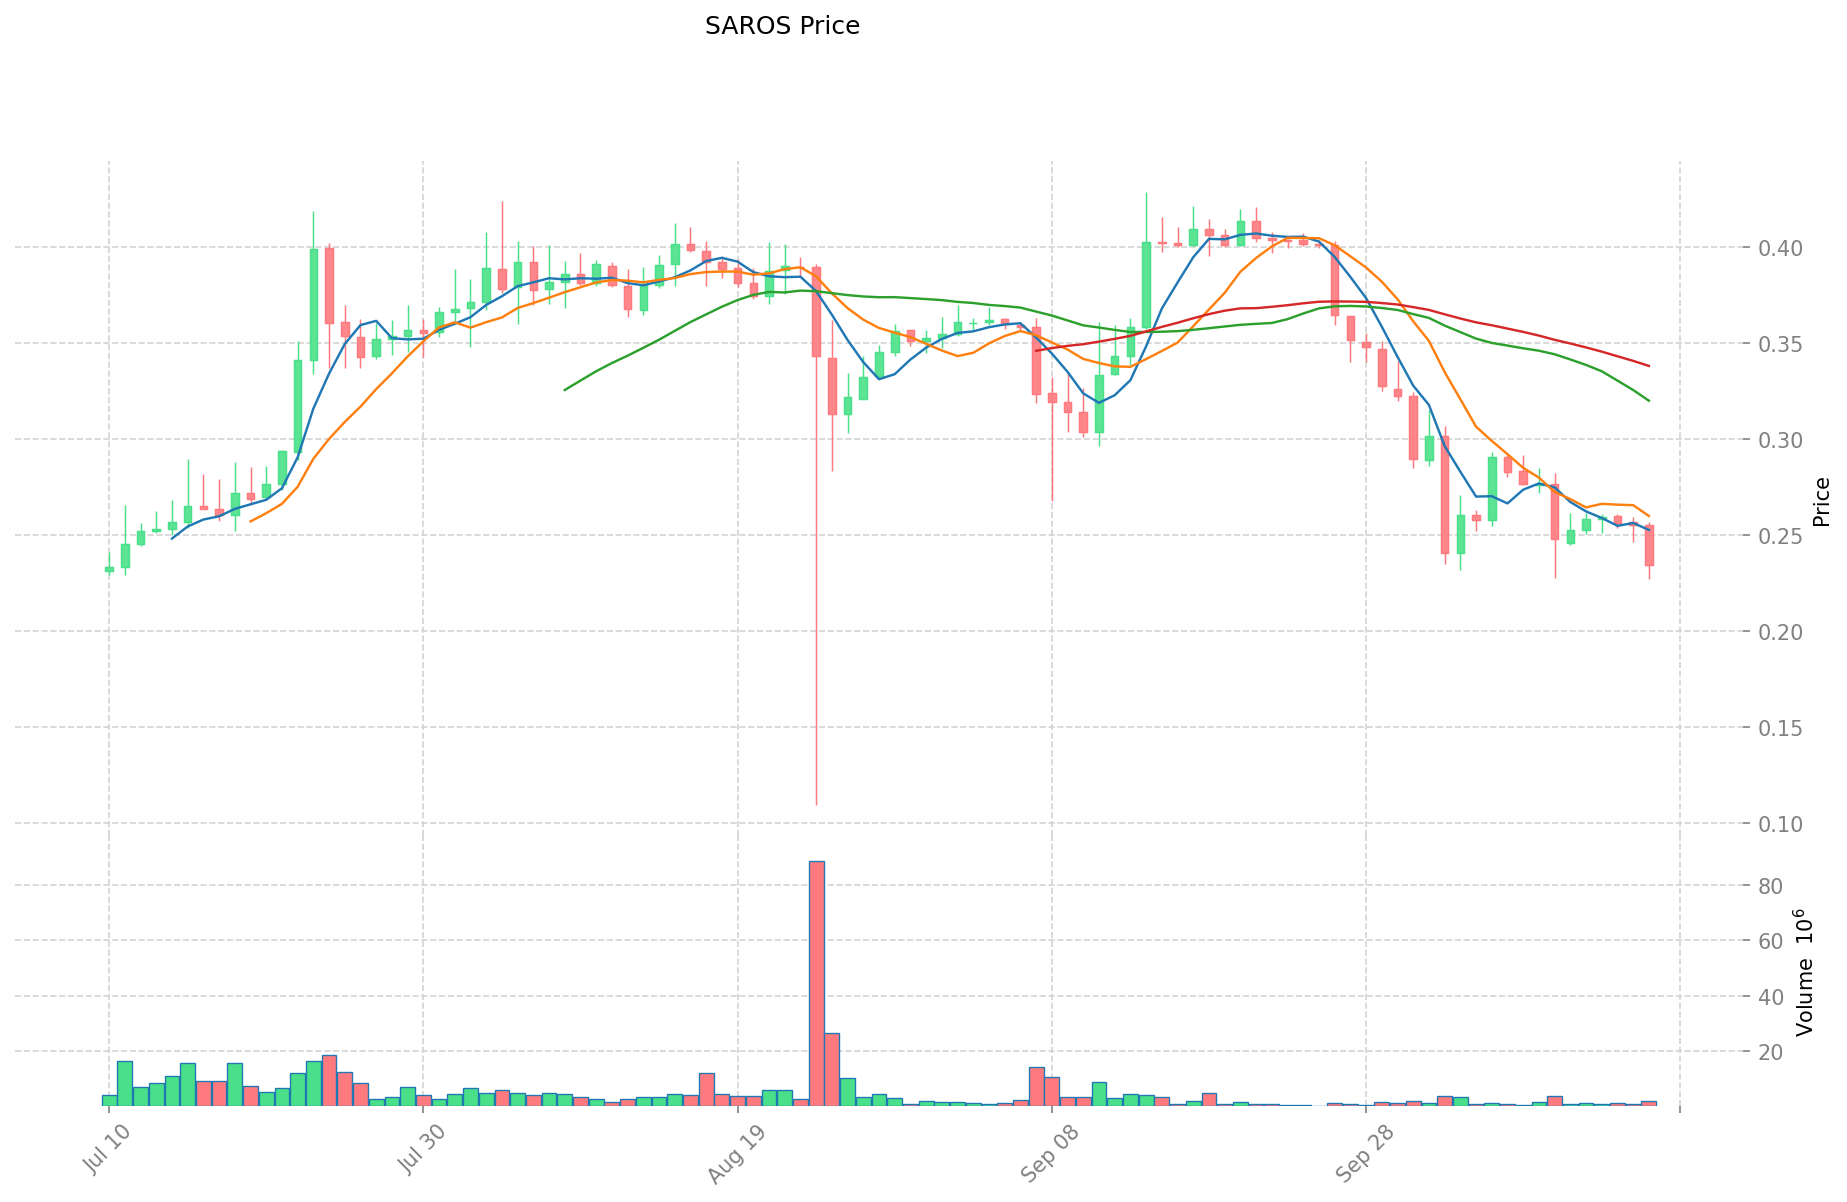
- 2024: SAROS, Solana üzerinde piyasaya çıktı; fiyatı 0,001029 $’dan 0,234 $’a yükseldi.
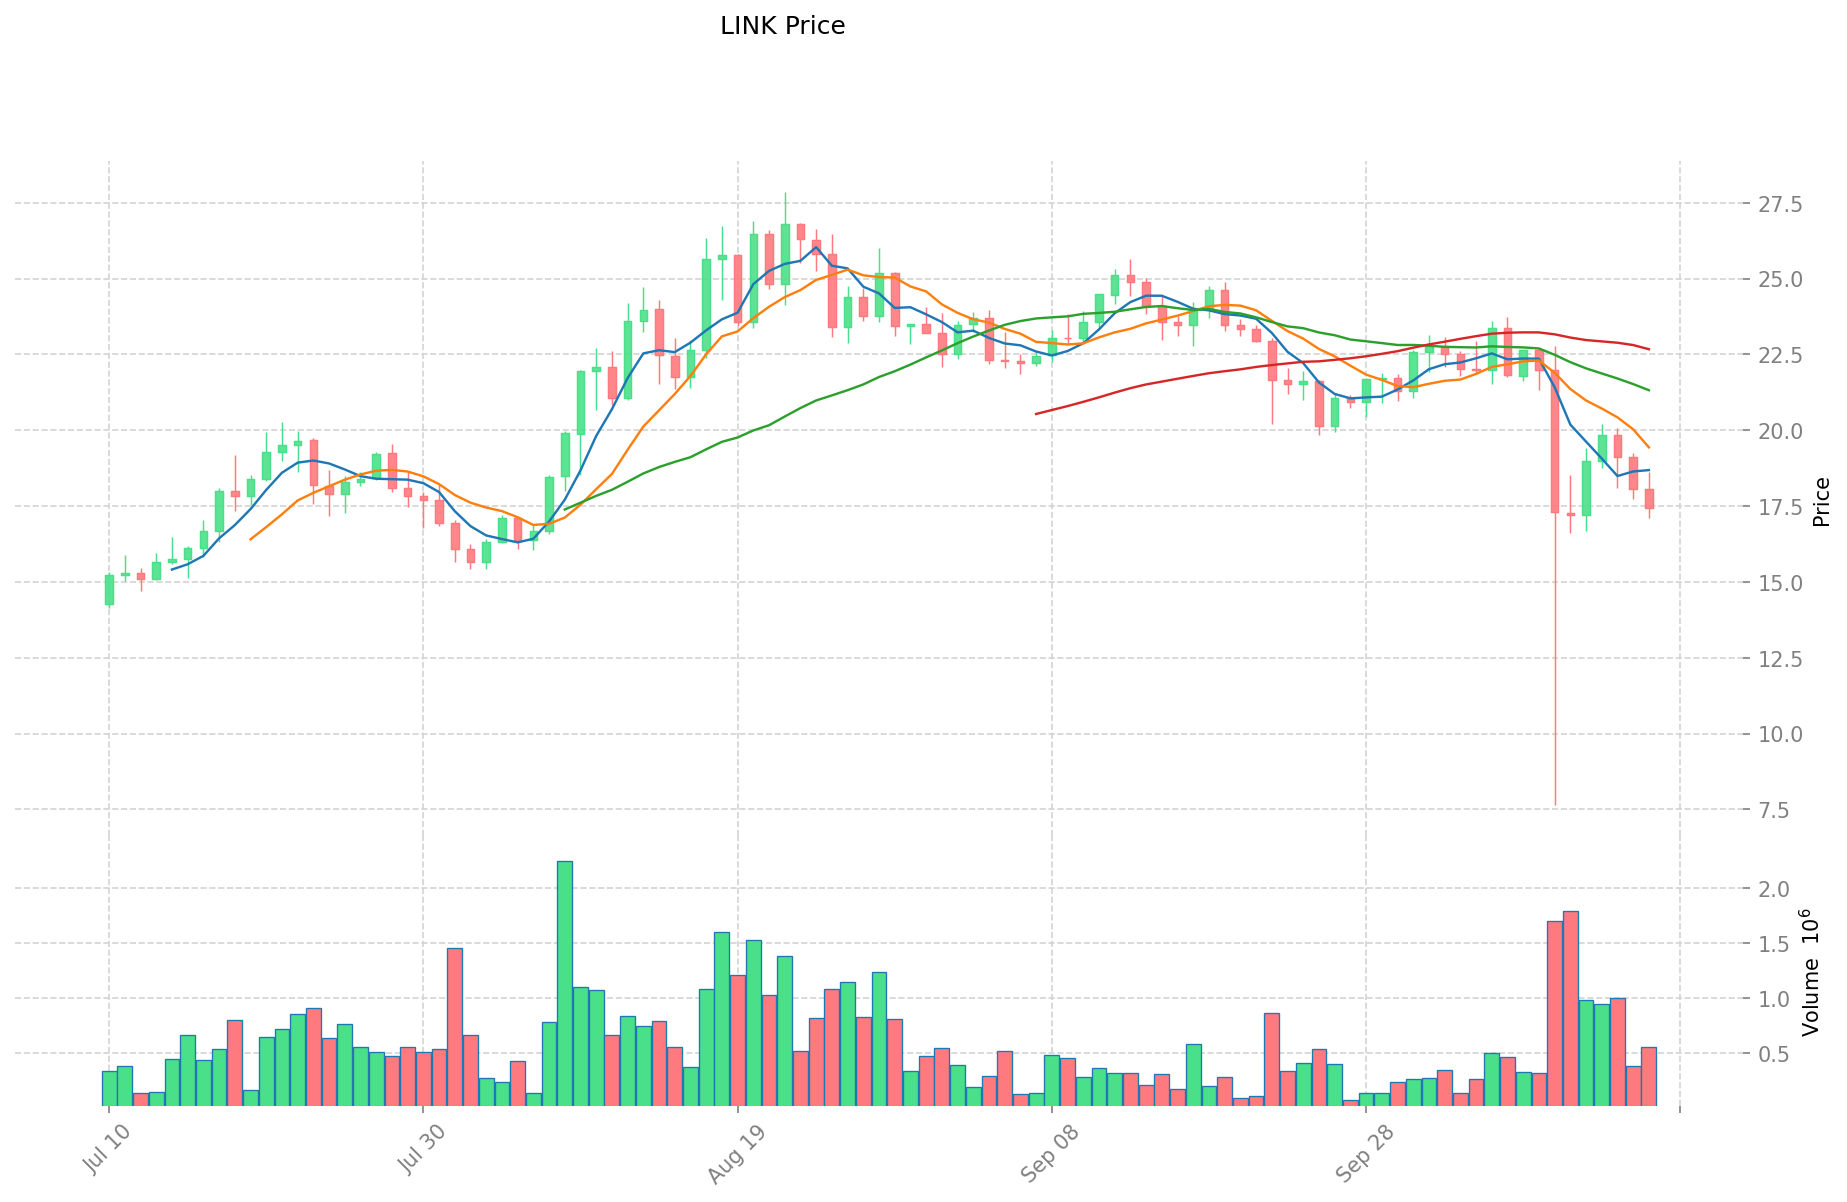
- 2021: LINK, DeFi’nin artan benimsenmesiyle 52,7 $ ile zirveye ulaştı.
- Kıyaslama: 2024-2025 boğa piyasasında SAROS, 0,001029 $’dan 0,429 $’a çıkarken; LINK, 17,376 $’dan 52,7 $’a yükseldi.
Güncel Piyasa Durumu (17 Ekim 2025)
- SAROS güncel fiyat: 0,234 $
- LINK güncel fiyat: 17,376 $
- 24 saatlik işlem hacmi: 489.600 $ (SAROS) - 9.948.472 $ (LINK)
- Piyasa Duyarlılığı Endeksi (Korku & Açgözlülük Endeksi): 28 (Korku)
Anlık fiyatlara ulaşmak için tıklayınız:
- SAROS güncel fiyatı Piyasa Fiyatı
- LINK güncel fiyatı Piyasa Fiyatı
II. SAROS ve Solana’nın Yatırım Değerini Etkileyen Temel Faktörler
Arz Mekanizması Karşılaştırması (Tokenomik)
- SAROS: USDC ile işlem yapanlara teşvikler ve olası ETH kontrat airdrop’ları sunar
- Solana: Toplam 489 milyon SOL arzı bulunmakta olup, 260 milyon adedi dolaşımda. Dağılım: %16,23 tohum satışı, %12,92 fon toplama, %12,79 ekip, %10,46 Solana Vakfı
- 📌 Tarihsel olarak: Arz mekanizması ve dağıtım takvimi fiyat dalgalanması ve yatırım döngülerini doğrudan etkiler.
Kurumsal Benimseme ve Piyasa Kullanımları
- Piyasa talebi: Her iki token da küresel ekonomik koşullar ve piyasa taleplerinden doğrudan etkilenir
- Kurumsal kullanım: Solana, yüksek hız ve ölçeklenebilirliğiyle bireysel ve kurumsal müşterilere hizmet sunar
- Düzenlemeler: Hem SAROS hem Solana fiyatları, regülasyon ve politika değişikliklerinden ciddi biçimde etkilenir
Teknik Gelişim ve Ekosistem İnşası
- SAROS teknik özellikleri: Blokzincir altyapısı üzerinde inşa edilmiş olup, özel geliştirme dinamikleri fiyatı etkiler
- Solana teknik avantajları: Düşük işlem maliyetini koruyup, yüksek işlem hızına ulaşır; Proof of History gibi özgün konsensüs mekanizmalarıyla büyük işlem hacimlerini işler
- Ekosistem karşılaştırması: Solana, NFT alanında büyüyen bir ekosisteme sahip ve CoinMarketCap’te piyasa değeriyle 6. sırada yer alıyor
Makroekonomik ve Piyasa Döngüleri
- İşlem maliyetleri: Solana protokolü, performansı korurken işlem ücretlerini düşük tutarak yüksek ücretli ortamlarda avantaj yaratır
- Piyasa konumlanması: Solana, Şubat 2021’de SOL/USDT paritesinde 8.947.213 $’a ulaşan işlem hacmiyle öne çıktı
- Küresel ekonomik göstergeler: Her iki token da tüm kripto piyasasını etkileyen makroekonomik koşullardan etkilenir
III. 2025-2030 Fiyat Tahmini: SAROS ve LINK
Kısa Vadeli Tahmin (2025)
- SAROS: Muhafazakâr 0,14082 - 0,2347 $ | İyimser 0,2347 - 0,347356 $
- LINK: Muhafazakâr 13,059 - 17,412 $ | İyimser 17,412 - 21,59088 $
Orta Vadeli Tahmin (2027)
- SAROS büyüme evresine girerek 0,271965666 - 0,400309014 $ aralığına ulaşabilir
- LINK konsolidasyon sürecinde 16,989654528 - 25,720449216 $ aralığında seyredebilir
- Başlıca itici güçler: Kurumsal sermaye girişi, ETF’ler, ekosistem büyümesi
Uzun Vadeli Tahmin (2030)
- SAROS: Temel senaryo 0,216167032572876 - 0,4078623256092 $ | İyimser senaryo 0,4078623256092 - 0,420098195377476 $
- LINK: Temel senaryo 21,466589897846016 - 29,8147081914528 $ | İyimser senaryo 29,8147081914528 - 31,30544360102544 $
Feragatname
SAROS:
| 年份 | 预测最高价 | 预测平均价格 | 预测最低价 | 涨跌幅 |
|---|---|---|---|---|
| 2025 | 0,347356 | 0,2347 | 0,14082 | 0 |
| 2026 | 0,3201308 | 0,291028 | 0,18334764 | 24 |
| 2027 | 0,400309014 | 0,3055794 | 0,271965666 | 30 |
| 2028 | 0,40235639598 | 0,352944207 | 0,30000257595 | 50 |
| 2029 | 0,4380743497284 | 0,37765030149 | 0,3058967442069 | 61 |
| 2030 | 0,420098195377476 | 0,4078623256092 | 0,216167032572876 | 74 |
LINK:
| 年份 | 预测最高价 | 预测平均价格 | 预测最低价 | 涨跌幅 |
|---|---|---|---|---|
| 2025 | 21,59088 | 17,412 | 13,059 | 0 |
| 2026 | 27,6920448 | 19,50144 | 17,7463104 | 12 |
| 2027 | 25,720449216 | 23,5967424 | 16,989654528 | 35 |
| 2028 | 28,11079922112 | 24,658595808 | 12,57588386208 | 41 |
| 2029 | 33,2447188683456 | 26,38469751456 | 16,0946654838816 | 51 |
| 2030 | 31,30544360102544 | 29,8147081914528 | 21,466589897846016 | 71 |
IV. Yatırım Stratejisi Karşılaştırması: SAROS ve LINK
Uzun Vadeli ve Kısa Vadeli Yatırım Stratejileri
- SAROS: Web3 ekosistemi ve Solana tabanlı projelerde potansiyel arayan yatırımcılar için uygun
- LINK: Yerleşik oracle ağları ve DeFi altyapısı arayan yatırımcılar için daha uygun
Risk Yönetimi ve Varlık Dağılımı
- Temkinli yatırımcılar: SAROS %20 - LINK %80
- Agresif yatırımcılar: SAROS %40 - LINK %60
- Koruma araçları: Stablecoin tahsisi, opsiyonlar, çapraz döviz portföyleri
V. Potansiyel Risk Karşılaştırması
Piyasa Riskleri
- SAROS: Yeni bir token olması ve düşük piyasa değeri sebebiyle yüksek volatilite
- LINK: Oracle pazarında doygunluk ve yeni protokollerden kaynaklanan rekabet riski
Teknik Riskler
- SAROS: Ölçeklenebilirlik sorunları, Solana üzerindeki ağ istikrarı
- LINK: Akıllı sözleşme zafiyetleri, oracle manipülasyon denemeleri
Düzenleyici Riskler
- Küresel düzenlemeler iki tokenı farklı şekillerde etkileyebilir; LINK, daha yaygın kullanımı nedeniyle daha fazla düzenleyici gözetim altında kalabilir
VI. Sonuç: Hangisi Daha İyi Bir Alım?
📌 Yatırım Değeri Özeti:
- SAROS avantajları: Hızlı büyüme potansiyeline sahip yeni bir proje ve Solana ekosisteminin gelişimiyle bağlantılı
- LINK avantajları: Yerleşik piyasa konumu, DeFi ve akıllı sözleşmelerde yaygın benimseme
✅ Yatırım Tavsiyesi:
- Yeni yatırımcılar: Yüksek risk-yüksek getiri potansiyeli için SAROS’a küçük, istikrar için LINK’e daha büyük pay ayırılabilir
- Deneyimli yatırımcılar: Her iki tokenı da içeren dengeli portföy, risk toleransına ve piyasa koşullarına göre ayarlanabilir
- Kurumsal yatırımcılar: LINK, yerleşik piyasa konumu ve likiditesi nedeniyle daha uygun bir seçenek olabilir
⚠️ Risk Uyarısı: Kripto para piyasası aşırı volatiliteye sahiptir. Bu makale yatırım tavsiyesi değildir. None
VII. SSS
S1: SAROS ve LINK arasındaki temel farklılıklar nelerdir? C: SAROS, 2024’te Solana ekosisteminde piyasaya çıkan ve Web3 deneyimine odaklanan yeni bir tokendir. LINK ise 2017’de piyasaya sürülen ve DeFi’de daha yaygın olarak kullanılan, yerleşik bir oracle ağıdır. SAROS’un piyasa değeri daha düşük ve volatilitesi daha yüksekken, LINK’in piyasa değeri daha büyük ve fiyat geçmişi daha stabildir.
S2: Son dönemde hangi token daha iyi fiyat performansı gösterdi? C: 2024-2025 boğa piyasasında SAROS, 0,001029 $’dan 0,429 $’a yükselirken, LINK 17,376 $’dan 52,7 $’a çıktı. SAROS, oransal olarak daha yüksek getiri sağladı; LINK ise mutlak fiyat artışında öne çıktı.
S3: SAROS ve LINK’in arz mekanizmaları nasıl farklılaşıyor? C: SAROS, USDC ile işlem yapanlara teşvikler ve olası ETH kontrat airdrop’ları sunuyor. LINK’in toplam arzı 489 milyon olup, 260 milyonu dolaşımdadır; token dağılımı tohum satışı, fon toplama, ekip üyeleri ve Solana Vakfı arasında gerçekleşmiştir.
S4: Bu tokenların yatırım değerini etkileyen başlıca faktörler nelerdir? C: Arz mekanizması, kurumsal benimseme, teknik gelişim, ekosistem oluşturma, makroekonomik koşullar ve piyasa döngüleri ana belirleyicilerdir. Düzenleyici çerçeve ve küresel ekonomik göstergeler de önemli rol oynar.
S5: SAROS ve LINK için uzun vadeli fiyat beklentileri nedir? C: 2030’a kadar SAROS’un 0,216167032572876 - 0,420098195377476 $ aralığına, LINK’in ise 21,466589897846016 - 31,30544360102544 $ aralığına ulaşması bekleniyor (temel ve iyimser senaryolar).
S6: Yatırımcılar portföylerini SAROS ve LINK arasında nasıl dağıtmalı? C: Temkinli yatırımcılar %20 SAROS - %80 LINK, agresif yatırımcılar ise %40 SAROS - %60 LINK tercih edebilir. Dağılım, bireysel risk toleransı ve piyasa şartlarına göre şekillenmelidir.
S7: SAROS ve LINK yatırımlarında başlıca riskler nelerdir? C: SAROS, yeni bir token olması nedeniyle yüksek volatilite ve teknik riskler taşır. LINK ise piyasa doygunluğu ve artan rekabet riskiyle karşılaşabilir. Her iki token da düzenleyici risklere tabidir; LINK, yaygın kullanımı nedeniyle daha fazla gözetim altında olabilir.
Share
Content
Giriş: SAROS ve LINK Yatırım Karşılaştırması
I. Fiyat Geçmişi Karşılaştırması ve Mevcut Piyasa Görünümü
II. SAROS ve Solana’nın Yatırım Değerini Etkileyen Temel Faktörler
III. 2025-2030 Fiyat Tahmini: SAROS ve LINK
IV. Yatırım Stratejisi Karşılaştırması: SAROS ve LINK
V. Potansiyel Risk Karşılaştırması
VI. Sonuç: Hangisi Daha İyi Bir Alım?
VII. SSS
How to Buy Cryptocurrency


Trending Cryptocurrencies


KMNO nedir: Kimyada Güçlü Bir Oksitleyici ve Kullanım Alanları

2025 SHDW Fiyat Tahmini: Shadow Token'ın Potansiyel Büyümesi ve Piyasa Trendlerinin Analizi
OXY nedir: Güçlü bir opioid ağrı kesici ayrıntılı olarak açıklanıyor

Solana2025 fiyat tahmini: çığır açan potansiyel ve çoklu analiz yorumu

Solana'nın 2025 yılındaki piyasa değeri ne olacak? En Son SOL Token Analizi

Hedera Nedir: 2025'teki Blok Zinciri teknolojisi ve uygulama durumlarını Anlamak
Bored Ape Yacht Club NFT Koleksiyonu’nu Keşfetmek: Detaylı Bir Rehber
2024 yılında maksimum karlılık sağlayan en iyi ASIC madencilik seçenekleri

Blockchain Ekosisteminde Gas Ücretlerinin Kapsamlı İncelemesi
ENS Alan Adınızı Kaydetme Rehberi: Adım Adım Talimatlar

GameFi Devrimi’nde Oyna-Kazan Fırsatlarını Keşfetmek