ROUTE ile TRX: Arazi Performansı ve Özelliklerinin Kapsamlı Karşılaştırması


Giriş: ROUTE ile TRX Yatırımı Karşılaştırması
Kripto para piyasasında, Router Protocol (ROUTE) ile TRON (TRX) karşılaştırması yatırımcılar için öne çıkan bir gündemdir. Her iki varlık, piyasa değeri sıralaması, kullanım alanları ve fiyat performansı açısından dikkate değer farklılıklar gösterirken, kripto varlık ekosisteminde de kendilerine özgü pozisyonları temsil etmektedir.
Router Protocol (ROUTE): 2024 yılında piyasaya sürülen ROUTE, zincir soyutlama protokolüyle zincirler arası transfer ve mesajlaşmayı sorunsuz şekilde mümkün kılarak piyasa tarafından benimsenmiştir.
TRON (TRX): 2017’den bu yana merkeziyetsiz içerik eğlence sistemi olarak öne çıkan TRX, küresel çapta en yüksek işlem hacmi ve piyasa değerine sahip kripto paralardan biri olmuştur.
Bu makale, ROUTE ve TRX’in yatırım değerlerini; tarihsel fiyat eğilimleri, arz mekanizmaları, kurumsal benimseme, teknik ekosistemler ve gelecek öngörüleri temelinde kapsamlı şekilde analiz ederek yatırımcıların en çok merak ettiği soruya yanıt arayacaktır:
"Şu an için hangisi daha avantajlı bir yatırım?"
I. Fiyat Geçmişi Karşılaştırması ve Güncel Piyasa Durumu
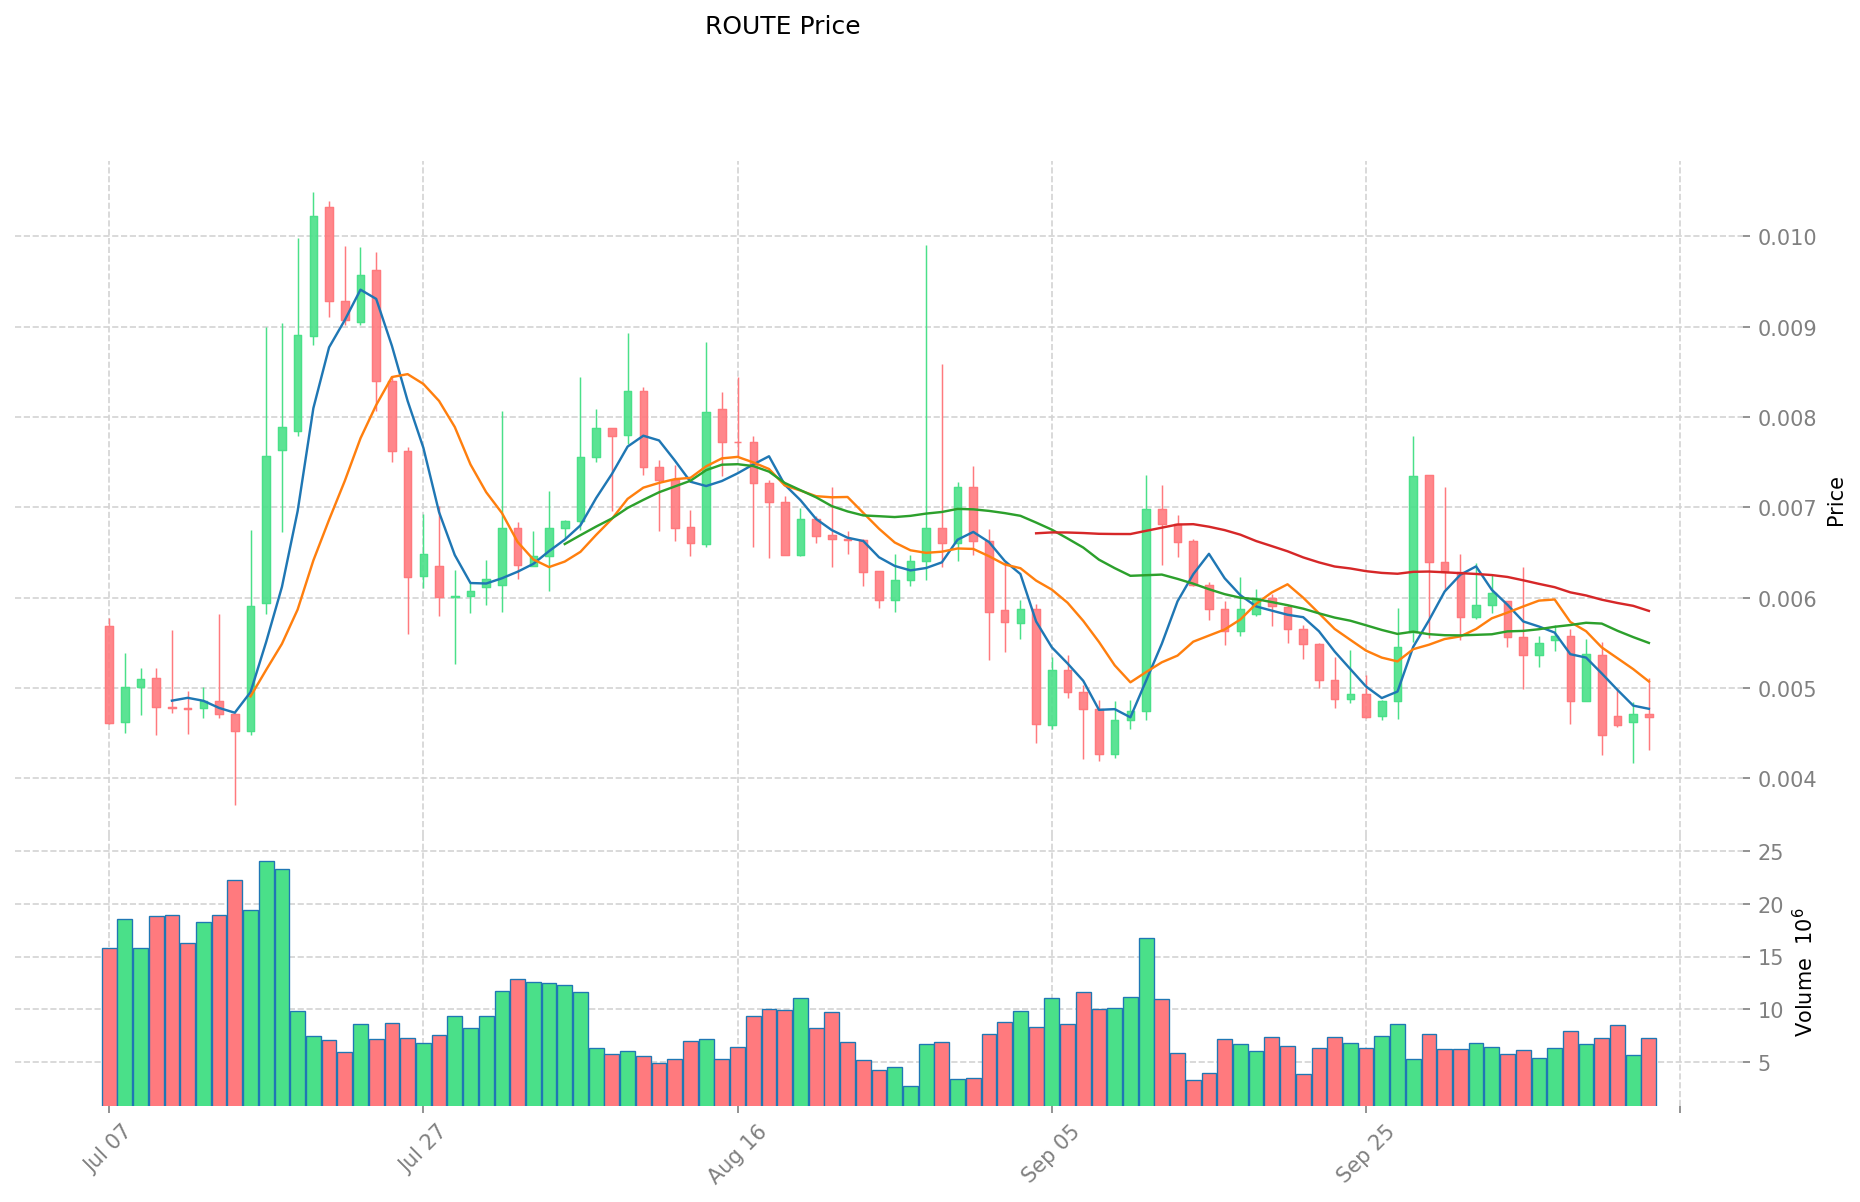
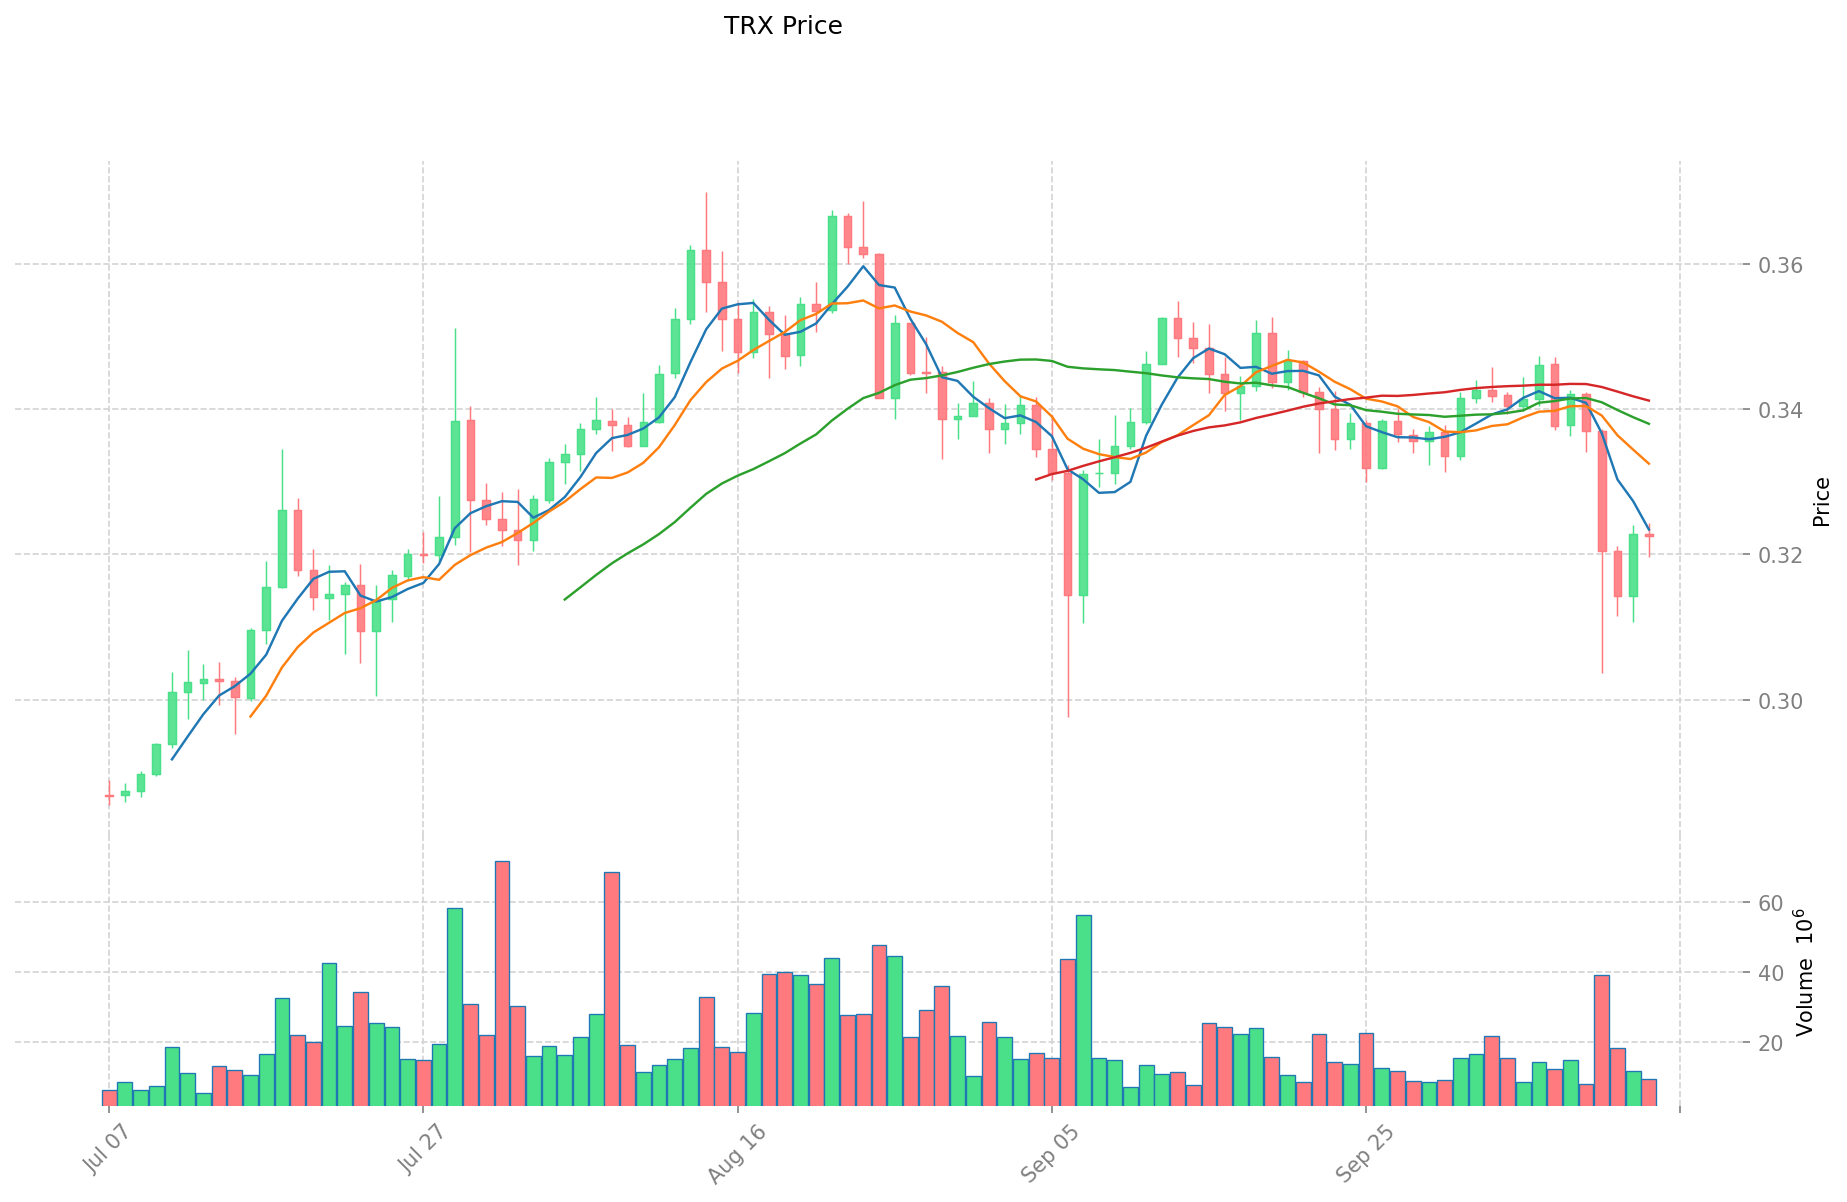
ROUTE (Coin A) ve TRX (Coin B) Tarihsel Fiyat Eğilimleri
- 2024: TRX, 4 Aralık 2024’te 0,431288 $ ile tüm zamanların en yüksek seviyesine ulaşmış; bu, önemli piyasa gelişmeleriyle ilişkilendirilmektedir.
- 2025: ROUTE, 15 Temmuz 2025’te 0,0037 $ ile tüm zamanların en düşük seviyesini görmüş ve bu, büyük ölçüde genel piyasa koşullarından etkilenmiştir.
- Kıyaslama: Son piyasa döngülerinde, ROUTE 0,08108 $’dan mevcut 0,004682 $ seviyesine gerilerken; TRX ise daha istikrarlı seyretmiş ve şu an 0,32263 $ ile zirvesine oldukça yakın işlem görmektedir.
Güncel Piyasa Durumu (14 Ekim 2025)
- ROUTE güncel fiyat: 0,004682 $
- TRX güncel fiyat: 0,32263 $
- 24 saatlik işlem hacmi: ROUTE 33.632,90 $ — TRX 2.992.489,40 $
- Piyasa Duyarlılık Endeksi (Korku & Açgözlülük Endeksi): 38 (Korku)
Canlı fiyatları görmek için tıklayın:
- ROUTE güncel fiyatını incele Piyasa Fiyatı
- TRX güncel fiyatını incele Piyasa Fiyatı
II. ROUTE ve TRX’in Yatırım Değerini Belirleyen Temel Faktörler
Arz Mekanizmaları Karşılaştırması (Tokenomik)
- ROUTE: Maksimum arzı 1.000.000 token ile sabitlenmiştir; bunun %55’i topluluğa (emisyon ve rezervler) aktarılmıştır
- TRX: Deflasyonist model, coin yakımı uygulanıyor; başlangıçta 100 milyar token oluşturulmuştu
- 📌 Tarihsel eğilim: ROUTE gibi sınırlı arzlı kripto varlıklar, benimseme arttıkça fiyatında artış görme eğilimindeyken; TRX’in yakım mekanizması, kademeli deflasyonist baskı yaratmayı hedefler.
Kurumsal Benimsenme ve Piyasa Uygulamaları
- Kurumsal varlıklar: TRX, milyarlarca doları yöneten TRON DAO Reserve ile daha güçlü bir kurumsal altyapıya sahiptir
- Kurumsal kullanım: TRX, ödeme sistemleri ve sınır ötesi işlemlerde daha yaygın ve çoklu iş ortaklıklarıyla benimsenmiştir
- Regülasyon yaklaşımı: TRX bazı pazarlarda daha fazla düzenleyici incelemeye tabi; ROUTE ise nispeten düşük hacmiyle şu an daha az dikkat çekmektedir
Teknik Gelişim ve Ekosistem Oluşturma
- ROUTE teknik güncellemeleri: Zincirler arası yönlendirme optimizasyonu ve doğrulayıcı sistemi geliştirmesi odaklı
- TRX teknik geliştirme: TRON 4.0 ile ağ ölçeklenebilirliği artırıldı ve DeFi protokolleriyle entegrasyon genişliyor
- Ekosistem karşılaştırması: TRX, DeFi, NFT, ödeme ve dApp’leri kapsayan büyük bir ekosisteme sahipken; ROUTE, esas olarak zincirler arası birlikte çalışabilirlik çözümlerine odaklanıyor
Makroekonomik ve Piyasa Döngüleri
- Enflasyon dönemlerinde performans: TRX, enflasyonist dönemlerde görece daha istikrarlı bir seyir izledi
- Makroekonomik para politikası: Her iki token da faiz politikalarına bağlı olarak genel kripto piyasasıyla birlikte hareket ediyor
- Jeopolitik faktörler: TRX, sınır ötesi ödemelerde USD alternatifi arayan bölgelerde daha fazla benimseniyor III. 2025-2030 Fiyat Tahmini: ROUTE ve TRX
Kısa Vadeli Tahmin (2025)
- ROUTE: Temkinli 0,00269874 $ - 0,004653 | İyimser 0,004653 $ - 0,00688644
- TRX: Temkinli 0,1902691 $ - 0,32249 | İyimser 0,32249 $ - 0,3708635
Orta Vadeli Tahmin (2027)
- ROUTE büyüme evresine girebilir; tahmini fiyat aralığı: 0,004357292544 $ - 0,009327329352 $
- TRX boğa piyasasına girebilir; tahmini fiyat aralığı: 0,251167305375 $ - 0,578083480625 $
- Ana etkenler: Kurumsal fon girişi, ETF, ekosistem gelişimi
Uzun Vadeli Tahmin (2030)
- ROUTE: Temel senaryo 0,009920166235689 $ - 0,014285039379393 | İyimser senaryo 0,014285039379393 $+
- TRX: Temel senaryo 0,321356322821175 $ - 0,595104301520695 | İyimser senaryo 0,595104301520695 $ - 0,845048108159387 $
Feragatname: Bu tahminler, geçmiş veriler ve piyasa analizine dayanmaktadır. Kripto para piyasaları yüksek dalgalanma potansiyeli taşır ve hızla değişebilir. Bu içerik yatırım tavsiyesi değildir. Lütfen yatırım kararı almadan önce kendi araştırmanızı yapınız.
ROUTE:
| 年份 | 预测最高价 | 预测平均价格 | 预测最低价 | 涨跌幅 |
|---|---|---|---|---|
| 2025 | 0.00688644 | 0.004653 | 0.00269874 | 0 |
| 2026 | 0.0078468192 | 0.00576972 | 0.0041541984 | 23 |
| 2027 | 0.009327329352 | 0.0068082696 | 0.004357292544 | 45 |
| 2028 | 0.00903593541312 | 0.008067799476 | 0.00548610364368 | 72 |
| 2029 | 0.011288465026819 | 0.00855186744456 | 0.007098049978984 | 82 |
| 2030 | 0.014285039379393 | 0.009920166235689 | 0.009225754599191 | 111 |
TRX:
| 年份 | 预测最高价 | 预测平均价格 | 预测最低价 | 涨跌幅 |
|---|---|---|---|---|
| 2025 | 0.3708635 | 0.32249 | 0.1902691 | 0 |
| 2026 | 0.450679775 | 0.34667675 | 0.325876145 | 7 |
| 2027 | 0.578083480625 | 0.3986782625 | 0.251167305375 | 23 |
| 2028 | 0.542102767434375 | 0.4883808715625 | 0.395588505965625 | 51 |
| 2029 | 0.674966783542953 | 0.515241819498437 | 0.432803128378687 | 59 |
| 2030 | 0.845048108159387 | 0.595104301520695 | 0.321356322821175 | 84 |
IV. Yatırım Stratejisi Karşılaştırması: ROUTE vs TRX
Uzun Vadeli ve Kısa Vadeli Yatırım Stratejileri
- ROUTE: Zincirler arası birlikte çalışabilirlik ve ekosistem potansiyeline odaklanan yatırımcılar için uygundur
- TRX: İstikrar ve gelişmiş bir blokzincir ekosistemine erişim arayanlar için uygundur
Risk Yönetimi ve Varlık Dağılımı
- Temkinli yatırımcılar: ROUTE %10 — TRX %90
- Agresif yatırımcılar: ROUTE %30 — TRX %70
- Koruma araçları: Stablecoin tahsisi, opsiyonlar, çoklu döviz portföyleri
V. Potansiyel Risk Karşılaştırması
Piyasa Riskleri
- ROUTE: Piyasa değeri ve işlem hacmi düşük olduğu için volatilitesi yüksektir
- TRX: Genel piyasa trendlerine ve diğer köklü platformlarla rekabete açıktır
Teknik Riskler
- ROUTE: Ölçeklenebilirlik ve ağ istikrarı sorunları
- TRX: Madencilik gücü yoğunlaşması ve güvenlik açıkları
Düzenleyici Riskler
- Küresel düzenleyici politikalar her iki projeyi farklı şekilde etkileyebilir; TRX daha büyük pazar payı nedeniyle daha fazla denetimle karşılaşabilir
VI. Sonuç: Hangisi Daha Avantajlı?
📌 Yatırım Değeri Özeti:
- ROUTE avantajları: Yenilikçi zincirler arası teknoloji, birlikte çalışabilirlik pazarında büyüme potansiyeli
- TRX avantajları: Gelişmiş ekosistem, geniş ölçekli benimseme, nispeten istikrarlı fiyat hareketi
✅ Yatırım Tavsiyesi:
- Yeni yatırımcılar: TRX’in piyasadaki köklü konumu nedeniyle daha yüksek oranla TRX’e yönelmeli
- Deneyimli yatırımcılar: Hem ROUTE hem TRX içeren dengeli bir portföy ile farklı segmentlerden faydalanmalı
- Kurumsal yatırımcılar: ROUTE’un büyüme potansiyeli ile TRX’in köklü piyasa gücünü birlikte değerlendirmeli
⚠️ Risk Uyarısı: Kripto para piyasalarında dalgalanma yüksektir. Bu makale yatırım tavsiyesi değildir. None
VII. Sıkça Sorulan Sorular
S1: ROUTE ve TRX’in en temel farkları nedir? C: ROUTE, zincirler arası birlikte çalışabilirliğe odaklanan yeni bir protokoldür; TRX ise DeFi, NFT ve dApp’lerden oluşan geniş bir ekosisteme sahip köklü bir platformdur. ROUTE’da arz 1 milyon token ile sabitken, TRX deflasyonist coin yakım modelini benimser.
S2: Hangi kripto para daha fazla fiyat istikrarı göstermiştir? C: Tarihsel verilere göre TRX, ROUTE’a kıyasla daha yüksek fiyat istikrarı sunmuştur. TRX şu an zirvesine daha yakın işlem görürken, ROUTE daha güçlü dalgalanmalar yaşamıştır.
S3: Piyasa değeri ve işlem hacmi nasıl karşılaştırılır? C: TRX’in piyasa değeri ve işlem hacmi, ROUTE’a göre çok daha büyüktür. Güncel verilere göre, TRX’in 24 saatlik işlem hacmi 2.992.489,40 $ iken, ROUTE’un hacmi 33.632,90 $’dır.
S4: ROUTE ve TRX’in yatırım değerini etkileyen temel unsurlar nelerdir? C: Arz yapısı, kurumsal benimseme, teknik gelişim, ekosistem inşası ve makroekonomik koşullar başlıca unsurlardır. TRX, piyasadaki köklü konumu sayesinde genellikle bu alanlarda daha güçlü performans sergiler.
S5: ROUTE ve TRX’in uzun vadeli fiyat tahminleri nasıl karşılaştırılır? C: 2030 için, ROUTE’un temel senaryosu 0,009920166235689 $ - 0,014285039379393 $; TRX’in ise 0,321356322821175 $ - 0,595104301520695 $ aralığını öngörmektedir. TRX’in fiyatı daha yüksek olsa da, ROUTE mevcut fiyatına kıyasla daha fazla büyüme potansiyeli sunabilir.
S6: ROUTE ve TRX için önerilen yatırım stratejileri nelerdir? C: Temkinli yatırımcılar ROUTE’a %10, TRX’e %90; agresif yatırımcılar ise ROUTE’a %30, TRX’e %70 oranında yatırım yapabilir. Dağılım, bireysel risk iştahı ve yatırım hedeflerine göre şekillenmelidir.
S7: ROUTE ve TRX yatırımlarında hangi ana riskler söz konusudur? C: ROUTE, düşük piyasa değeri ve işlem hacmi nedeniyle yüksek volatilite ve ölçeklenebilirlik/ağ istikrarı riskleri taşır. TRX ise genel piyasa trendlerine karşı daha hassas olup, geniş ölçekli varlığı nedeniyle daha fazla düzenleyici incelemeye tabidir.
Share
Content
Giriş: ROUTE ile TRX Yatırımı Karşılaştırması
I. Fiyat Geçmişi Karşılaştırması ve Güncel Piyasa Durumu
II. ROUTE ve TRX’in Yatırım Değerini Belirleyen Temel Faktörler
IV. Yatırım Stratejisi Karşılaştırması: ROUTE vs TRX
V. Potansiyel Risk Karşılaştırması
VI. Sonuç: Hangisi Daha Avantajlı?
VII. Sıkça Sorulan Sorular
How to Buy Cryptocurrency


Trending Cryptocurrencies


FLR ve TRX: Geleceğin Merkeziyetsiz Finans Dünyası İçin İki Yenilikçi Blockchain Platformunun Karşılaştırılması

BERA ve TRX: Uzun Vadeli Yatırım Potansiyeli Açısından Hangi Kripto Para Daha Avantajlı?

ASTRA ve TRX: İki Popüler Fitness Ekipmanının Performans ve Özellikleri Karşılaştırılıyor

TRX vs CHZ: Spor ve Eğlence Sektöründe Blockchain Devlerinin Rekabeti
Just (JST) yatırım için uygun mu?: Bu yeni kripto paranın potansiyelini analiz ediyoruz
COTI ile TRX: Dijital finans ekosisteminde öne çıkan iki kriptoparanın karşılaştırmalı analizi

Kripto Parada Proof of Reserve'ın Anlaşılması

Ethereum Katman 2 Çözümlerini Keşfetmek: Optimism'e Odaklanma
Ethereum İşlem Maliyetlerini Azaltmaya Yönelik Etkin Stratejiler

NFT Nadirliğinde Uzmanlaşma: Puanlama ve Değerleme İçin Kapsamlı Rehber
Blokzincir teknolojisinde akıllı sözleşmelerin rolü