RENDER vs SAND: The Battle of 3D Graphics Technologies in Modern Game Development
Introduction: Investment Comparison between RENDER and SAND
In the cryptocurrency market, the comparison between RENDER Network vs The Sandbox has been an unavoidable topic for investors. The two not only show significant differences in market cap ranking, application scenarios, and price performance but also represent different positioning in the crypto asset space.
Render Network (RENDER): Since its launch, it has gained market recognition for its decentralized GPU rendering capabilities.
The Sandbox (SAND): Introduced as a virtual game world, it has become known for its blockchain-based gaming ecosystem.
This article will comprehensively analyze the investment value comparison between RENDER and SAND, focusing on historical price trends, supply mechanisms, institutional adoption, technological ecosystems, and future predictions, attempting to answer the question investors are most concerned about:
"Which is the better buy right now?"
I. Price History Comparison and Current Market Status
RENDER (Coin A) and SAND (Coin B) Historical Price Trends
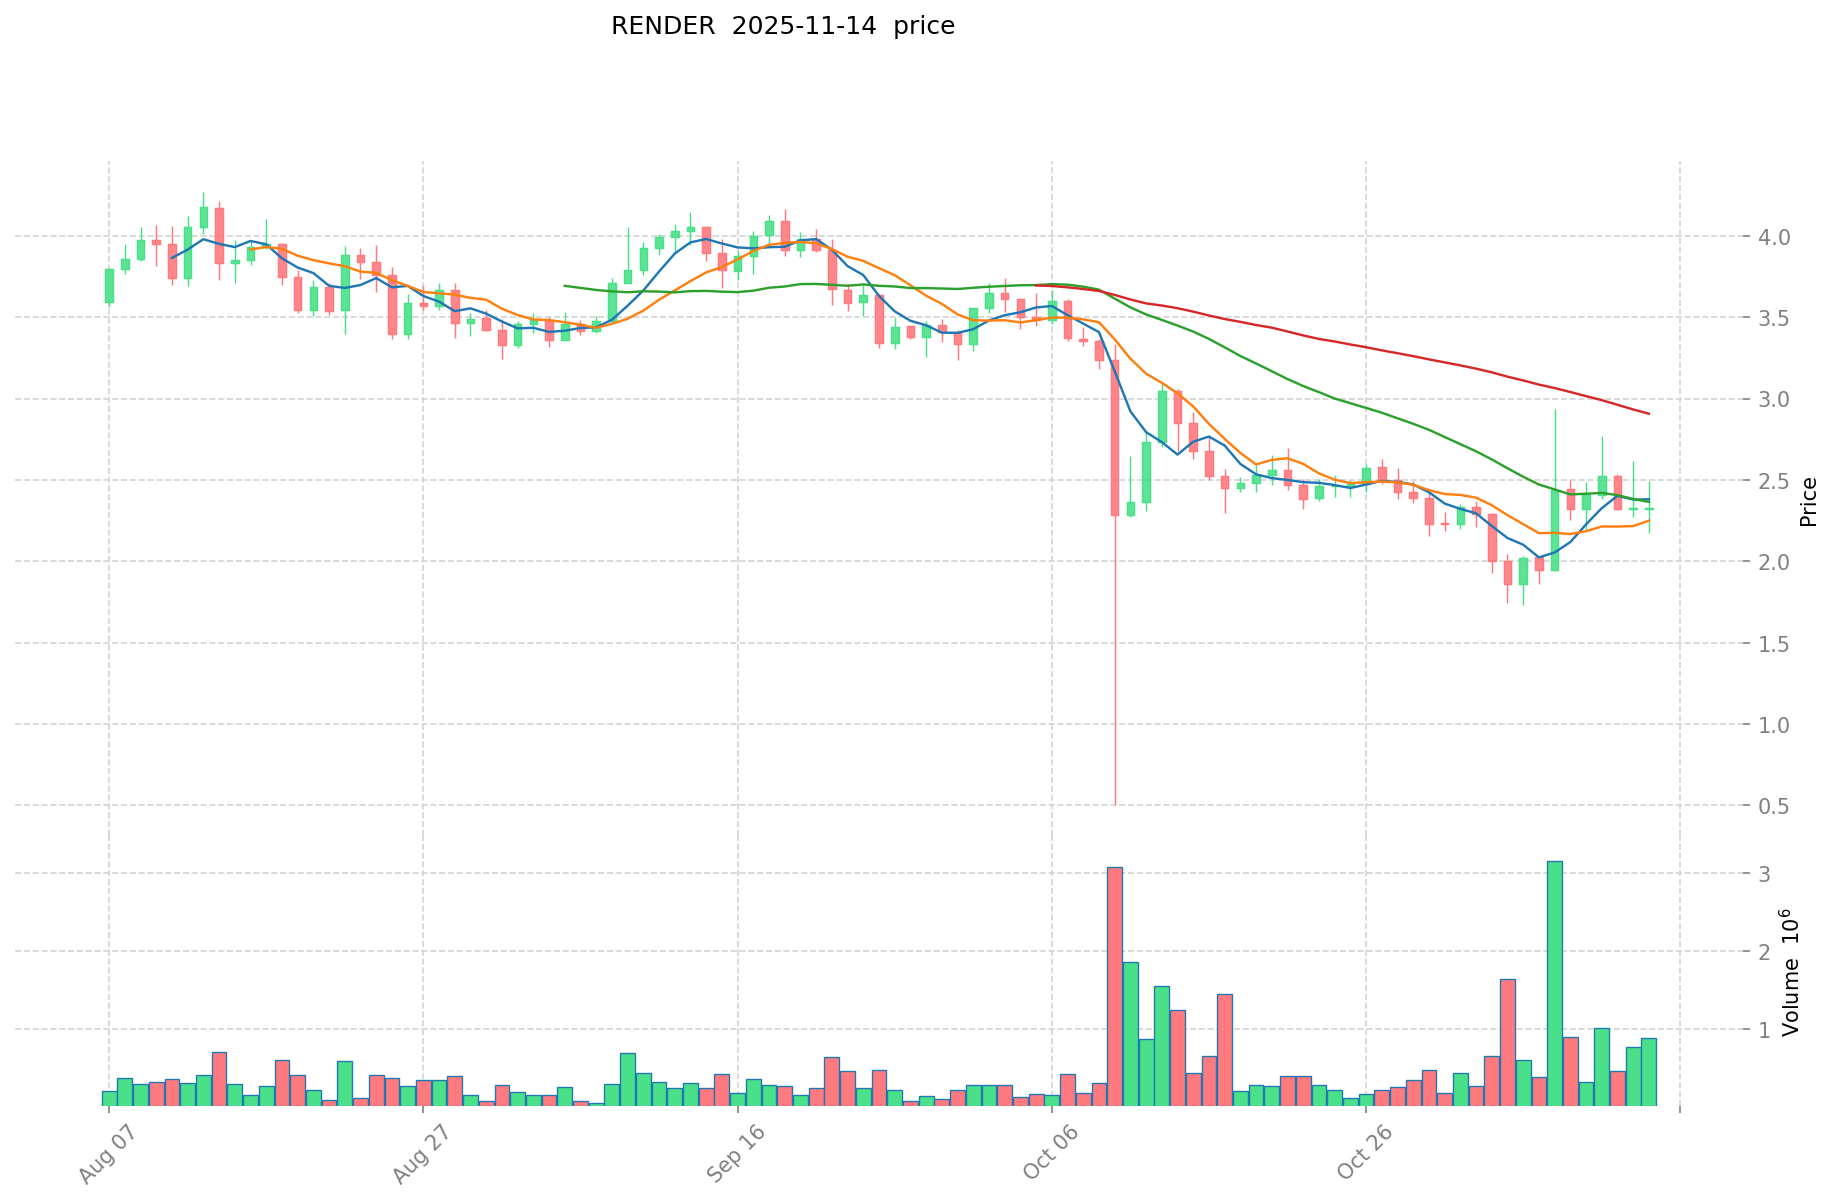
- 2024: RENDER reached its all-time high of $13.60 on March 18, 2024, likely due to significant developments in the Render Network ecosystem.
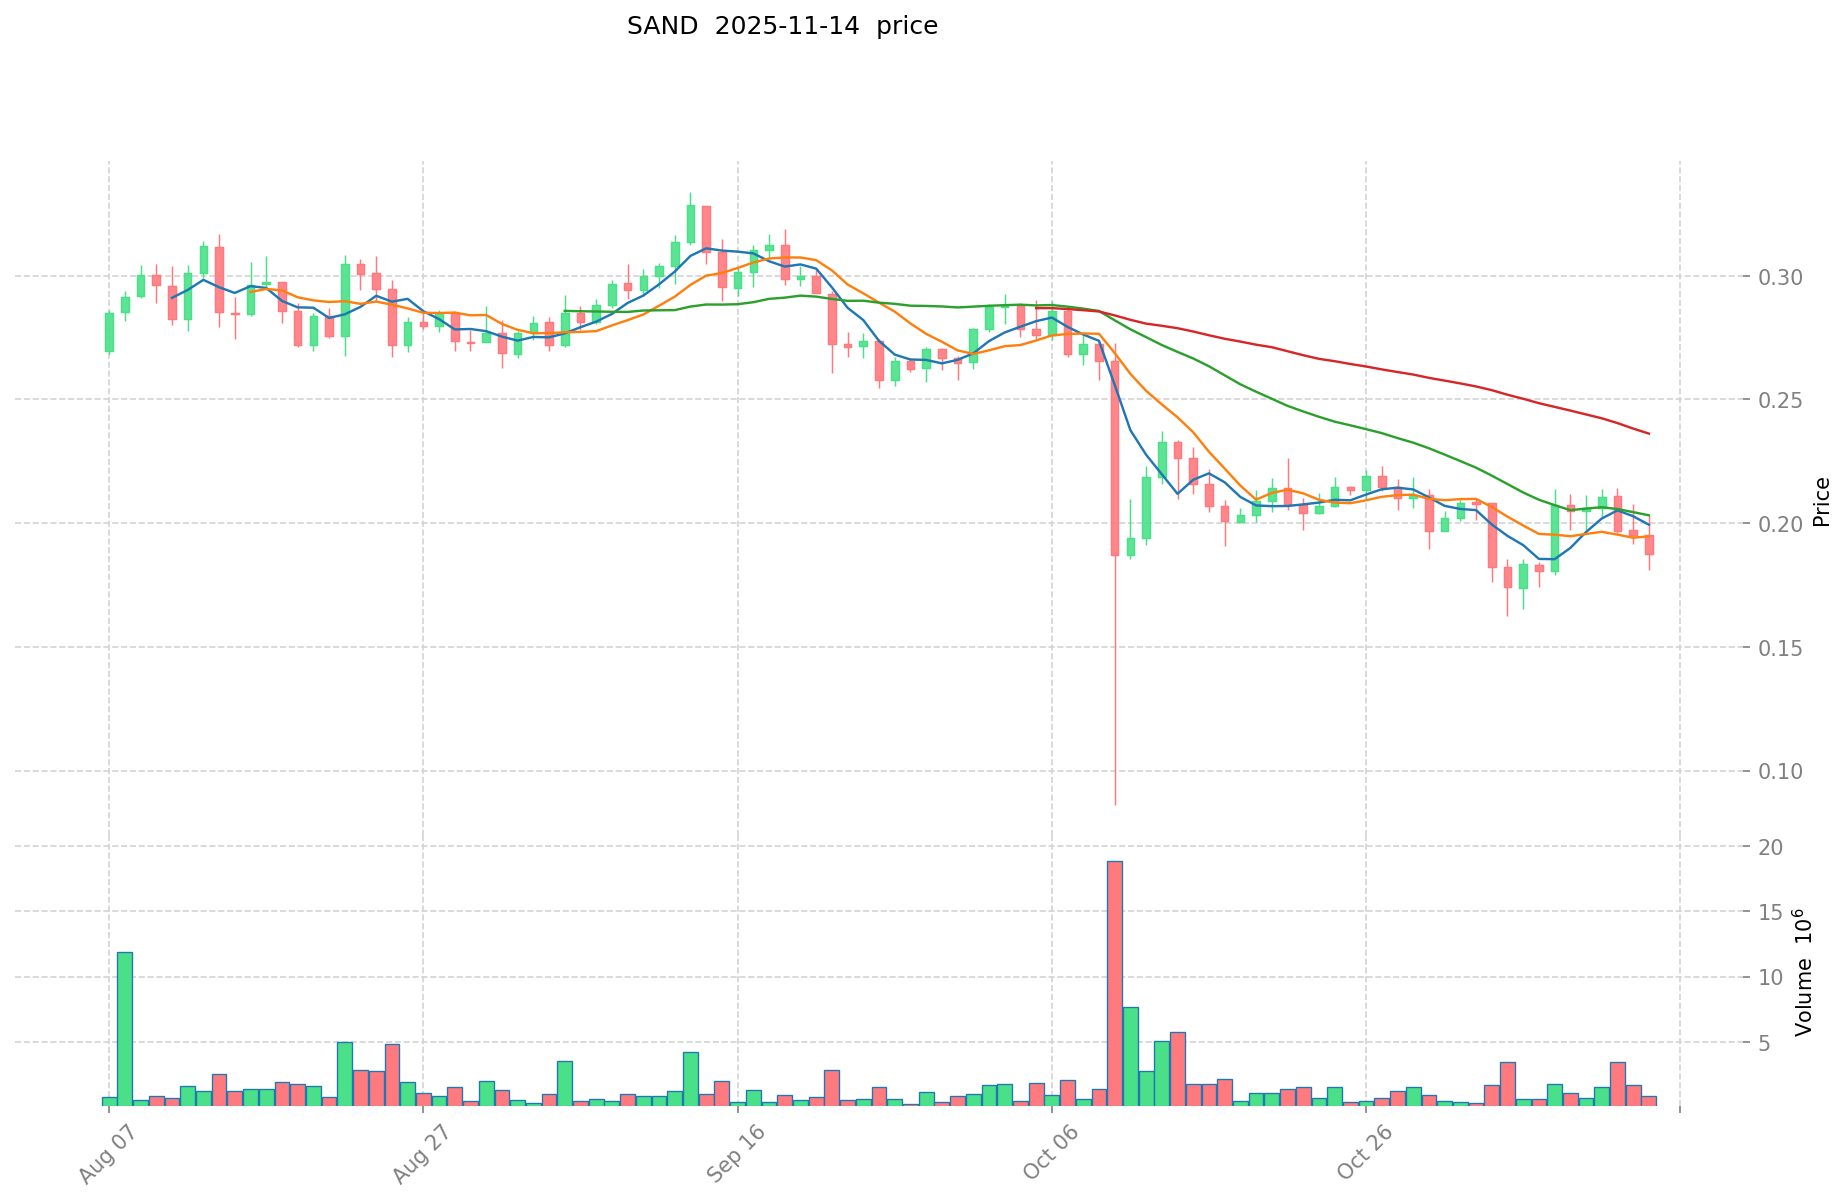
- 2021: SAND experienced a dramatic price surge, reaching its all-time high of $8.40 on November 25, 2021, possibly influenced by the metaverse hype.
- Comparative analysis: In the current market cycle, RENDER has dropped from its ATH of $13.60 to the current price of $2.218, while SAND has fallen from its peak of $8.40 to $0.1861.
Current Market Situation (2025-11-15)
- RENDER current price: $2.218
- SAND current price: $0.1861
- 24-hour trading volume: RENDER $1,947,175.32 vs SAND $238,825.50
- Market Sentiment Index (Fear & Greed Index): 16 (Extreme Fear)
Click to view real-time prices:
- Check RENDER current price Market Price
- Check SAND current price Market Price
II. Core Factors Affecting the Investment Value of RENDER vs SAND
Supply Mechanism Comparison (Tokenomics)
-
RENDER: Maximum supply of 530,962,615 RENDER tokens with a deflationary model where tokens are burned when used for rendering services
-
SAND: Maximum supply of 3 billion SAND tokens with 25.82% currently in circulation, implementing a staking mechanism for holders to earn rewards
-
📌 Historical Pattern: Limited supply tokens like RENDER tend to experience higher price volatility when demand increases, while SAND's larger supply with gradual release helps stabilize price but may create selling pressure during token unlocks.
Institutional Adoption and Market Applications
- Institutional Holdings: RENDER has attracted investment from Multicoin Capital and Alameda Research, while SAND has secured backing from SoftBank, Galaxy Interactive, and Adidas
- Enterprise Adoption: RENDER offers rendering solutions for 3D content creators and studios, while SAND partners with major brands like Adidas, Gucci, and Warner Music for metaverse experiences
- Regulatory Attitudes: Both tokens face similar regulatory scrutiny as utility tokens in metaverse/creator economies, with neither facing specific regulatory challenges in major markets
Technical Development and Ecosystem Building
- RENDER Technical Upgrades: Implementing GPU/CPU network expansion and developing AI rendering capabilities to enhance efficiency and reduce costs
- SAND Technical Development: Focusing on metaverse infrastructure with improved land management and The Sandbox Game Maker 2.0 release
- Ecosystem Comparison: RENDER excels in rendering services for creative professionals, while SAND has established a more diversified ecosystem with gaming, virtual real estate, and NFT marketplaces
Macroeconomic Factors and Market Cycles
- Performance During Inflation: RENDER's utility in content creation provides some inflation resistance, while SAND's metaverse focus may be more susceptible to discretionary spending cuts
- Monetary Policy Impact: Both tokens show high correlation with broader crypto market reactions to Fed policy, with risk-on assets generally benefiting from looser monetary conditions
- Geopolitical Factors: RENDER benefits from the global increase in demand for 3D content creation, while SAND's metaverse positioning aligns with major tech companies' strategic directions
III. 2025-2030 Price Prediction: RENDER vs SAND
Short-term Prediction (2025)
- RENDER: Conservative $1.50 - $2.21 | Optimistic $2.21 - $2.58
- SAND: Conservative $0.15 - $0.19 | Optimistic $0.19 - $0.19
Mid-term Prediction (2027)
- RENDER may enter a growth phase, with prices expected in the range of $2.12 - $2.80
- SAND may enter a growth phase, with prices expected in the range of $0.15 - $0.33
- Key drivers: Institutional capital inflow, ETFs, ecosystem development
Long-term Prediction (2030)
- RENDER: Base scenario $3.81 - $5.29 | Optimistic scenario $5.29 - $5.29
- SAND: Base scenario $0.31 - $0.39 | Optimistic scenario $0.39 - $0.39
Disclaimer
RENDER:
| 年份 | 预测最高价 | 预测平均价格 | 预测最低价 | 涨跌幅 |
|---|---|---|---|---|
| 2025 | 2.58336 | 2.208 | 1.50144 | 0 |
| 2026 | 3.0425136 | 2.39568 | 1.8207168 | 8 |
| 2027 | 2.800669704 | 2.7190968 | 2.120895504 | 22 |
| 2028 | 3.8638365528 | 2.759883252 | 2.18030776908 | 24 |
| 2029 | 4.30541787312 | 3.3118599024 | 2.351420530704 | 49 |
| 2030 | 5.2940080539864 | 3.80863888776 | 3.1230838879632 | 71 |
SAND:
| 年份 | 预测最高价 | 预测平均价格 | 预测最低价 | 涨跌幅 |
|---|---|---|---|---|
| 2025 | 0.193336 | 0.1859 | 0.152438 | 0 |
| 2026 | 0.26167284 | 0.189618 | 0.12704406 | 2 |
| 2027 | 0.327185859 | 0.22564542 | 0.1511824314 | 21 |
| 2028 | 0.30405720345 | 0.2764156395 | 0.14373613254 | 48 |
| 2029 | 0.32796715626675 | 0.290236421475 | 0.21187258767675 | 56 |
| 2030 | 0.389468253977302 | 0.309101788870875 | 0.228735323764447 | 66 |
IV. Investment Strategy Comparison: RENDER vs SAND
Long-term vs Short-term Investment Strategies
- RENDER: Suitable for investors focused on content creation and rendering technology potential
- SAND: Suitable for investors interested in metaverse and gaming ecosystem growth
Risk Management and Asset Allocation
- Conservative investors: RENDER: 30% vs SAND: 70%
- Aggressive investors: RENDER: 60% vs SAND: 40%
- Hedging tools: Stablecoin allocation, options, cross-currency portfolios
V. Potential Risk Comparison
Market Risks
- RENDER: High volatility due to limited supply and niche market
- SAND: Susceptibility to metaverse and gaming industry trends
Technical Risks
- RENDER: Scalability, network stability
- SAND: Platform adoption, smart contract vulnerabilities
Regulatory Risks
- Global regulatory policies may impact both tokens differently, with potential scrutiny on utility token classifications
VI. Conclusion: Which Is the Better Buy?
📌 Investment Value Summary:
- RENDER advantages: Deflationary model, specialized rendering services, institutional backing
- SAND advantages: Established metaverse ecosystem, brand partnerships, larger market cap
✅ Investment Advice:
- New investors: Consider a balanced approach with a slight preference for SAND due to its more established ecosystem
- Experienced investors: Explore RENDER for potential higher growth in the rendering technology sector
- Institutional investors: Evaluate both for portfolio diversification, with RENDER for tech exposure and SAND for metaverse positioning
⚠️ Risk Warning: The cryptocurrency market is highly volatile. This article does not constitute investment advice. None
VII. FAQ
Q1: What are the key differences between RENDER and SAND? A: RENDER focuses on decentralized GPU rendering for 3D content creators, while SAND is centered around a blockchain-based gaming and metaverse ecosystem. RENDER has a maximum supply of 530,962,615 tokens with a deflationary model, whereas SAND has a 3 billion token cap with 25.82% in circulation.
Q2: Which token has performed better historically? A: RENDER reached its all-time high of $13.60 in March 2024, while SAND peaked at $8.40 in November 2021. As of November 2025, RENDER is trading at $2.218, and SAND at $0.1861, representing significant drops from their respective all-time highs.
Q3: How do the supply mechanisms of RENDER and SAND differ? A: RENDER employs a deflationary model where tokens are burned when used for rendering services. SAND implements a staking mechanism for holders to earn rewards and has a larger supply with gradual release.
Q4: What are the main institutional backers for each token? A: RENDER has attracted investment from Multicoin Capital and Alameda Research. SAND has secured backing from SoftBank, Galaxy Interactive, and Adidas.
Q5: How do the ecosystems of RENDER and SAND compare? A: RENDER excels in rendering services for creative professionals, while SAND has established a more diversified ecosystem with gaming, virtual real estate, and NFT marketplaces.
Q6: What are the long-term price predictions for RENDER and SAND? A: By 2030, RENDER is predicted to reach $3.81 - $5.29 in a base scenario, while SAND is expected to reach $0.31 - $0.39. These predictions are subject to market conditions and should not be considered as financial advice.
Q7: How should investors approach allocating between RENDER and SAND? A: Conservative investors might consider allocating 30% to RENDER and 70% to SAND, while aggressive investors might opt for 60% RENDER and 40% SAND. However, individual risk tolerance and investment goals should guide allocation decisions.
Q8: What are the primary risks associated with investing in RENDER and SAND? A: RENDER faces risks related to high volatility due to limited supply and potential scalability issues. SAND is susceptible to metaverse and gaming industry trends and may face platform adoption challenges. Both tokens are subject to regulatory risks and overall crypto market volatility.
Share
Content
Introduction: Investment Comparison between RENDER and SAND
I. Price History Comparison and Current Market Status
II. Core Factors Affecting the Investment Value of RENDER vs SAND
III. 2025-2030 Price Prediction: RENDER vs SAND
IV. Investment Strategy Comparison: RENDER vs SAND
V. Potential Risk Comparison
VI. Conclusion: Which Is the Better Buy?
VII. FAQ

