REN vs KAVA: Battle of the Cross-Chain DeFi Protocols
Introduction: REN vs KAVA Investment Comparison
In the cryptocurrency market, REN vs KAVA comparison has always been a topic that investors cannot ignore. The two not only have significant differences in market cap ranking, application scenarios, and price performance, but also represent different positioning of crypto assets.
REN (REN): Since its launch in 2018, it has gained market recognition for its distributed dark pool trading protocol for cryptocurrencies.
KAVA (KAVA): Introduced in 2019, it has been hailed as a cross-chain DeFi platform, providing services such as lending and stablecoin issuance for mainstream digital assets.
This article will comprehensively analyze the investment value comparison between REN and KAVA, focusing on historical price trends, supply mechanisms, institutional adoption, technological ecosystems, and future predictions, attempting to answer the question investors care most about:
"Which is the better buy right now?"
I. Price History Comparison and Current Market Status
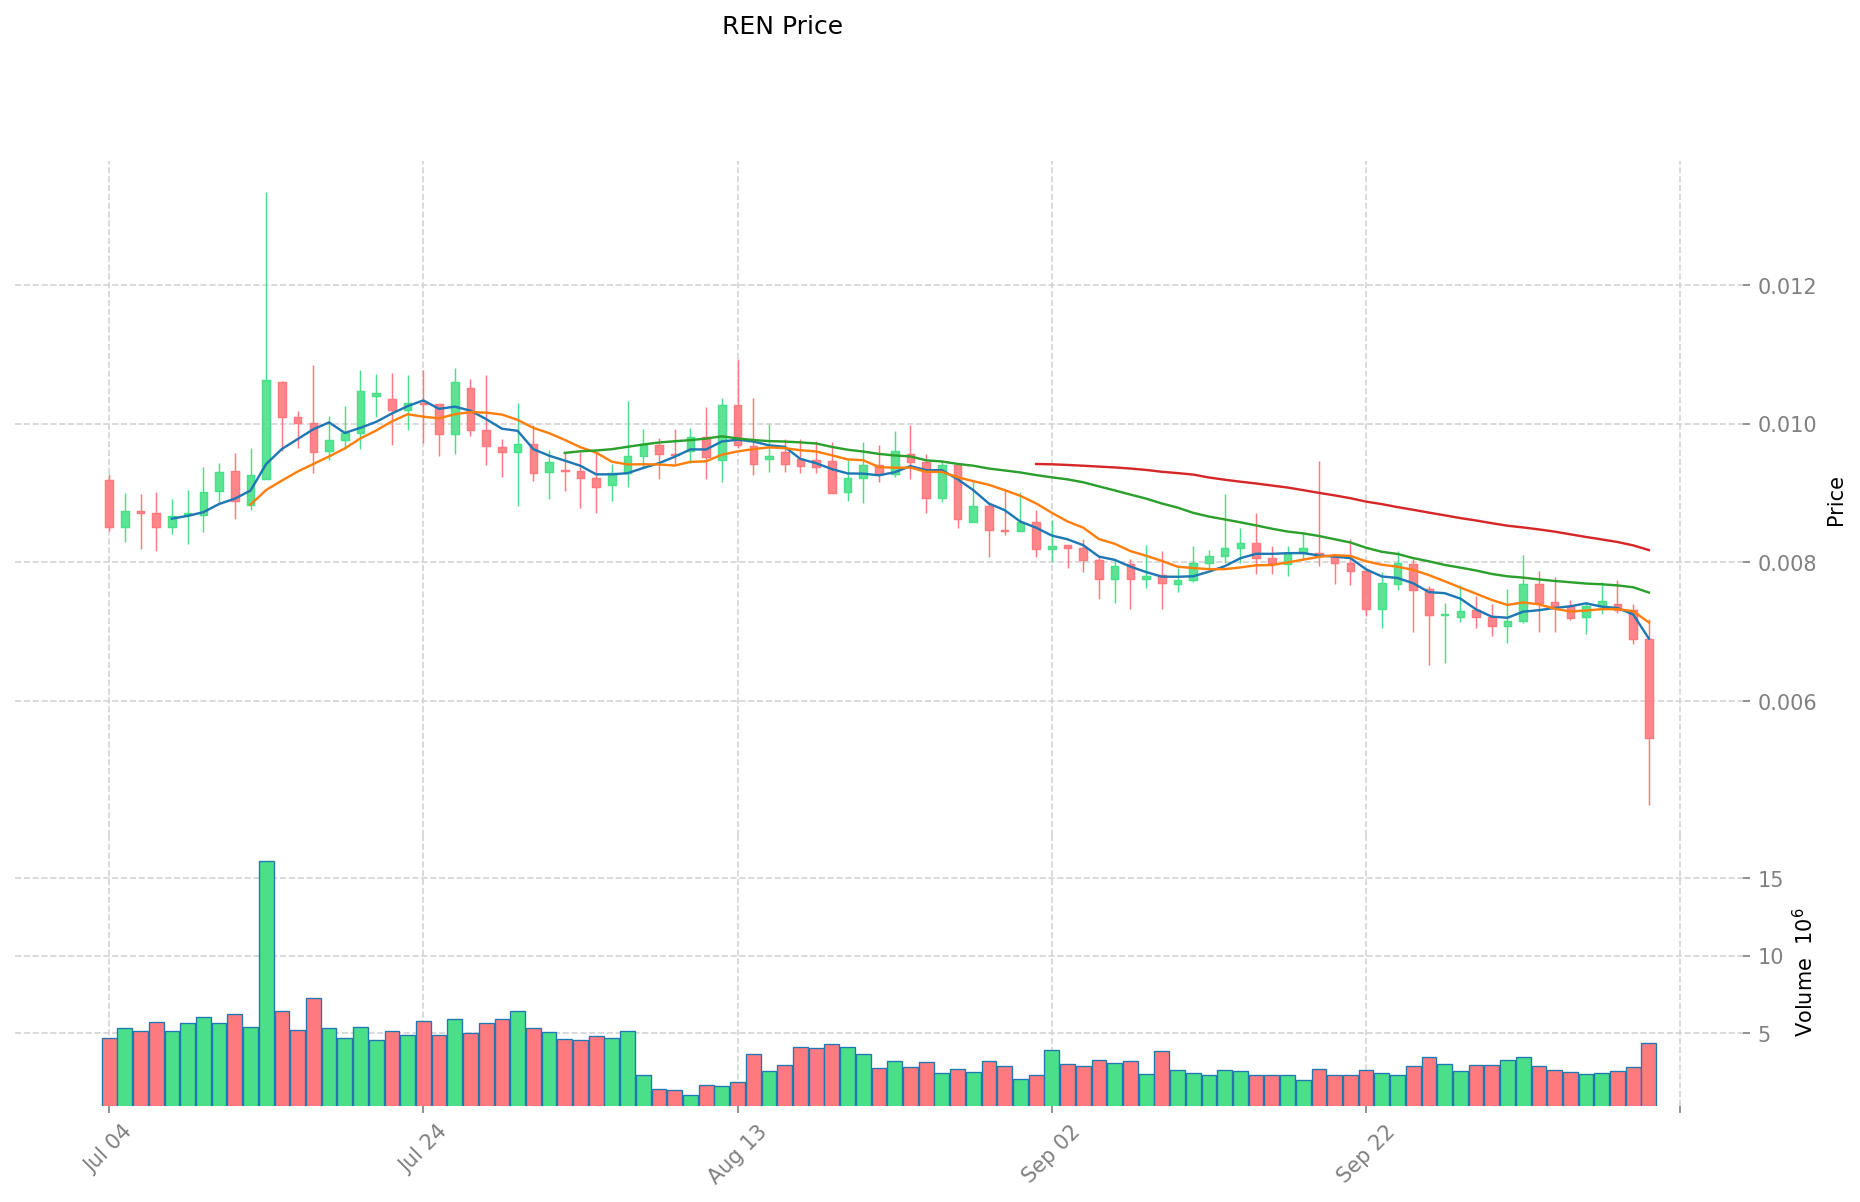
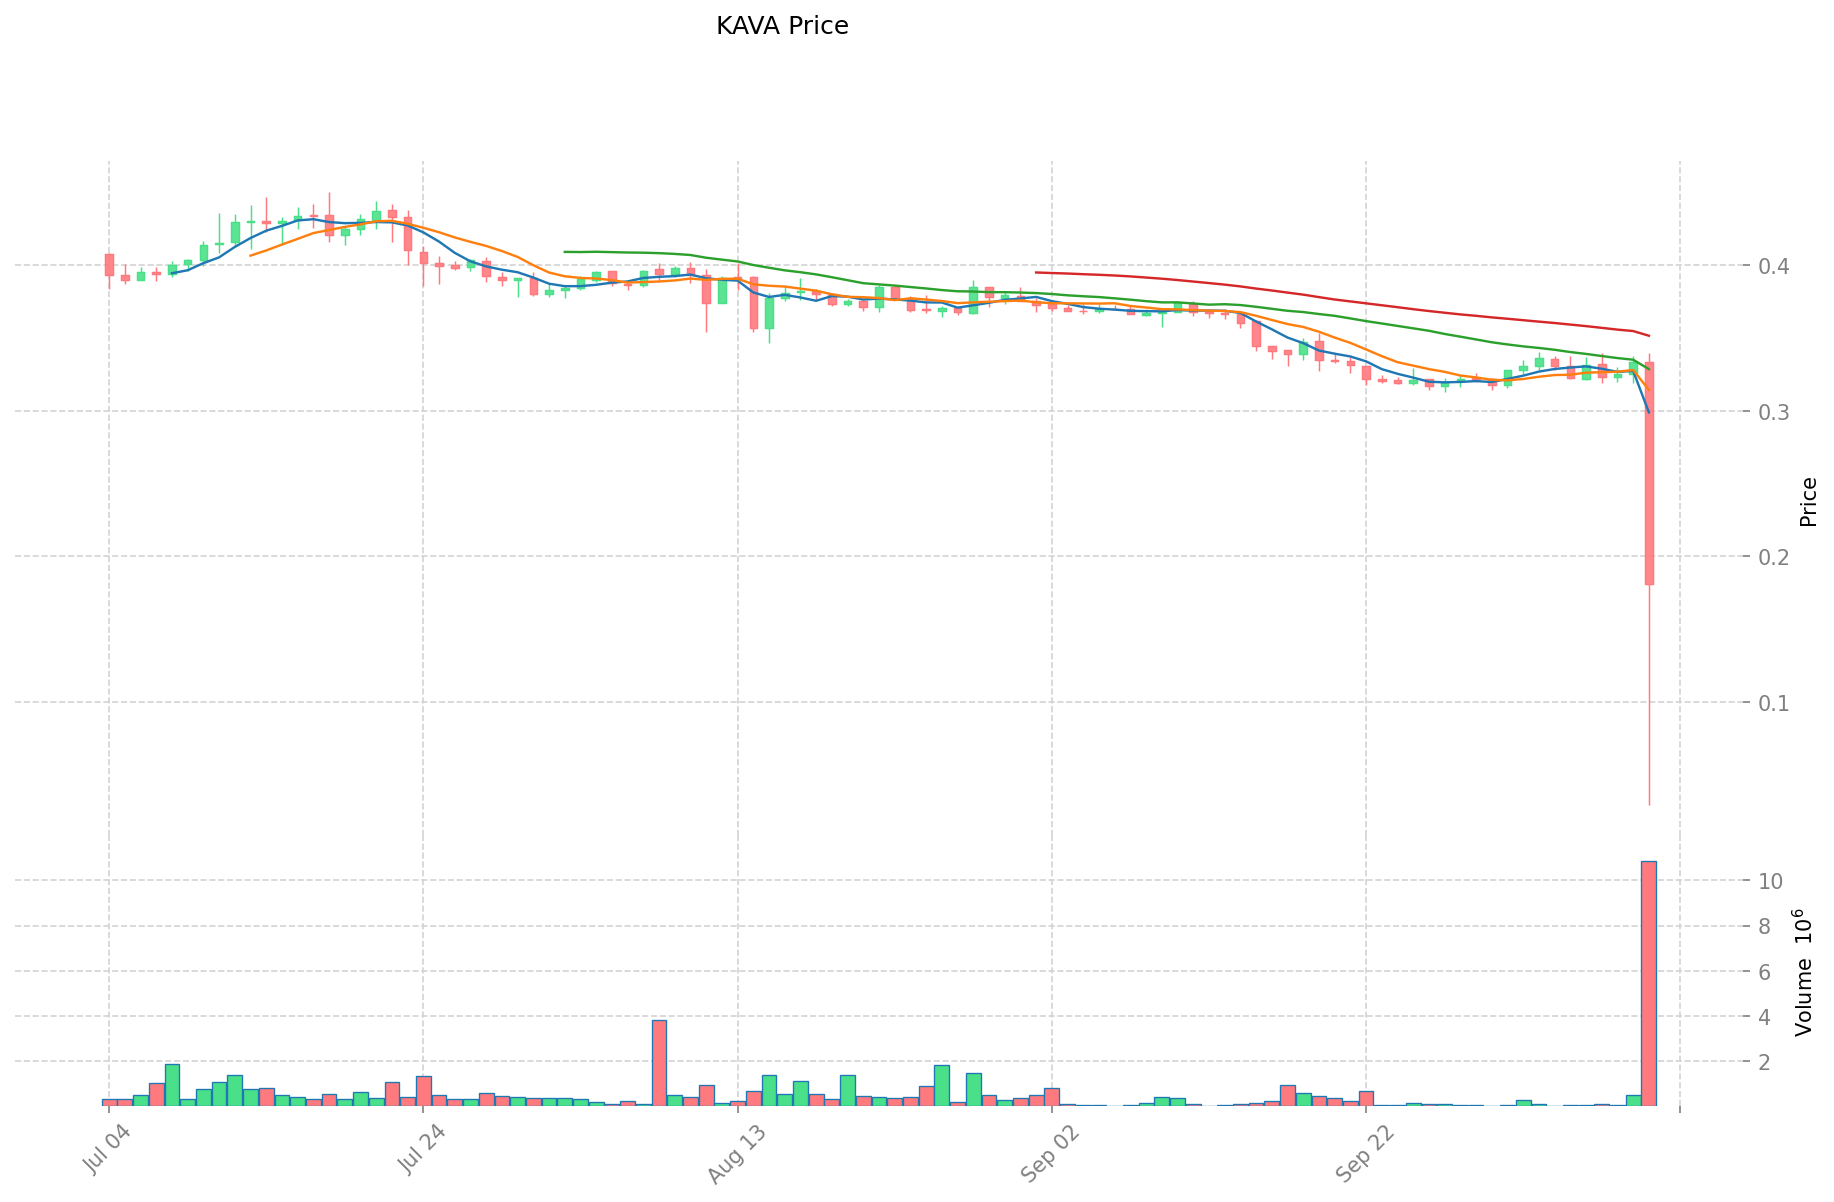
REN and KAVA Historical Price Trends
- 2021: REN reached its all-time high of $1.8 on February 20, 2021.
- 2021: KAVA hit its all-time high of $9.12 on August 30, 2021.
- Comparative analysis: In the current market cycle, REN has dropped from its all-time high of $1.8 to a current price of $0.005169, while KAVA has fallen from $9.12 to $0.1757.
Current Market Situation (2025-10-11)
- REN current price: $0.005169
- KAVA current price: $0.1757
- 24-hour trading volume: REN $28,845.07 vs KAVA $1,665,888.64
- Market Sentiment Index (Fear & Greed Index): 64 (Greed)
Click to view real-time prices:
- View REN current price Market Price
- View KAVA current price Market Price
II. Core Factors Influencing REN vs KAVA Investment Value
Supply Mechanism Comparison (Tokenomics)
- KAVA: Zero-inflation fixed supply ensuring token scarcity
- REN: Not specified in the provided information
- 📌 Historical Pattern: The zero-inflation model of KAVA supports long-term value preservation by maintaining scarcity while governance and incentive mechanisms build demand foundation.
Institutional Adoption and Market Applications
- Institutional Holdings: Current governance of KAVA appears relatively centralized, with larger stakeholders preferring appropriate yields to offset opportunity costs and risks
- Enterprise Adoption: KAVA combines cross-chain communication with financial applications to improve capital efficiency and address real user pain points
- Regulatory Attitudes: Not specified in the provided information
Technical Development and Ecosystem Building
- KAVA Technical Upgrades: Integration with Cosmos blockchain while fusing Ethereum ecosystem through consensus engine; developing DeAI (decentralized AI) capabilities through Kava AI initiative
- REN Technical Development: Not specified in the provided information
- Ecosystem Comparison: KAVA built on Cosmos blockchain allowing users to lock crypto assets and borrow USDX (USD-pegged stablecoin); future value relies on "cross-chain advantage consolidation" and "DeAI innovation implementation"
Macroeconomic Factors and Market Cycles
- Performance in Inflationary Environments: Not specified in the provided information
- Macro Monetary Policy Impact: Not specified in the provided information
- Geopolitical Factors: Not specified in the provided information
III. 2025-2030 Price Prediction: REN vs KAVA
Short-term Prediction (2025)
- REN: Conservative $0.0052368 - $0.005455 | Optimistic $0.005455 - $0.0056732
- KAVA: Conservative $0.12456 - $0.173 | Optimistic $0.173 - $0.19376
Mid-term Prediction (2027-2028)
- REN may enter a growth phase, with estimated prices ranging from $0.00492311568 to $0.009989562576
- KAVA may enter a volatile phase, with estimated prices ranging from $0.099602847 to $0.29539079625
- Key drivers: Institutional capital inflow, ETFs, ecosystem development
Long-term Prediction (2030)
- REN: Base scenario $0.01023216623856 - $0.010948417875259 | Optimistic scenario $0.010948417875259
- KAVA: Base scenario $0.269839492374375 - $0.310315416230531 | Optimistic scenario $0.310315416230531
Disclaimer
REN:
| 年份 | 预测最高价 | 预测平均价格 | 预测最低价 | 涨跌幅 |
|---|---|---|---|---|
| 2025 | 0.0056732 | 0.005455 | 0.0052368 | 5 |
| 2026 | 0.006899484 | 0.0055641 | 0.002948973 | 7 |
| 2027 | 0.00803901168 | 0.006231792 | 0.00492311568 | 20 |
| 2028 | 0.009989562576 | 0.00713540184 | 0.0039958250304 | 38 |
| 2029 | 0.01190185026912 | 0.008562482208 | 0.00590811272352 | 65 |
| 2030 | 0.010948417875259 | 0.01023216623856 | 0.009618236264246 | 97 |
KAVA:
| 年份 | 预测最高价 | 预测平均价格 | 预测最低价 | 涨跌幅 |
|---|---|---|---|---|
| 2025 | 0.19376 | 0.173 | 0.12456 | -6 |
| 2026 | 0.2072194 | 0.18338 | 0.1503716 | 0 |
| 2027 | 0.277325574 | 0.1952997 | 0.099602847 | 5 |
| 2028 | 0.29539079625 | 0.236312637 | 0.13233507672 | 27 |
| 2029 | 0.27382726812375 | 0.265851716625 | 0.1754621329725 | 43 |
| 2030 | 0.310315416230531 | 0.269839492374375 | 0.202379619280781 | 45 |
IV. Investment Strategy Comparison: REN vs KAVA
Long-term vs Short-term Investment Strategy
- REN: Suitable for investors focused on cross-chain solutions and DeFi potential
- KAVA: Suitable for investors interested in cross-chain DeFi and AI integration
Risk Management and Asset Allocation
- Conservative investors: REN: 30% vs KAVA: 70%
- Aggressive investors: REN: 60% vs KAVA: 40%
- Hedging tools: Stablecoin allocation, options, cross-currency portfolio
V. Potential Risk Comparison
Market Risk
- REN: Higher volatility due to smaller market cap
- KAVA: Potential competition from other DeFi platforms
Technical Risk
- REN: Scalability, network stability
- KAVA: Integration challenges with multiple blockchains, security vulnerabilities
Regulatory Risk
- Global regulatory policies may have different impacts on both tokens
VI. Conclusion: Which Is the Better Buy?
📌 Investment Value Summary:
- REN advantages: Cross-chain interoperability, potential for growth in DeFi sector
- KAVA advantages: Zero-inflation model, cross-chain DeFi platform, AI integration potential
✅ Investment Advice:
- New investors: Consider a balanced approach with a slight preference for KAVA due to its more established ecosystem
- Experienced investors: Evaluate both tokens based on personal risk tolerance and portfolio diversification needs
- Institutional investors: Consider KAVA for its potential in cross-chain DeFi and AI integration, while monitoring REN's development in the interoperability space
⚠️ Risk Warning: The cryptocurrency market is highly volatile. This article does not constitute investment advice. None
VII. FAQ
Q1: What are the main differences between REN and KAVA? A: REN focuses on a distributed dark pool trading protocol for cryptocurrencies, while KAVA is a cross-chain DeFi platform offering services like lending and stablecoin issuance for mainstream digital assets. KAVA also has a zero-inflation fixed supply model and is developing DeAI capabilities.
Q2: Which token has performed better historically? A: Based on the provided information, KAVA reached a higher all-time high of $9.12 in August 2021, compared to REN's all-time high of $1.8 in February 2021. However, both have seen significant drops from their peaks, with KAVA currently trading at $0.1757 and REN at $0.005169.
Q3: What are the key factors influencing the investment value of REN and KAVA? A: Key factors include supply mechanisms (KAVA has a zero-inflation model), institutional adoption, technical development (KAVA's integration with Cosmos and Ethereum ecosystems), and ecosystem building. Macroeconomic factors and market cycles also play a role, though specific details were not provided in the context.
Q4: How do the 2030 price predictions compare for REN and KAVA? A: For 2030, REN's base scenario prediction ranges from $0.01023216623856 to $0.010948417875259, with an optimistic scenario of $0.010948417875259. KAVA's base scenario prediction ranges from $0.269839492374375 to $0.310315416230531, with an optimistic scenario of $0.310315416230531.
Q5: What are the potential risks associated with investing in REN and KAVA? A: For REN, risks include higher volatility due to smaller market cap, scalability issues, and network stability. For KAVA, risks include potential competition from other DeFi platforms, integration challenges with multiple blockchains, and security vulnerabilities. Both face regulatory risks depending on global policies.
Q6: How should different types of investors approach REN and KAVA? A: New investors might consider a balanced approach with a slight preference for KAVA due to its more established ecosystem. Experienced investors should evaluate both tokens based on personal risk tolerance and portfolio diversification needs. Institutional investors might consider KAVA for its potential in cross-chain DeFi and AI integration, while monitoring REN's development in the interoperability space.
Share
Content