RED vs SOL: A Clash of Titans in the Crypto Arena
Introduction: RED vs SOL Investment Comparison
In the cryptocurrency market, RedStone vs Solana has always been a topic that investors can't ignore. The two not only have significant differences in market cap ranking, application scenarios, and price performance, but also represent different positions in crypto assets.
RedStone (RED): Since its launch, it has gained market recognition for being the fastest-growing oracle and the only major player offering Actively Validated Services with Restaking.
Solana (SOL): Since its inception in late 2017, it has been hailed as a high-performance blockchain protocol, and is one of the cryptocurrencies with the highest global trading volume and market capitalization.
This article will comprehensively analyze the investment value comparison between RedStone and Solana, focusing on historical price trends, supply mechanisms, institutional adoption, technical ecosystems, and future predictions, and attempt to answer the question that investors care about most:
"Which is the better buy right now?"
I. Price History Comparison and Current Market Status
RED (Coin A) and SOL (Coin B) Historical Price Trends
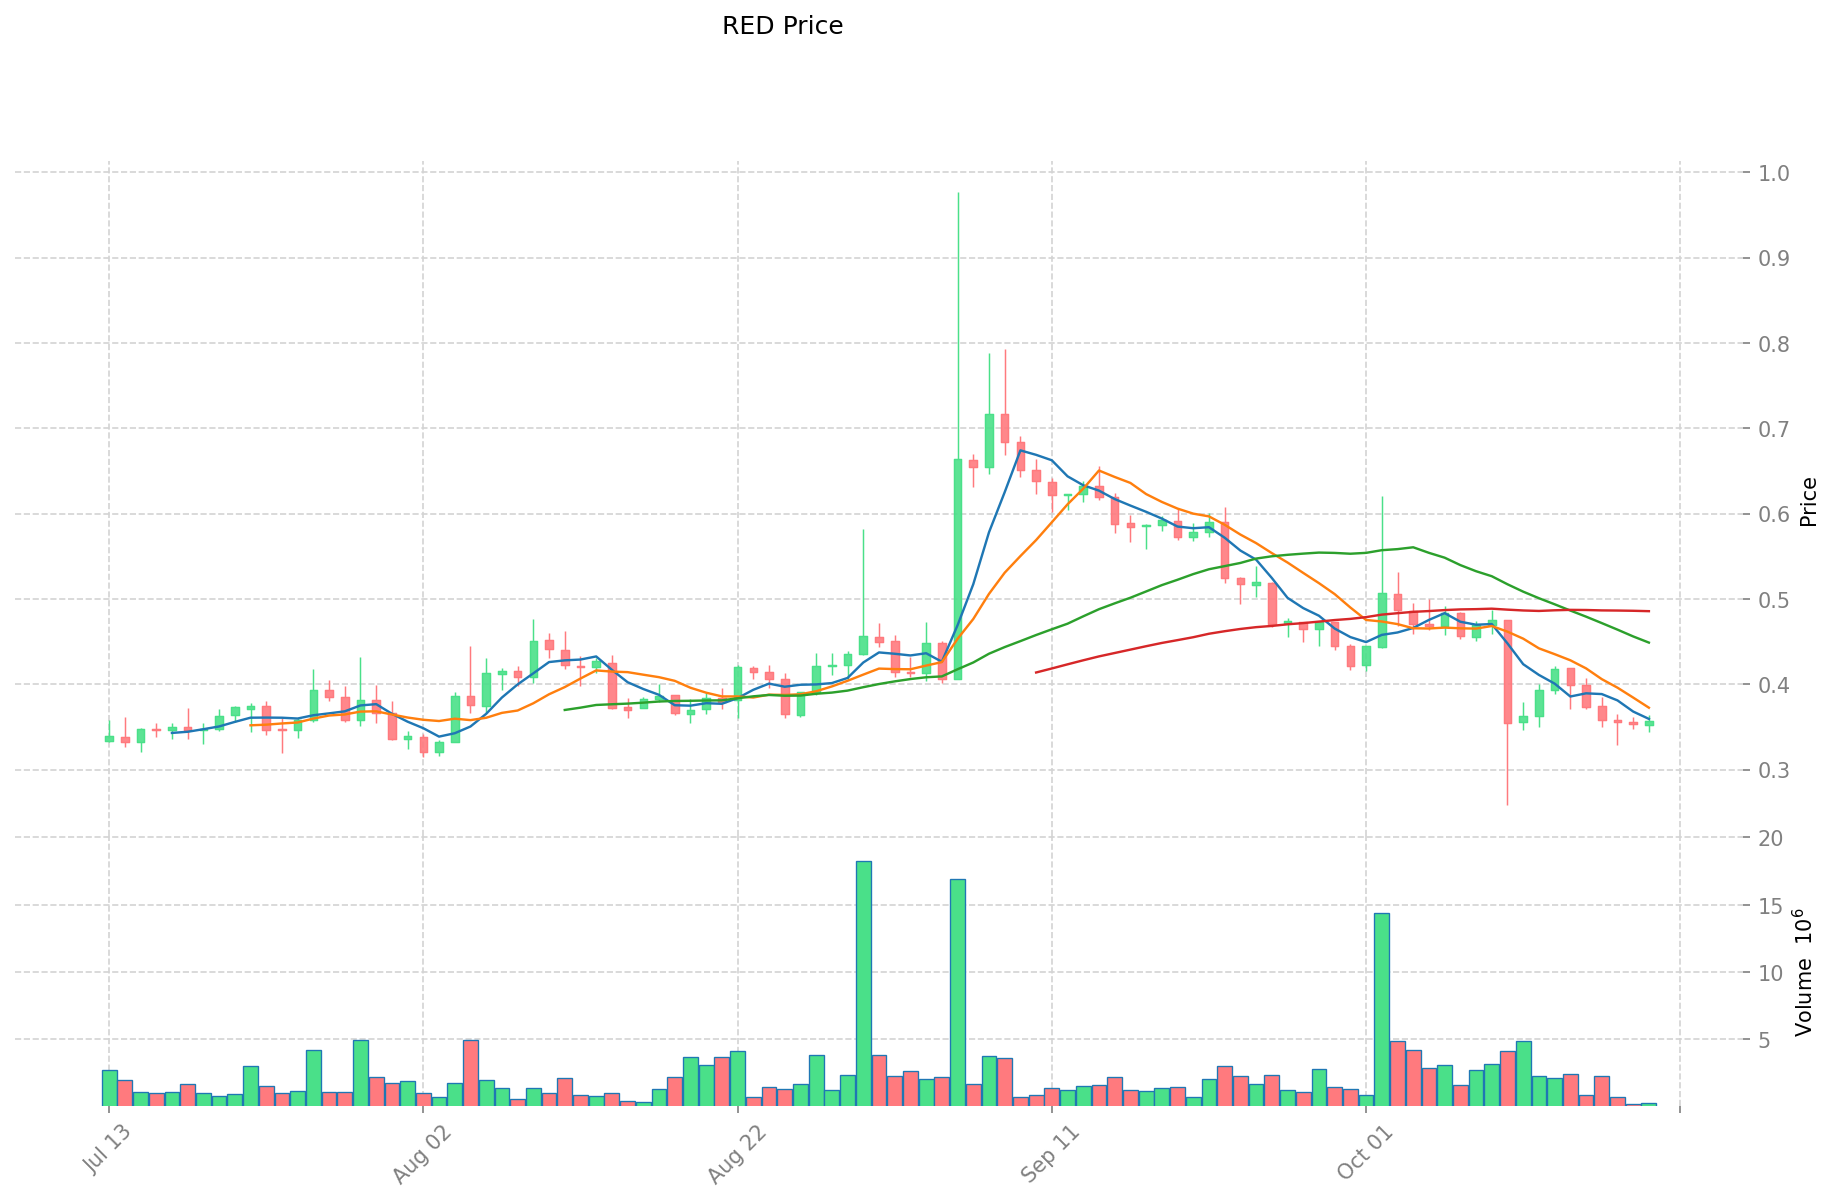
- 2025: RED reached its all-time high of $0.9771 on September 5, 2025.
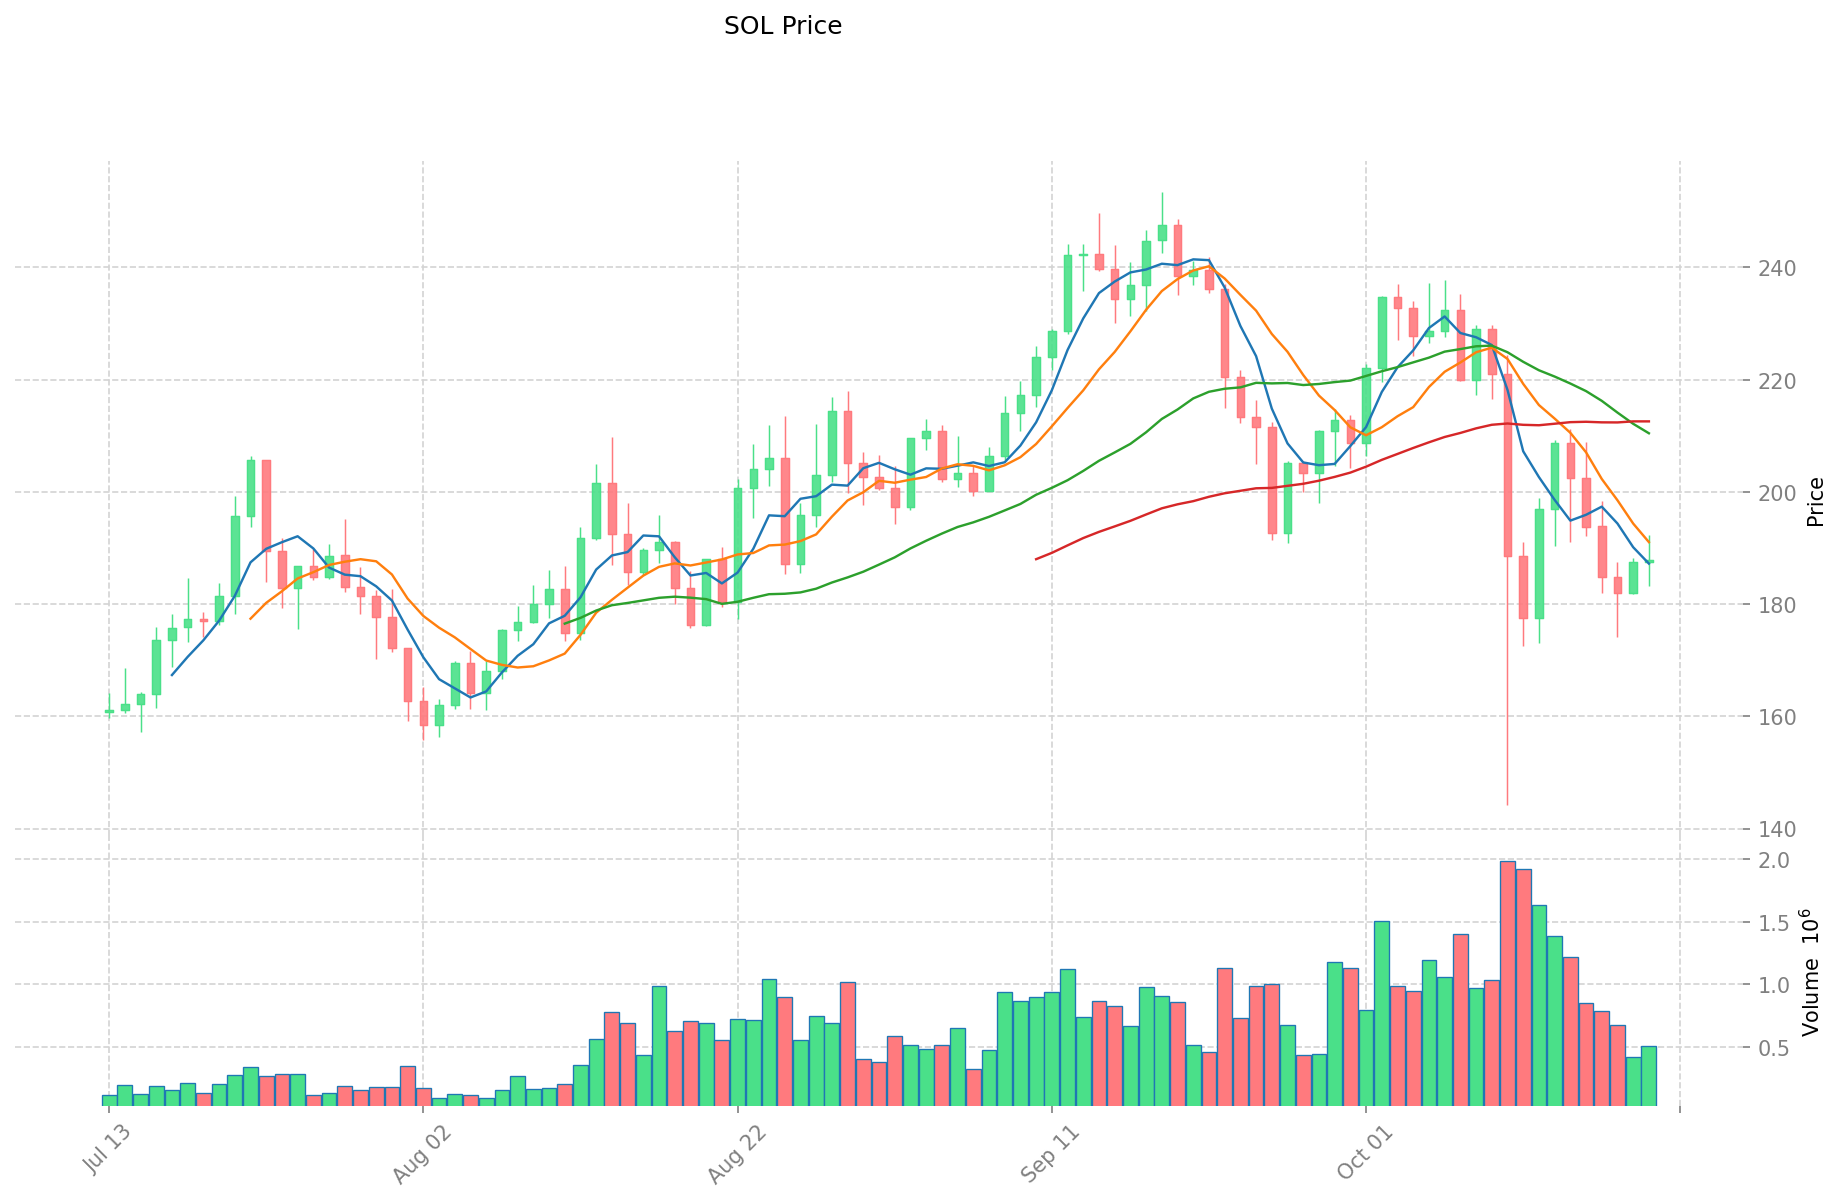
- 2025: SOL achieved its all-time high of $293.31 on January 19, 2025.
- Comparative analysis: In the recent market cycle, RED dropped from its high of $0.9771 to a low of $0.2316, while SOL has shown more resilience, maintaining a higher price level despite market fluctuations.
Current Market Situation (2025-10-20)
- RED current price: $0.3501
- SOL current price: $184.62
- 24-hour trading volume: RED $89,674.60 vs SOL $96,010,343.88
- Market Sentiment Index (Fear & Greed Index): 29 (Fear)
Click to view real-time prices:
- Check RED current price Market Price
- Check SOL current price Market Price
II. Key Factors Affecting RED vs SOL Investment Value
Supply Mechanism Comparison (Tokenomics)
- RED: Initial supply of 200 million tokens with reducing inflation rates over time (20% in year 1, then 15%, 10%, 8%, 5%)
- SOL: Non-deflationary model with inflation starting at 8% annually, decreasing by 15% each year until reaching 1.5% permanently
- 📌 Historical pattern: SOL's higher inflation could create more selling pressure compared to RED's decreasing emission schedule
Institutional Adoption and Market Applications
- Institutional holdings: SOL has backing from major funds like Multicoin Capital, Polychain, and Andreessen Horowitz (a16z)
- Enterprise adoption: SOL has broader ecosystem adoption across DeFi, NFTs, and gaming while RED is positioning for institutional financial services and gaming applications
- Regulatory attitudes: Both projects face similar regulatory uncertainty in most jurisdictions
Technical Development and Ecosystem Building
- RED technical upgrades: Focus on decentralized finance infrastructure and gaming, with a reportedly highly scalable layer-1 architecture
- SOL technical development: Proven high-throughput blockchain with 3,000+ TPS capability, though has experienced several network outages
- Ecosystem comparison: SOL has a more mature ecosystem with established DeFi protocols, NFT marketplaces, and gaming platforms; RED's ecosystem is still in development phase
Macroeconomic and Market Cycles
- Performance in inflationary environments: SOL has demonstrated more price volatility during recent inflationary periods
- Macroeconomic monetary policy: Both assets show sensitivity to broader crypto market conditions and Federal Reserve policies
- Geopolitical factors: SOL has more global distribution and usage, potentially providing more resilience to regional disruptions
III. 2025-2030 Price Prediction: RED vs SOL
Short-term Prediction (2025)
- RED: Conservative $0.33-$0.35 | Optimistic $0.35-$0.46
- SOL: Conservative $133.08-$184.83 | Optimistic $184.83-$190.37
Mid-term Prediction (2027)
- RED may enter a growth phase, with estimated prices of $0.28-$0.62
- SOL may enter a consolidation phase, with estimated prices of $156.51-$255.70
- Key drivers: Institutional capital inflow, ETFs, ecosystem development
Long-term Prediction (2030)
- RED: Base scenario $0.67-$0.78 | Optimistic scenario $0.78-$0.83
- SOL: Base scenario $185.65-$277.09 | Optimistic scenario $277.09-$324.19
Disclaimer: This analysis is based on historical data and current market trends. Cryptocurrency markets are highly volatile and subject to rapid changes. These predictions should not be considered as financial advice. Always conduct your own research before making investment decisions.
RED:
| 年份 | 预测最高价 | 预测平均价格 | 预测最低价 | 涨跌幅 |
|---|---|---|---|---|
| 2025 | 0.461076 | 0.3493 | 0.331835 | 0 |
| 2026 | 0.5267444 | 0.405188 | 0.33225416 | 15 |
| 2027 | 0.615075384 | 0.4659662 | 0.27957972 | 33 |
| 2028 | 0.75132390088 | 0.540520792 | 0.27566560392 | 54 |
| 2029 | 0.9236689554092 | 0.64592234644 | 0.355257290542 | 84 |
| 2030 | 0.831883389980076 | 0.7847956509246 | 0.674924259795156 | 124 |
SOL:
| 年份 | 预测最高价 | 预测平均价格 | 预测最低价 | 涨跌幅 |
|---|---|---|---|---|
| 2025 | 190.3749 | 184.83 | 133.0776 | 0 |
| 2026 | 253.2633075 | 187.60245 | 150.08196 | 1 |
| 2027 | 255.70213935 | 220.43287875 | 156.5073439125 | 19 |
| 2028 | 252.351559593 | 238.06750905 | 161.885906154 | 28 |
| 2029 | 308.96401324509 | 245.2095343215 | 139.769434563255 | 32 |
| 2030 | 324.19152532645515 | 277.086773783295 | 185.64813843480765 | 50 |
IV. Investment Strategy Comparison: RED vs SOL
Long-term vs Short-term Investment Strategies
- RED: Suitable for investors focused on DeFi infrastructure and gaming potential
- SOL: Suitable for investors seeking established ecosystems and higher liquidity
Risk Management and Asset Allocation
- Conservative investors: RED 20% vs SOL 80%
- Aggressive investors: RED 40% vs SOL 60%
- Hedging tools: Stablecoin allocation, options, cross-currency combinations
V. Potential Risk Comparison
Market Risks
- RED: Higher volatility due to lower market cap and trading volume
- SOL: Susceptible to broader crypto market sentiment and macroeconomic factors
Technical Risks
- RED: Scalability, network stability as the ecosystem grows
- SOL: Network outages, centralization concerns
Regulatory Risks
- Global regulatory policies may impact both, with SOL potentially facing more scrutiny due to its larger market presence
VI. Conclusion: Which Is the Better Buy?
📌 Investment Value Summary:
- RED advantages: Faster growth potential, decreasing token emission schedule
- SOL advantages: Established ecosystem, higher institutional adoption
✅ Investment Advice:
- Novice investors: Consider a higher allocation to SOL for its established market position
- Experienced investors: Balanced portfolio with both RED and SOL, adjusting based on risk tolerance
- Institutional investors: SOL for liquidity and ecosystem maturity, RED for potential high growth
⚠️ Risk Warning: The cryptocurrency market is highly volatile. This article does not constitute investment advice. None
VII. FAQ
Q1: What are the main differences between RED and SOL? A: RED is a newer, fast-growing oracle project focusing on DeFi infrastructure and gaming, with a decreasing token emission schedule. SOL is an established high-performance blockchain with a broader ecosystem across DeFi, NFTs, and gaming, but has a higher inflation rate.
Q2: Which coin has shown better price performance recently? A: SOL has shown more resilience in the recent market cycle, maintaining a higher price level despite market fluctuations. RED experienced a larger percentage drop from its all-time high.
Q3: How do the supply mechanisms of RED and SOL differ? A: RED has an initial supply of 200 million tokens with reducing inflation rates over time (starting at 20% in year 1, decreasing to 5%). SOL has a non-deflationary model with inflation starting at 8% annually, decreasing by 15% each year until reaching 1.5% permanently.
Q4: What are the key factors affecting the investment value of RED and SOL? A: Key factors include supply mechanisms, institutional adoption, market applications, technical development, ecosystem building, macroeconomic conditions, and market cycles.
Q5: Which coin might be better for long-term vs short-term investment? A: RED may be more suitable for investors focused on DeFi infrastructure and gaming potential, potentially offering higher growth in the long term. SOL might be better for short to medium-term investments due to its established ecosystem and higher liquidity.
Q6: What are the main risks associated with investing in RED and SOL? A: RED faces higher volatility due to lower market cap and trading volume, as well as potential scalability issues. SOL is susceptible to broader crypto market sentiment and has experienced network outages. Both face regulatory risks.
Q7: How should investors allocate their portfolio between RED and SOL? A: Conservative investors might consider 20% RED and 80% SOL, while aggressive investors could opt for 40% RED and 60% SOL. The exact allocation should be based on individual risk tolerance and investment goals.
Share
Content
Introduction: RED vs SOL Investment Comparison
I. Price History Comparison and Current Market Status
II. Key Factors Affecting RED vs SOL Investment Value
III. 2025-2030 Price Prediction: RED vs SOL
IV. Investment Strategy Comparison: RED vs SOL
V. Potential Risk Comparison
VI. Conclusion: Which Is the Better Buy?
VII. FAQ

