RAI ve XLM: Sınır ötesi ödemelerde stablecoin çözümlerinin karşılaştırılması

Giriş: RAI ve XLM Yatırımı Karşılaştırması
Kripto para piyasasında, RAI ile XLM karşılaştırması yatırımcıların göz ardı edemeyeceği bir başlıktır. İki varlık, piyasa değeri sıralaması, kullanım alanları ve fiyat hareketleriyle ayrışmakla kalmaz; aynı zamanda farklı kripto varlık konumlanmalarını da temsil ederler.
RAI (RAI): 2021’de piyasaya çıktığından beri, itibari para birimine sabitlenmeyen ve ETH teminatlı stabil varlık olarak piyasa onayı kazanmıştır.
XLM (XLM): 2014’te doğan XLM, dijital ve itibari paraların transferinde merkeziyetsiz bir köprü olarak tanınmakta ve küresel işlem hacmi ile piyasa değerinde en üst sıralarda yer almaktadır.
Bu makale, RAI ve XLM’in yatırım değerini; geçmiş fiyat dinamikleri, arz mekanizmaları, kurumsal benimseme, teknik ekosistemler ve gelecek öngörüleri üzerinden kapsamlı analiz edecek ve yatırımcıların en çok yanıt aradığı şu soruya odaklanacaktır:
"Şu anda en iyi alım hangisi?"
I. Fiyat Geçmişi ve Güncel Piyasa Durumu Karşılaştırması
RAI ve XLM’nin Fiyat Geçmişi
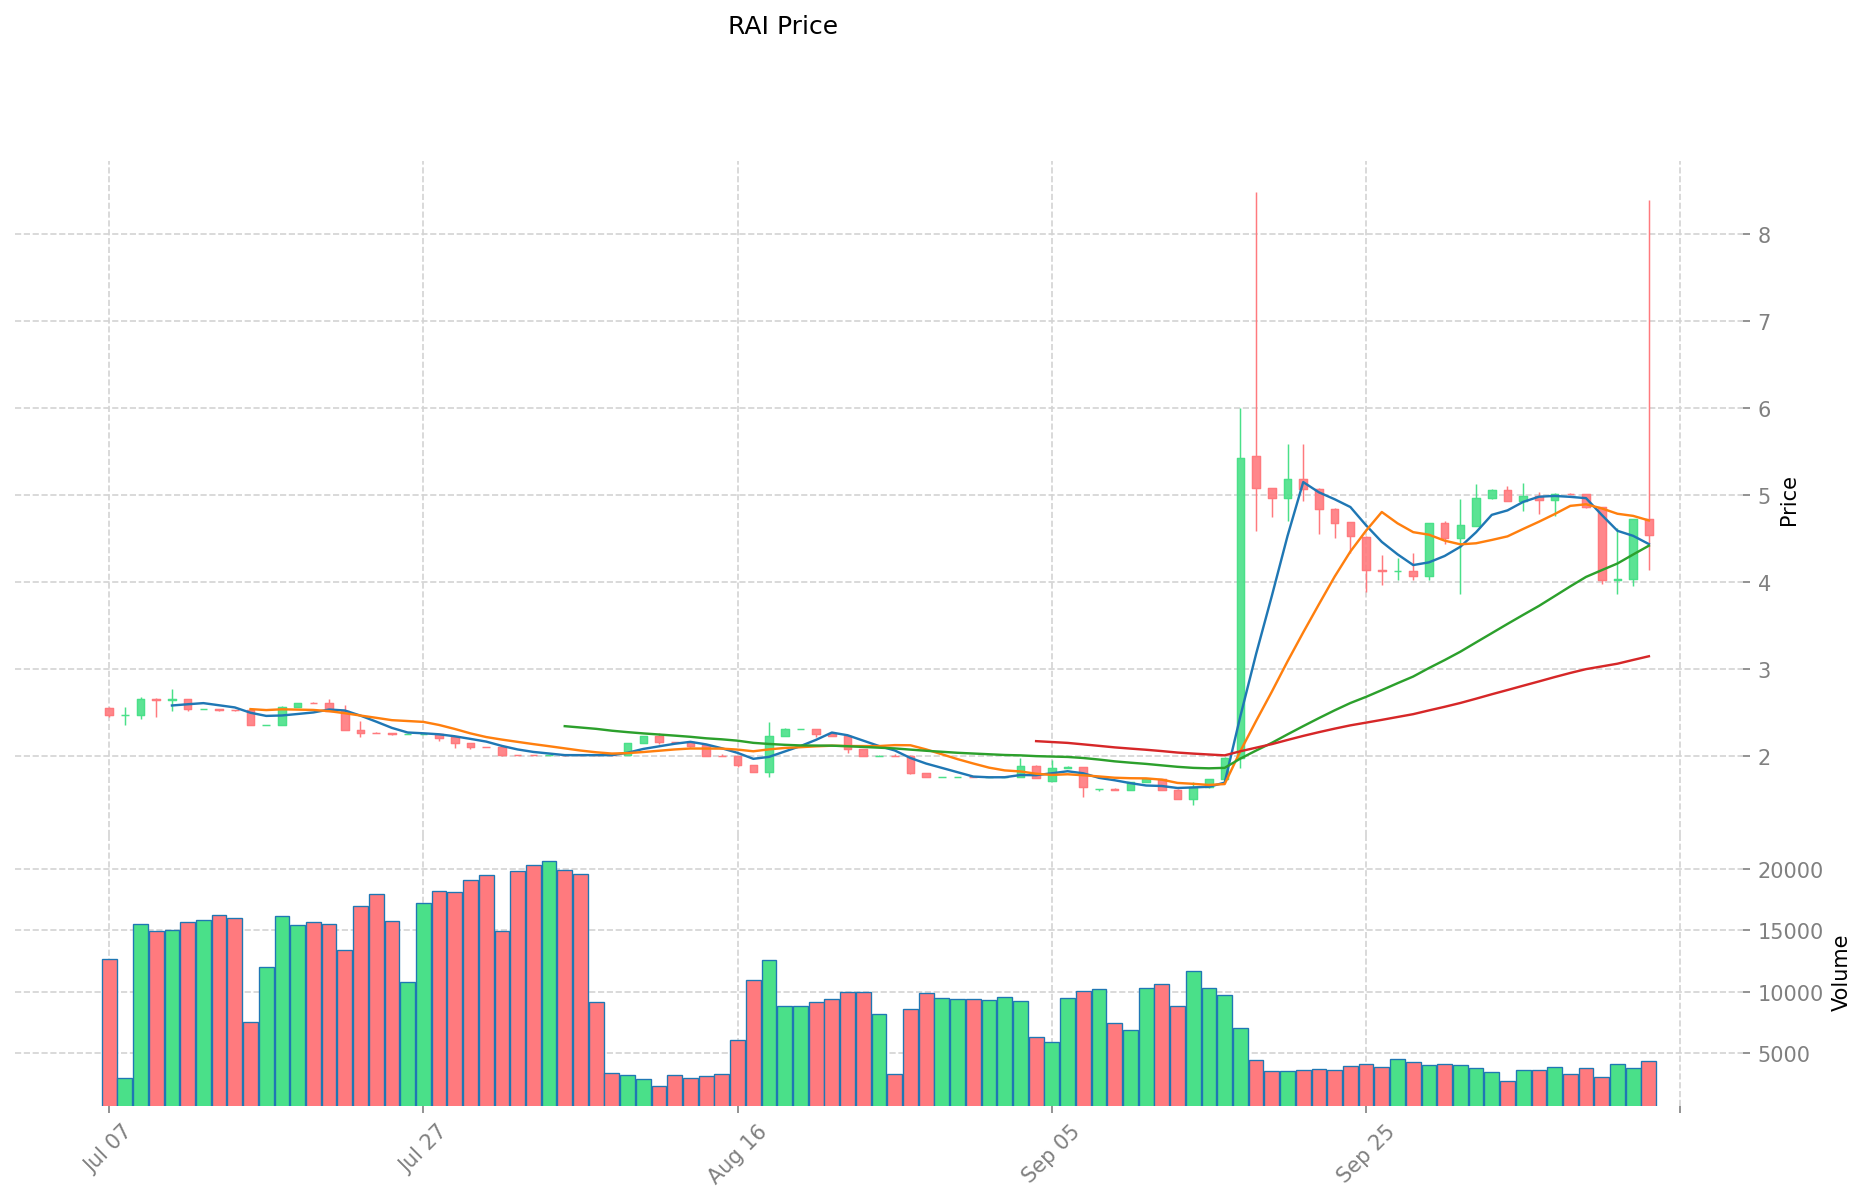
- 2023: RAI, 8 Ekim 2023’te 2,44 dolarla en düşük değerini gördü.
- 2025: RAI, 25 Ağustos 2025’te 5,8 dolarla en yüksek seviyesine ulaştı.
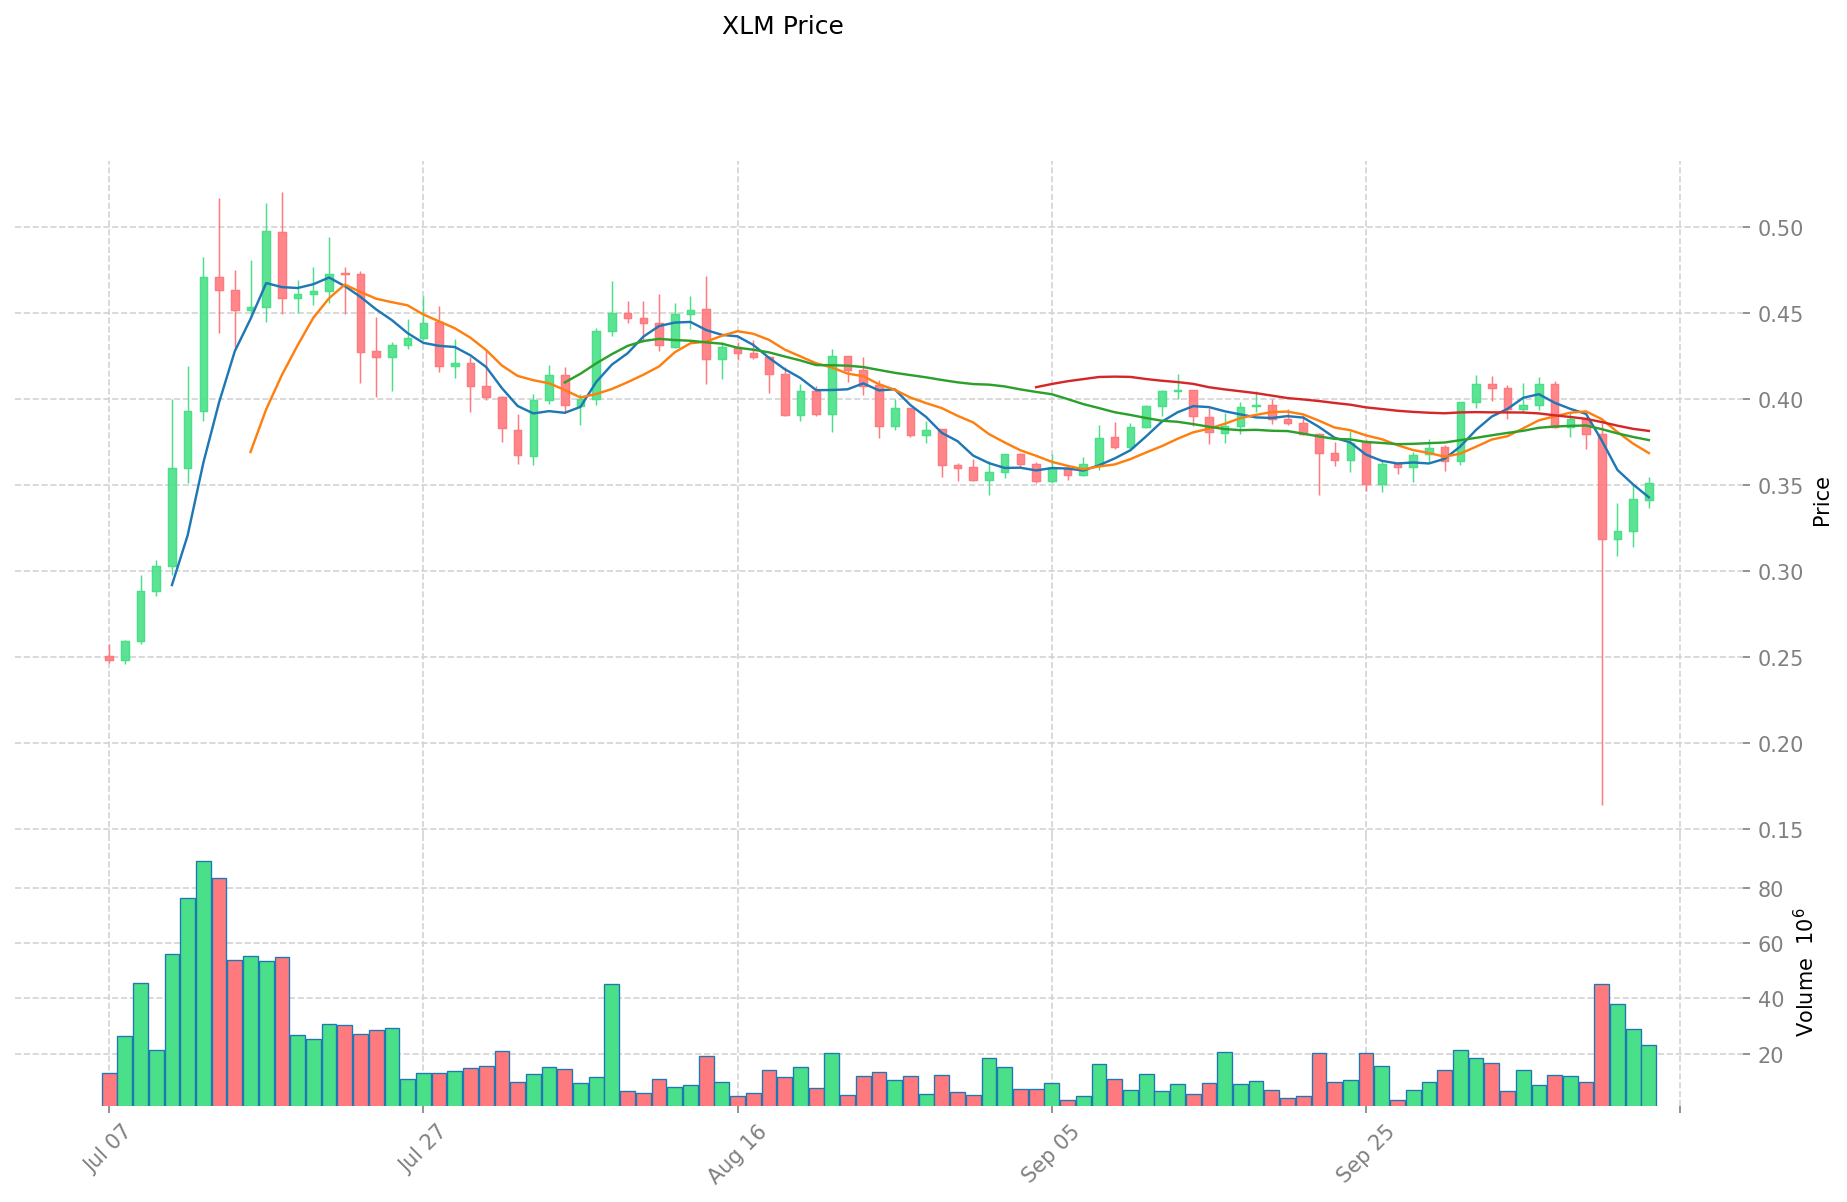
- 2018: XLM, 3 Ocak 2018’de 0,875563 dolarla zirve yaptı.
- 2015: XLM, 5 Mart 2015’te 0,00047612 dolarla taban seviyesine indi.
- Karşılaştırmalı Analiz: Son bir yıl içinde RAI %50,38, XLM ise %288,4 oranında yükseldi.
Güncel Piyasa Durumu (14 Ekim 2025)
- RAI güncel fiyat: 4,537 dolar
- XLM güncel fiyat: 0,35115 dolar
- 24 saatlik işlem hacmi: RAI 20.764,10203 dolar, XLM 7.892.892,3770812 dolar
- Piyasa Duyarlılık Endeksi (Korku & Açgözlülük): 38 (Korku)
Anlık fiyatlar için tıklayın:
- RAI güncel fiyatına bakın Piyasa Fiyatı
- XLM güncel fiyatına bakın Piyasa Fiyatı
II. RAI ve XLM Yatırım Değerini Etkileyen Temel Faktörler
Arz Mekanizması Karşılaştırması (Tokenomik)
- RAI: Algoritmik olarak yönetilen, itibari paraya sabitlenmeyen ve ETH teminatlı bir stablecoin’dir; otonom geri bildirim mekanizmasıyla göreli istikrar sağlar
- XLM: Toplamda 50 milyar ile sabit arzlı, yeni ihraç edilmeyen bir modeldir; yaklaşık 26 milyar XLM dolaşımdadır
- 📌 Tarihi Model: RAI’nin algoritmik istikrarı volatiliteyi azaltmayı hedeflerken, XLM’nin sabit arz modeli yaygınlaşma ile kıtlık değeri oluşturabilir.
Kurumsal Benimseme ve Piyasa Kullanımı
- Kurumsal Portföyler: XLM, Stellar Development Foundation’ın finansal kurumlar ve ödeme sağlayıcıları ile ortaklıkları sayesinde daha geniş kurumsal kabul görmektedir
- Kurumsal Kullanım: XLM, Stellar ağı üzerinde sınır ötesi ödemelerde öne çıkarken, RAI esasen DeFi ekosisteminde yer alır
- Regülasyon Yaklaşımı: XLM, Stellar’ın uyum odaklı yaklaşımı ve regüle kurumlarla iş birliklerinden faydalanırken, RAI daha deneysel DeFi regülasyon ortamında faaliyet gösterir
Teknik Gelişim ve Ekosistem Oluşturma
- RAI Teknik Güncellemeleri: İstikrar mekanizmasının sürekli geliştirilmesi ve Ethereum DeFi protokolleriyle entegrasyon
- XLM Teknik Gelişimi: Stellar Consensus Protocol ile ölçeklenebilirlik, düşük işlem maliyeti ve yüksek birlikte çalışabilirlik hedefleniyor
- Ekosistem Karşılaştırması: XLM daha yaygın şekilde ödeme sistemleri ve sınır ötesi transferlerde kullanılırken, RAI Ethereum tabanlı DeFi borç-alacak platformlarıyla daha sıkı entegredir
Makroekonomik ve Piyasa Döngüleri
- Enflasyon Ortamındaki Performans: RAI, itibari para enflasyonundan bağımsız alım gücü sunmak için tasarlanmıştır; bu özelliğiyle XLM’den daha güçlü bir enflasyon koruması sağlayabilir
- Makro Para Politikası: Faiz değişimleri, sınır ötesi ödeme hacimleri üzerinden XLM’yi daha fazla etkilerken, RAI’nin algoritmik tasarımı bu tür dış etkilere daha dirençlidir
- Jeopolitik Etkenler: XLM, alternatif sınır ötesi ödeme altyapılarına yönelik küresel talep artışından yararlanırken, RAI finansal belirsizlikte itibari paraya sabitlenmeyen istikrar avantajıyla öne çıkabilir
III. 2025-2030 Fiyat Tahmini: RAI ve XLM
Kısa Vadeli Tahmin (2025)
- RAI: Muhafazakâr 3,76 - 4,54 dolar | İyimser 4,54 - 5,22 dolar
- XLM: Muhafazakâr 0,32 - 0,35 dolar | İyimser 0,35 - 0,41 dolar
Orta Vadeli Tahmin (2027)
- RAI büyüme evresine girebilir, tahmini fiyat aralığı 2,88 - 6,62 dolar
- XLM büyüme evresine girebilir, tahmini fiyat aralığı 0,37 - 0,60 dolar
- Başlıca etkenler: Kurumsal sermaye girişi, ETF’ler, ekosistem gelişimi
Uzun Vadeli Tahmin (2030)
- RAI: Temel senaryo 4,45 - 7,54 dolar | İyimser senaryo 7,54 - 9,80 dolar
- XLM: Temel senaryo 0,36 - 0,58 dolar | İyimser senaryo 0,58 - 0,81 dolar
Feragatname
RAI:
| Yıl | Tahmini En Yüksek Fiyat | Tahmini Ortalama Fiyat | Tahmini En Düşük Fiyat | Değişim Oranı |
|---|---|---|---|---|
| 2025 | 5,2164 | 4,536 | 3,76488 | 0 |
| 2026 | 5,071248 | 4,8762 | 4,047246 | 7 |
| 2027 | 6,61505292 | 4,973724 | 2,88475992 | 9 |
| 2028 | 6,7214906136 | 5,79438846 | 3,186913653 | 27 |
| 2029 | 8,823694746888 | 6,2579395368 | 5,256669210912 | 37 |
| 2030 | 9,8030622843972 | 7,540817141844 | 4,44908211368796 | 66 |
XLM:
| Yıl | Tahmini En Yüksek Fiyat | Tahmini Ortalama Fiyat | Tahmini En Düşük Fiyat | Değişim Oranı |
|---|---|---|---|---|
| 2025 | 0,408552 | 0,3522 | 0,31698 | 0 |
| 2026 | 0,42982488 | 0,380376 | 0,28147824 | 8 |
| 2027 | 0,5995486512 | 0,40510044 | 0,3726924048 | 15 |
| 2028 | 0,57767322744 | 0,5023245456 | 0,47720831832 | 42 |
| 2029 | 0,6155987306328 | 0,53999888652 | 0,3671992428336 | 53 |
| 2030 | 0,814696320092724 | 0,5777988085764 | 0,364013249403132 | 64 |
IV. Yatırım Stratejisi Karşılaştırması: RAI ve XLM
Uzun Vadeli ve Kısa Vadeli Yatırım Stratejileri
- RAI: İstikrar ve enflasyon koruması arayan yatırımcılar için uygundur
- XLM: Ödeme odaklı ve ekosistem potansiyeli yüksek yatırımcılar için uygundur
Risk Yönetimi ve Varlık Dağılımı
- Temkinli yatırımcılar: RAI %60, XLM %40
- Agresif yatırımcılar: RAI %40, XLM %60
- Koruma araçları: Stabilcoin tahsisi, opsiyonlar, çapraz para portföyleri
V. Potansiyel Risk Karşılaştırması
Piyasa Riski
- RAI: Algoritmik yapısı ve DeFi piyasasındaki dalgalanmalar nedeniyle volatilite riski
- XLM: Genel kripto para piyasası trendleri ve benimsenme oranlarından etkilenebilir
Teknik Risk
- RAI: Akıllı sözleşme açıkları, algoritmik istikrar mekanizmasında başarısızlık riski
- XLM: Ağ tıkanıklığı ve ölçeklenebilirlik sorunları riski
Regülasyon Riski
- Küresel regülasyonlar iki varlığı farklı etkileyebilir; XLM, sınır ötesi ödeme odaklı yapısı nedeniyle daha fazla incelemeye tabi olabilir
VI. Sonuç: Hangisi Daha İyi Bir Alım?
📌 Yatırım Değeri Özeti:
- RAI avantajları: Sabitlenmeyen istikrar, potansiyel enflasyon koruması, DeFi ekosistemiyle entegrasyon
- XLM avantajları: Yerleşik sınır ötesi ödeme ağı, kurumsal ortaklıklar, sabit arz
✅ Yatırım Tavsiyesi:
- Yeni yatırımcılar: Daha köklü ekosistemi nedeniyle XLM ağırlıklı dengeli bir yaklaşımı değerlendirin
- Deneyimli yatırımcılar: DeFi’ye maruziyet için RAI, ödeme ağı potansiyeli için XLM ile her iki fırsatı değerlendirin
- Kurumsal yatırımcılar: Regülasyon uyumluluğu ve sınır ötesi ödeme uygulamaları için XLM’yi, DeFi portföy çeşitliliği için RAI’yi gözden geçirin
⚠️ Risk Uyarısı: Kripto para piyasası yüksek oynaklığa sahiptir. Bu makale yatırım tavsiyesi niteliği taşımaz. None
VII. SSS
S1: RAI ve XLM arasındaki başlıca farklar nelerdir? C: RAI, itibari paraya sabitlenmeden istikrar sunmak için geliştirilmiş algoritmik bir stablecoin’dir; XLM ise sınır ötesi ödemeler ve transferlere odaklanan bir kripto para birimidir. RAI ağırlıkla DeFi uygulamalarında kullanılırken, XLM ödeme sistemlerinde daha geniş kabul görür.
S2: Son dönemde hangi kripto para daha iyi fiyat performansı gösterdi? C: Son bir yılda XLM %288,4’lük artış gösterirken, RAI %50,38 oranında büyüdü.
S3: RAI ve XLM’nin arz mekanizmaları arasındaki farklar nelerdir? C: RAI, fiyat istikrarını algoritmik mekanizmayla korurken, XLM 50 milyar ile sabit toplam arza ve yeni ihraç olmamasına sahiptir.
S4: Hangi kripto para uzun vadeli yatırım için daha uygundur? C: RAI, istikrar ve enflasyon koruması arayanlar için; XLM ise ödeme odaklı senaryolar ve ekosistem potansiyeli arayanlar için daha uygundur.
S5: RAI ve XLM yatırımlarında temel riskler nelerdir? C: RAI, akıllı sözleşme açıkları ve DeFi piyasa dalgalanmalarına karşı risk taşırken; XLM, genel kripto para piyasası trendleri ve sınır ötesi ödemeye odaklı yapısı nedeniyle regülasyon riskine açıktır.
S6: Kurumsal benimseme açısından RAI ve XLM nasıl karşılaştırılır? C: XLM, Stellar Development Foundation’ın finansal kurumlar ve ödeme sağlayıcılarıyla yaptığı iş birlikleriyle daha fazla kurumsal ilgi görürken, RAI esas olarak DeFi uygulamalarında kalmıştır.
S7: 2030 yılı için RAI ve XLM’nin uzun vadeli fiyat tahminleri nedir? C: 2030’da RAI’nin temel senaryosu 4,45-7,54 dolar, iyimser senaryosu 7,54-9,80 dolar; XLM’nin temel senaryosu 0,36-0,58 dolar, iyimser senaryosu ise 0,58-0,81 dolar olarak öngörülmektedir.
Share
Content
Giriş: RAI ve XLM Yatırımı Karşılaştırması
I. Fiyat Geçmişi ve Güncel Piyasa Durumu Karşılaştırması
II. RAI ve XLM Yatırım Değerini Etkileyen Temel Faktörler
III. 2025-2030 Fiyat Tahmini: RAI ve XLM
IV. Yatırım Stratejisi Karşılaştırması: RAI ve XLM
V. Potansiyel Risk Karşılaştırması
VI. Sonuç: Hangisi Daha İyi Bir Alım?
VII. SSS
How to Buy Cryptocurrency


Trending Cryptocurrencies


World Liberty Financial USD (USD1) iyi bir yatırım mı?: Bu tartışmalı stablecoin'in riskleri ve potansiyel getirileri nasıl değerlendirilir

2025 CEUR Fiyat Tahmini: Avrupa Merkez Bankası Dijital Para Birimi için Uzman Analizi ve Piyasa Tahmini

Dai Fiyat Analizi 2025: Stabilcoin Pazarının Eğilimleri ve Görünümü

USDe Fiyat Tahmini: 2025 Ethena Stabilcoin Pazar Analizi ve Yatırım Stratejisi

HBAR Nedir (ve Neden Vardır)

Gate'de USD1 stablecoin: WLFI Token için Analiz ve Yatırım Fırsatları
Star Atlas’ı Keşfetmek: Oyun Token’larıyla Metaverse’e Adım Atın
Kripto para rakipleri 2025 yılında piyasa değeri, performans ve kullanıcı benimsemesi bakımından nasıl karşılaştırılıyor?

Kripto güvenliğiyle ilgili olaylarda öne çıkan akıllı sözleşme zafiyetleri ile borsa saklama riskleri nelerdir?