PUSH ve SOL: Blockchain Ölçeklenebilirlik Çözümlerinin Rekabeti


Giriş: PUSH ve SOL Yatırımı Karşılaştırması
Kripto para piyasasında PUSH ile SOL’un karşılaştırılması, yatırımcıların gündeminden düşmeyen bir konu olmuştur. Her iki varlık; piyasa değeri sıralaması, kullanım alanları ve fiyat performansında belirgin farklılıklar taşırken, kripto varlık ekosisteminde de farklı konumlandırmaları simgeler.
PUSH (PUSH): 2021 yılında piyasaya sürülen merkeziyetsiz bildirim protokolü sayesinde piyasada kendine yer edinmiştir.
SOL (SOL): 2017’den bu yana yüksek performanslı bir blockchain protokolü olarak tanınmış, küresel işlem hacmi ve piyasa değeriyle en büyük kripto paralardan biri haline gelmiştir.
Bu makalede, PUSH ve SOL’un yatırım değerleri; geçmiş fiyat eğilimleri, arz mekanizmaları, kurumsal benimseme, teknolojik ekosistemler ve geleceğe yönelik tahminler üzerinden kapsamlı biçimde karşılaştırılacak, yatırımcıların en çok merak ettiği şu soruya yanıt aranacaktır:
"Şu anda hangisi daha iyi bir yatırım?" Aşağıda, sağlanan şablon ve bilgilerle hazırlanmış raporu bulabilirsiniz:
I. Fiyat Geçmişi Karşılaştırması ve Güncel Piyasa Durumu
PUSH ve SOL’un Tarihsel Fiyat Eğilimleri
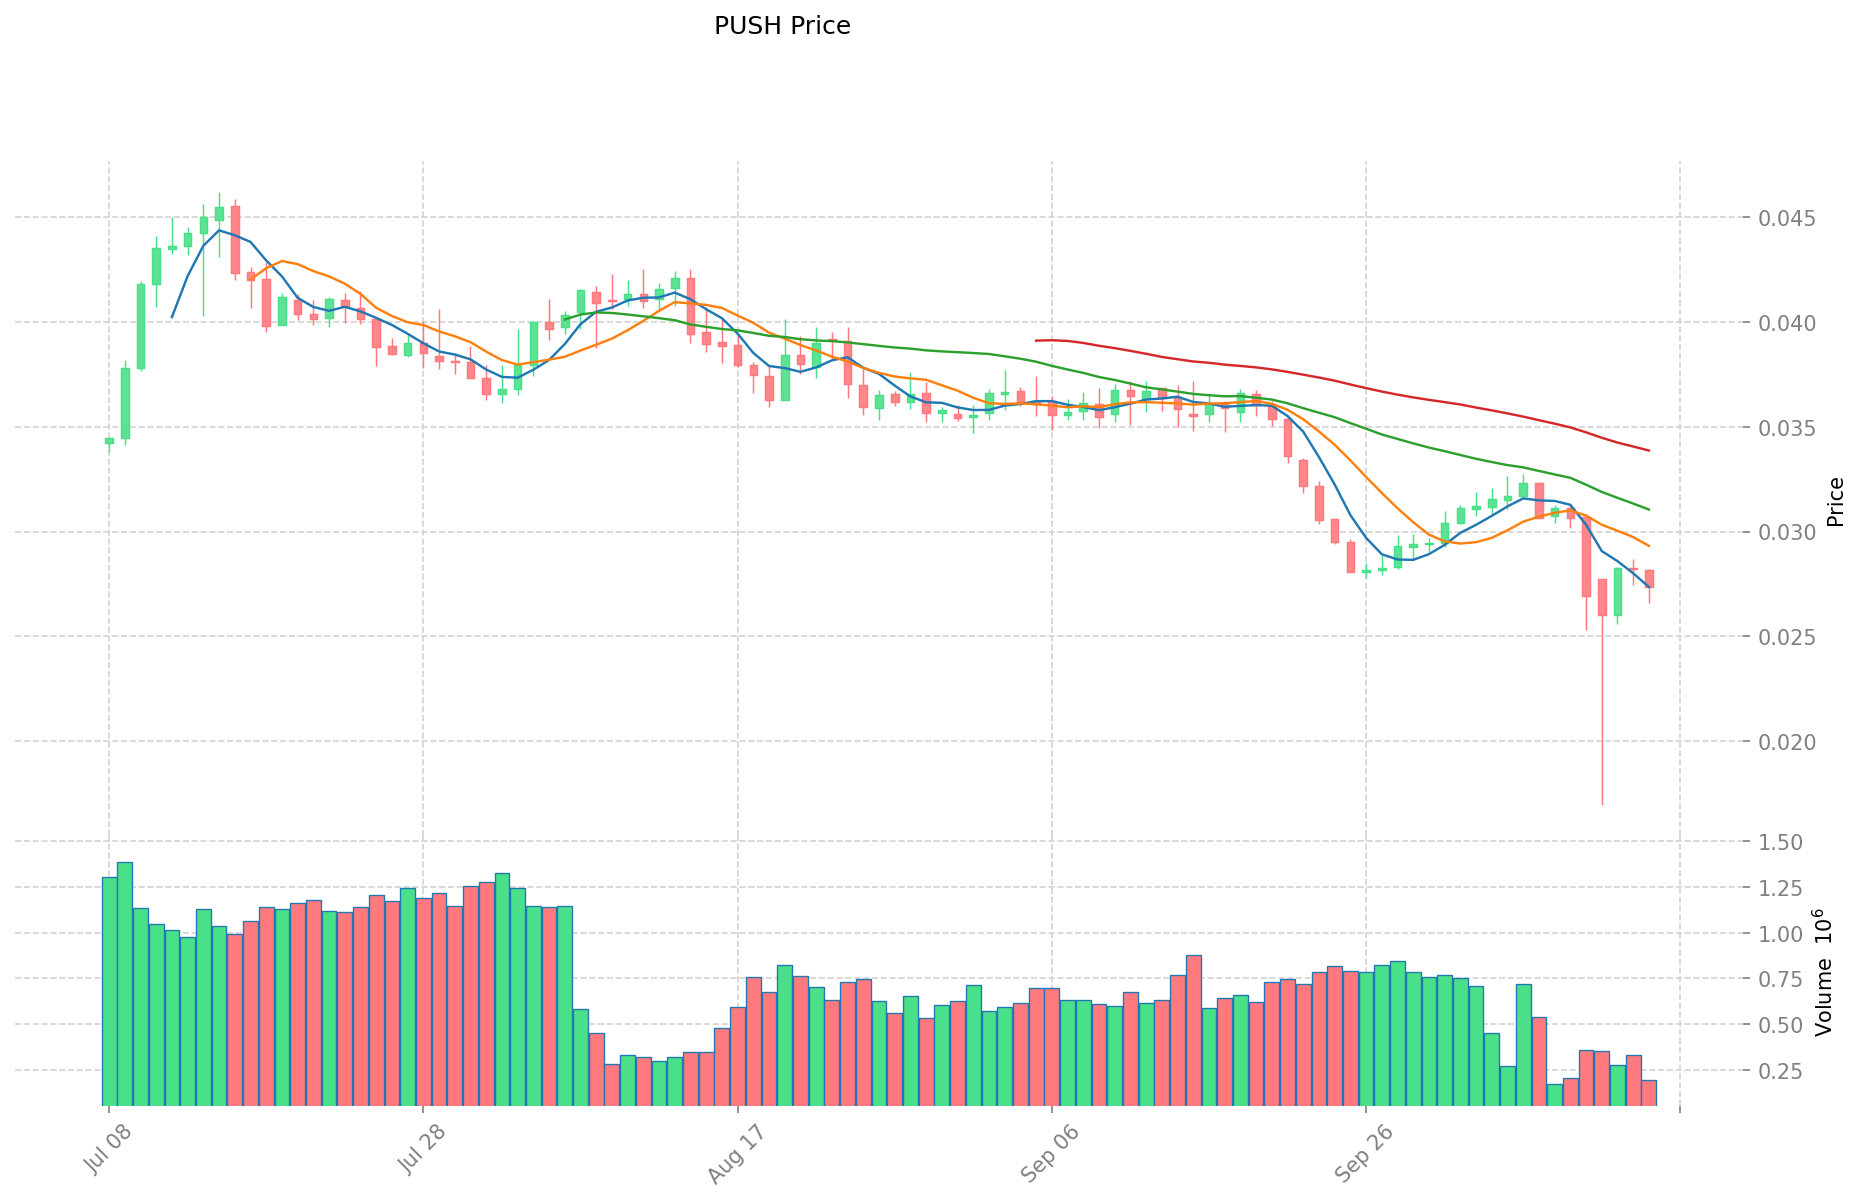
- 2021: PUSH, merkeziyetsiz bildirim protokollerine olan ilginin artmasıyla 8,73 $ ile zirve yaptı.
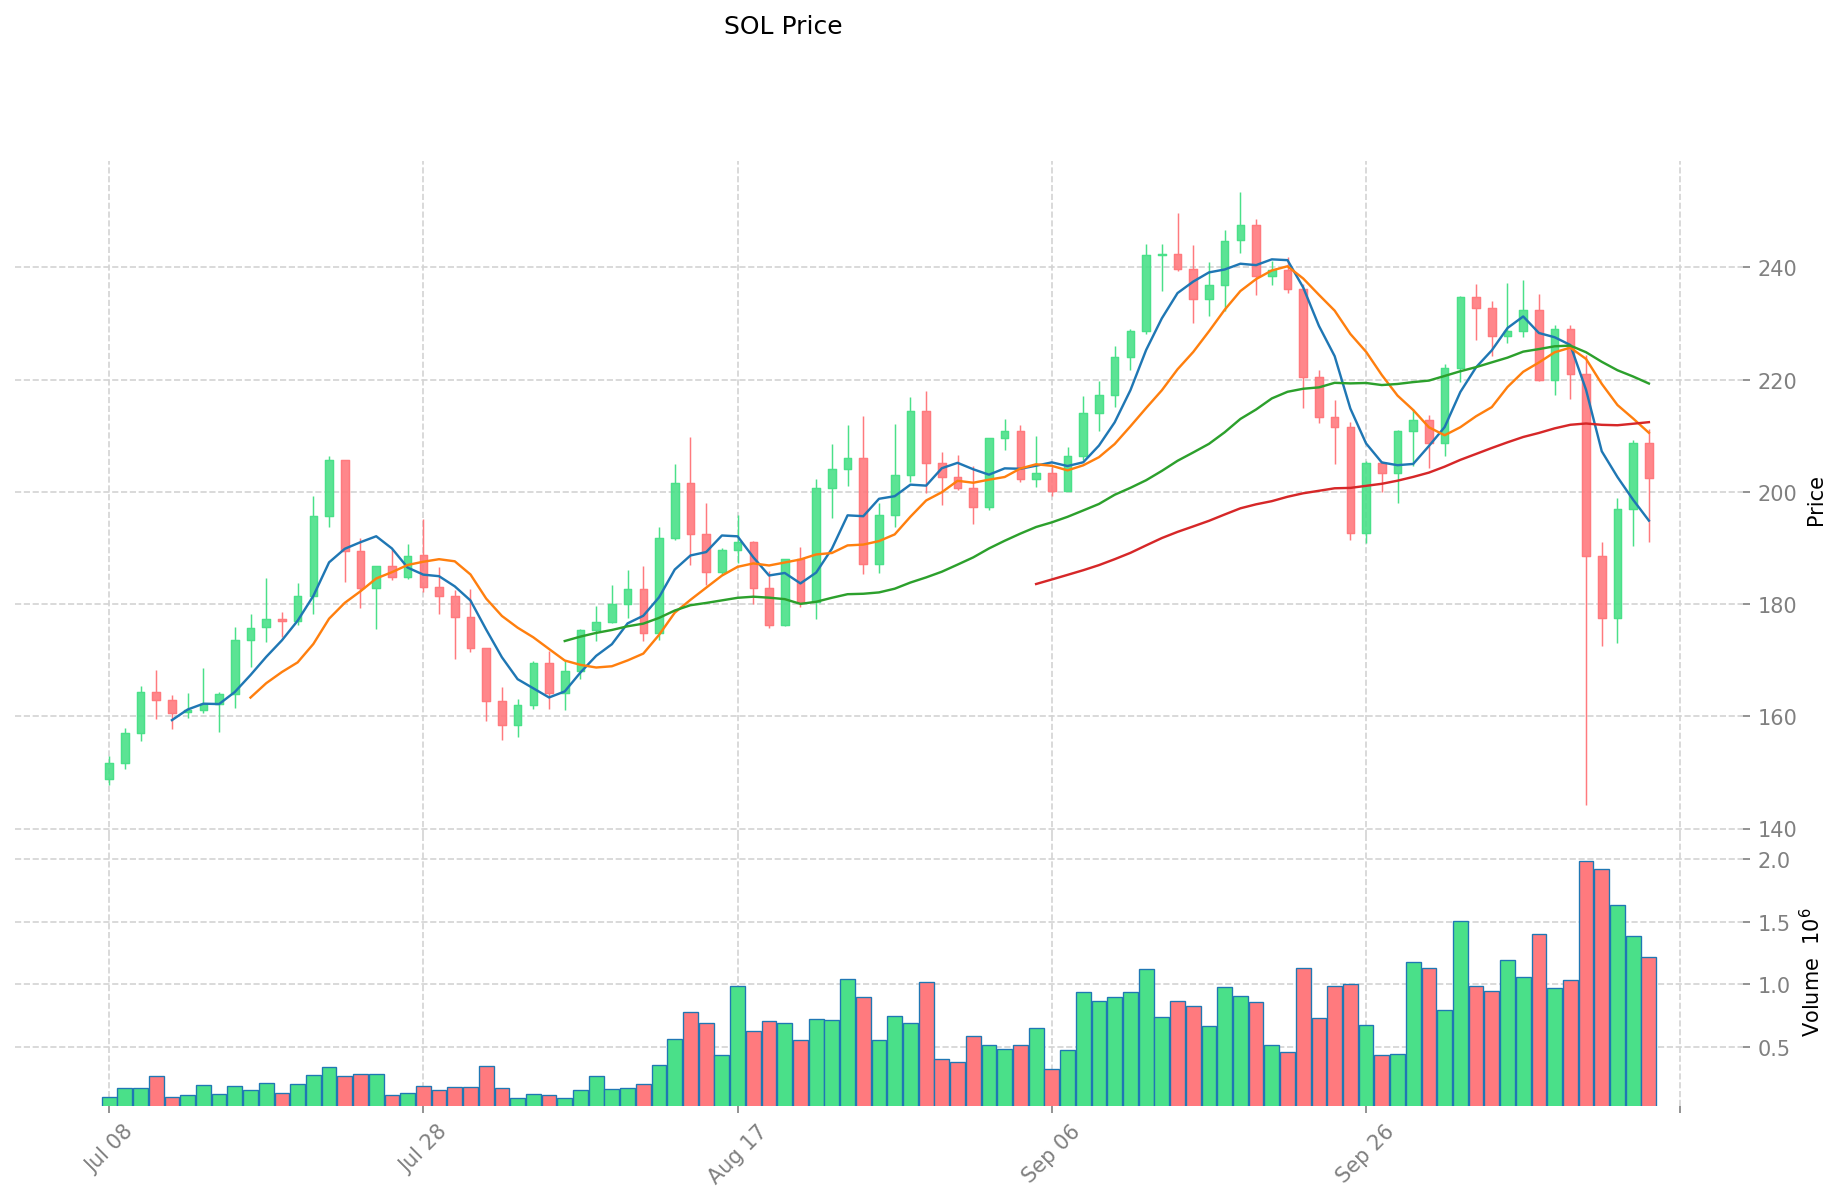
- 2025: SOL, Solana ekosisteminin yaygın benimsenmesiyle 293,31 $’a ulaştı.
- Kıyaslama: Son piyasa döngüsünde PUSH, 8,73 $’dan 0,02586 $’a kadar gerilerken; SOL, 293,31 $’dan 200 $’ın üzerindeki mevcut seviyesine düşerek daha dirençli bir görünüm sergiledi.
Güncel Piyasa Durumu (15 Ekim 2025)
- PUSH güncel fiyatı: 0,02737 $
- SOL güncel fiyatı: 202,94 $
- 24 saatlik işlem hacmi: PUSH 5.260,59 $ / SOL 244.058.694,38 $
- Piyasa Duyarlılık Endeksi (Korku & Açgözlülük): 38 (Korku)
Gerçek zamanlı fiyatları görüntülemek için tıklayın:
- PUSH güncel fiyatı için Piyasa Fiyatı
- SOL güncel fiyatı için Piyasa Fiyatı
II. PUSH ve SOL Yatırım Değerini Etkileyen Temel Unsurlar
Teknik Gelişim ve Ekosistem Oluşturma
- SOL teknik gelişimi: Zincirler arası işlevsellik, farklı ekosistem likitidesini birbirine bağlayan “köprü” görevi görür ve yeni her entegrasyonla yatırım değerini artırır.
- SOL ekosistem performansı: Ağ, 16 ay boyunca %100 çalışırlık göstererek yatırımcı güvenini ve platformun güvenilirliğini artırdı.
- Ekosistem karşılaştırması: Solana DeFi ekosisteminde likit staking oranı %6,4 ile Ethereum’daki %32,4’ün oldukça altında; bunun nedeni minimum staking gerekliliğinin bulunmaması ve daha düşük slashing kurallarıdır.
Kurumsal Benimseme ve Piyasa Kullanım Alanları
- Piyasa konumu: SOL, 4. sırada yer alan kripto token olarak önemli bir piyasa kabulü sağlamıştır.
- Piyasa eğilimleri: Son fiyat dalgalanmaları, TVL değişimleri ve trader’ların kâr realizasyonlarıyla ilişkilidir.
- Likidite: SOL’un zincirler arası altyapıdaki rolü, kullanım alanını ve potansiyel talebini artırmaktadır.
Makroekonomik ve Piyasa Döngüleri
- Piyasa duyarlılığı: SOL, özellikle piyasa hissiyatı değiştiğinde daha görünür hale gelen temel zorluklarla karşı karşıya.
- Enflasyon baskısı: Fiyat artışları, enflasyonist baskıyı ve token açılma (unlock) olaylarını tetikleyebilir.
- Piyasa oynaklığı: Son dönemde, %8’lik geri çekilme de dahil olmak üzere önemli fiyat dalgalanmaları gözlendi.
Değer Önerisinde Farklılaşma
- SOL: Solana ekosisteminin ana varlığı olarak piyasadaki konumu güçlüdür.
- İnovasyon değeri: Her iki token’ın uzun vadeli değerinde teknolojik yenilik, piyasa talebi ve ekosistem gelişimi belirleyici rol oynar.
- Web3 entegrasyonu: Geliştiricilere, içerik üreticilere ve kullanıcılara değer dağıtımı potansiyeli; yeni teşvik ve değer paylaşım yöntemlerini beraberinde getirir.
III. 2025-2030 Fiyat Tahminleri: PUSH ve SOL
Kısa Vadeli Tahmin (2025)
- PUSH: Temkinli 0,015316 - 0,02735 $ | İyimser 0,02735 - 0,0380165 $
- SOL: Temkinli 173,5738 - 201,83 $ | İyimser 201,83 - 230,0862 $
Orta Vadeli Tahmin (2027)
- PUSH, büyüme dönemine geçebilir; fiyat beklentisi 0,03548747285 - 0,04266471455 $ aralığında.
- SOL yükseliş piyasasına girebilir; fiyat beklentisi 182,54938193 - 316,57297879 $ aralığında.
- Temel faktörler: Kurumsal sermaye girişi, ETF’ler, ekosistem gelişimi.
Uzun Vadeli Tahmin (2030)
- PUSH: Temel senaryo 0,046807458332805 - 0,054296651666053 $ | İyimser senaryo 0,054296651666053 $+
- SOL: Temel senaryo 337,83044993420625 - 374,991799426968937 $ | İyimser senaryo 374,991799426968937 $+
Uyarı: Bu tahminler, geçmiş veriler ve güncel piyasa eğilimlerine dayanmaktadır. Kripto para piyasaları son derece oynaktır ve hızlı değişime açıktır. Bu bilgiler yatırım tavsiyesi olarak kullanılmamalıdır. Yatırım kararı öncesi kendi araştırmanızı mutlaka yapınız.
PUSH:
| Yıl | Tahmini En Yüksek Fiyat | Tahmini Ortalama Fiyat | Tahmini En Düşük Fiyat | Değişim Oranı |
|---|---|---|---|---|
| 2025 | 0,0380165 | 0,02735 | 0,015316 | 0 |
| 2026 | 0,04706388 | 0,03268325 | 0,03006859 | 19 |
| 2027 | 0,04266471455 | 0,039873565 | 0,03548747285 | 45 |
| 2028 | 0,0470468193435 | 0,041269139775 | 0,03590415160425 | 50 |
| 2029 | 0,04945693710636 | 0,04415797955925 | 0,022520569575217 | 61 |
| 2030 | 0,054296651666053 | 0,046807458332805 | 0,04306286166618 | 71 |
SOL:
| Yıl | Tahmini En Yüksek Fiyat | Tahmini Ortalama Fiyat | Tahmini En Düşük Fiyat | Değişim Oranı |
|---|---|---|---|---|
| 2025 | 230,0862 | 201,83 | 173,5738 | 0 |
| 2026 | 246,192234 | 215,9581 | 146,851508 | 6 |
| 2027 | 316,57297879 | 231,075167 | 182,54938193 | 13 |
| 2028 | 369,66249840825 | 273,824072895 | 208,1062954002 | 34 |
| 2029 | 353,9176142167875 | 321,743285651625 | 238,0900313822025 | 58 |
| 2030 | 374,991799426968937 | 337,83044993420625 | 175,67183396578725 | 66 |
IV. Yatırım Stratejisi Karşılaştırması: PUSH ve SOL
Uzun Vadeli ve Kısa Vadeli Yatırım Stratejileri
- PUSH: Merkeziyetsiz bildirim protokolleri ve ekosistem büyüme potansiyeline odaklanan yatırımcılar için uygundur.
- SOL: Yüksek performanslı ve yaygın kullanılan blockchain platformlarına yatırım yapmak isteyenler için uygundur.
Risk Yönetimi ve Varlık Dağılımı
- Temkinli yatırımcılar: PUSH %10, SOL %90
- Agresif yatırımcılar: PUSH %30, SOL %70
- Koruma araçları: Stablecoin tahsisi, opsiyonlar, çapraz para kombinasyonları
V. Potansiyel Risk Karşılaştırması
Piyasa Riskleri
- PUSH: Sınırlı piyasa değeri ve likidite, dalgalanmayı artırabilir.
- SOL: Genel kripto piyasası eğilimlerine ve duyarlılık değişimlerine karşı hassastır.
Teknik Riskler
- PUSH: Ölçeklenebilirlik ve ağ istikrarı riskleri
- SOL: Yüksek trafik dönemlerinde ağ tıkanıklığı ve olası güvenlik açıkları
Regülasyon Riskleri
- Küresel regülasyonlar, iki tokenı farklı şekilde etkileyebilir; SOL, daha büyük piyasa payı nedeniyle daha fazla denetime tabi olabilir.
VI. Sonuç: Hangisi Daha İyi Bir Yatırım?
📌 Yatırım Değeri Özeti:
- PUSH avantajları: Merkeziyetsiz bildirimde niş alan, Web3 iletişiminde büyüme potansiyeli
- SOL avantajları: Güçlü ekosistem, yüksek performans, zincirler arası işlevsellik, kurumsal benimseme
✅ Yatırım Tavsiyesi:
- Yeni başlayanlar: SOL’a, yerleşik piyasa pozisyonu ve ekosistemi nedeniyle ağırlık verebilir.
- Deneyimli yatırımcılar: Her iki varlığa yatırım yapıp, SOL’a ağırlık verirken PUSH’ın ekosistem gelişimini yakından izleyebilirler.
- Kurumsal yatırımcılar: SOL’un likiditesi ve derinliği nedeniyle SOL’a odaklanmalı, ancak merkeziyetsiz iletişim tarafında olası yenilikler için PUSH’ı da göz ardı etmemelidir.
⚠️ Risk Uyarısı: Kripto piyasası oldukça dalgalıdır. Bu içerik yatırım tavsiyesi değildir. None
VII. Sıkça Sorulan Sorular
S1: PUSH ve SOL arasındaki ana farklar nelerdir? C: PUSH, 2021’de piyasaya sürülen merkeziyetsiz bildirim protokolüdür. SOL ise 2017’de başlatılan yüksek performanslı blockchain protokolüdür. SOL, PUSH’a kıyasla çok daha yüksek piyasa değeri, işlem hacmi ve köklü bir ekosisteme sahiptir.
S2: Son dönemde hangi kripto para daha iyi fiyat istikrarı gösterdi? C: SOL, son piyasa döngüsünde daha dirençliydi. PUSH, 8,73 $’dan 0,02737 $’a inerken; SOL, 293,31 $’dan 200 $ üzerindeki seviyeye gerileyerek fiyat istikrarını korudu.
S3: SOL’un yatırım değerini etkileyen başlıca unsurlar hangileridir? C: SOL’un zincirler arası işlevselliği, ekosistem gelişimi, ağ güvenilirliği (16 ay boyunca %100 çalışırlık), kurumsal benimseme ve DeFi ile zincirler arası altyapıdaki rolü öne çıkan faktörlerdir.
S4: PUSH ve SOL’un uzun vadeli fiyat projeksiyonları nasıl? C: 2030’da PUSH’un temel senaryoda 0,046807458332805 - 0,054296651666053 $ aralığına, SOL’un ise 337,83044993420625 - 374,991799426968937 $ aralığına ulaşması bekleniyor.
S5: PUSH ve SOL için önerilen yatırım stratejileri nelerdir? C: Temkinli yatırımcılar için %10 PUSH - %90 SOL, agresif yatırımcılar için %30 PUSH - %70 SOL önerilir. SOL, güçlü ekosistemiyle uzun vadeli yatırım için genellikle daha elverişlidir.
S6: PUSH ve SOL yatırımında başlıca riskler nelerdir? C: PUSH, sınırlı piyasa değeri, likidite ve ölçeklenebilirlik gibi riskler taşır. SOL ise piyasa dalgalanmalarına, ağ tıkanıklığına ve regülasyon risklerine daha açıktır.
S7: Hangi kripto para yeni başlayanlar için daha avantajlı olabilir? C: SOL, yerleşik piyasa pozisyonu, büyük ekosistemi ve yüksek likiditesiyle yeni başlayanlara daha uygun olabilir. Ancak her yatırımcı kendi araştırmasını yapmalı ve risk profilini değerlendirmelidir.
Share
Content
Giriş: PUSH ve SOL Yatırımı Karşılaştırması
I. Fiyat Geçmişi Karşılaştırması ve Güncel Piyasa Durumu
II. PUSH ve SOL Yatırım Değerini Etkileyen Temel Unsurlar
III. 2025-2030 Fiyat Tahminleri: PUSH ve SOL
IV. Yatırım Stratejisi Karşılaştırması: PUSH ve SOL
V. Potansiyel Risk Karşılaştırması
VI. Sonuç: Hangisi Daha İyi Bir Yatırım?
VII. Sıkça Sorulan Sorular
How to Buy Cryptocurrency


Trending Cryptocurrencies


NEON ve THETA: Yapay zekâ uygulamalarında yeni nesil sinir ağı mimarilerinin karşılaştırmalı analizi

2025 JPrice Tahmini: Pandemi Sonrası Ekonomide Piyasa Trendleri ve J-Assets'in Gelecekteki Değerlemesi Analizi
ROOT ve SOL: Zincirler Arası Birlikte Çalışabilirlikte Blockchain Üstünlüğü Yarışı

WEN ve XLM: Büyük Dil Modellerinde Performans ile Tokenizasyon Verimliliğinin Karşılaştırılması

2025’te Solana (SOL) fiyatındaki dalgalanma nasıl bir seyir izleyecek?

XYRO ve SOL: Merkeziyetsiz Finans Platformlarının Geleceği Karşılaştırılıyor

Dropee Günlük Kombinasyonu 11 Aralık 2025
Tomarket Günlük Kombinasyonu 11 Aralık 2025

Merkeziyetsiz Finans'ta Geçici Kayıp Nedir?

Kripto Parada Çifte Harcama: Önleme Stratejileri

Kripto Ticaretinde Wyckoff Yönteminin Anlaşılması