P ve XLM: Gelişmekte Olan Piyasalarda Yatırım Performansına İlişkin Kapsamlı Bir Analiz


Giriş: P ile XLM Yatırımlarının Karşılaştırılması
Kripto para piyasasında PoPP (P) ve Stellar (XLM) arasındaki karşılaştırma, yatırımcıların göz ardı edemeyeceği bir gündemdir. İki varlık; piyasa değeri sıralaması, kullanım alanları ve fiyat performansı bakımından belirgin farklılıklar gösterirken, kripto varlıklar dünyasında da farklı konumlanmalarıyla öne çıkar.
Stellar (XLM): 2014 yılında piyasaya sürülmüş olup, sınır ötesi ödeme işlemlerindeki yüksek verimliliği sayesinde piyasa tarafından kabul görmüştür.
PoPP (P): 2025 yılında “Kullanıcı Odaklı Keşif ile Web3 Büyümesi” platformu olarak konumlandırılarak piyasaya çıkmıştır.
Bu makalede, P ile XLM’nin yatırım değerleri; geçmiş fiyat hareketleri, arz mekanizmaları, kurumsal benimseme, teknolojik ekosistemler ve gelecek öngörüleri açısından kapsamlı biçimde analiz edilerek, yatırımcıların en çok merak ettiği şu sorunun yanıtı aranacaktır:
“Şu anda hangisi daha avantajlı bir yatırım?”
I. Fiyat Geçmişi Karşılaştırması ve Güncel Piyasa Durumu
P ve XLM'nin Tarihsel Fiyat Seyri
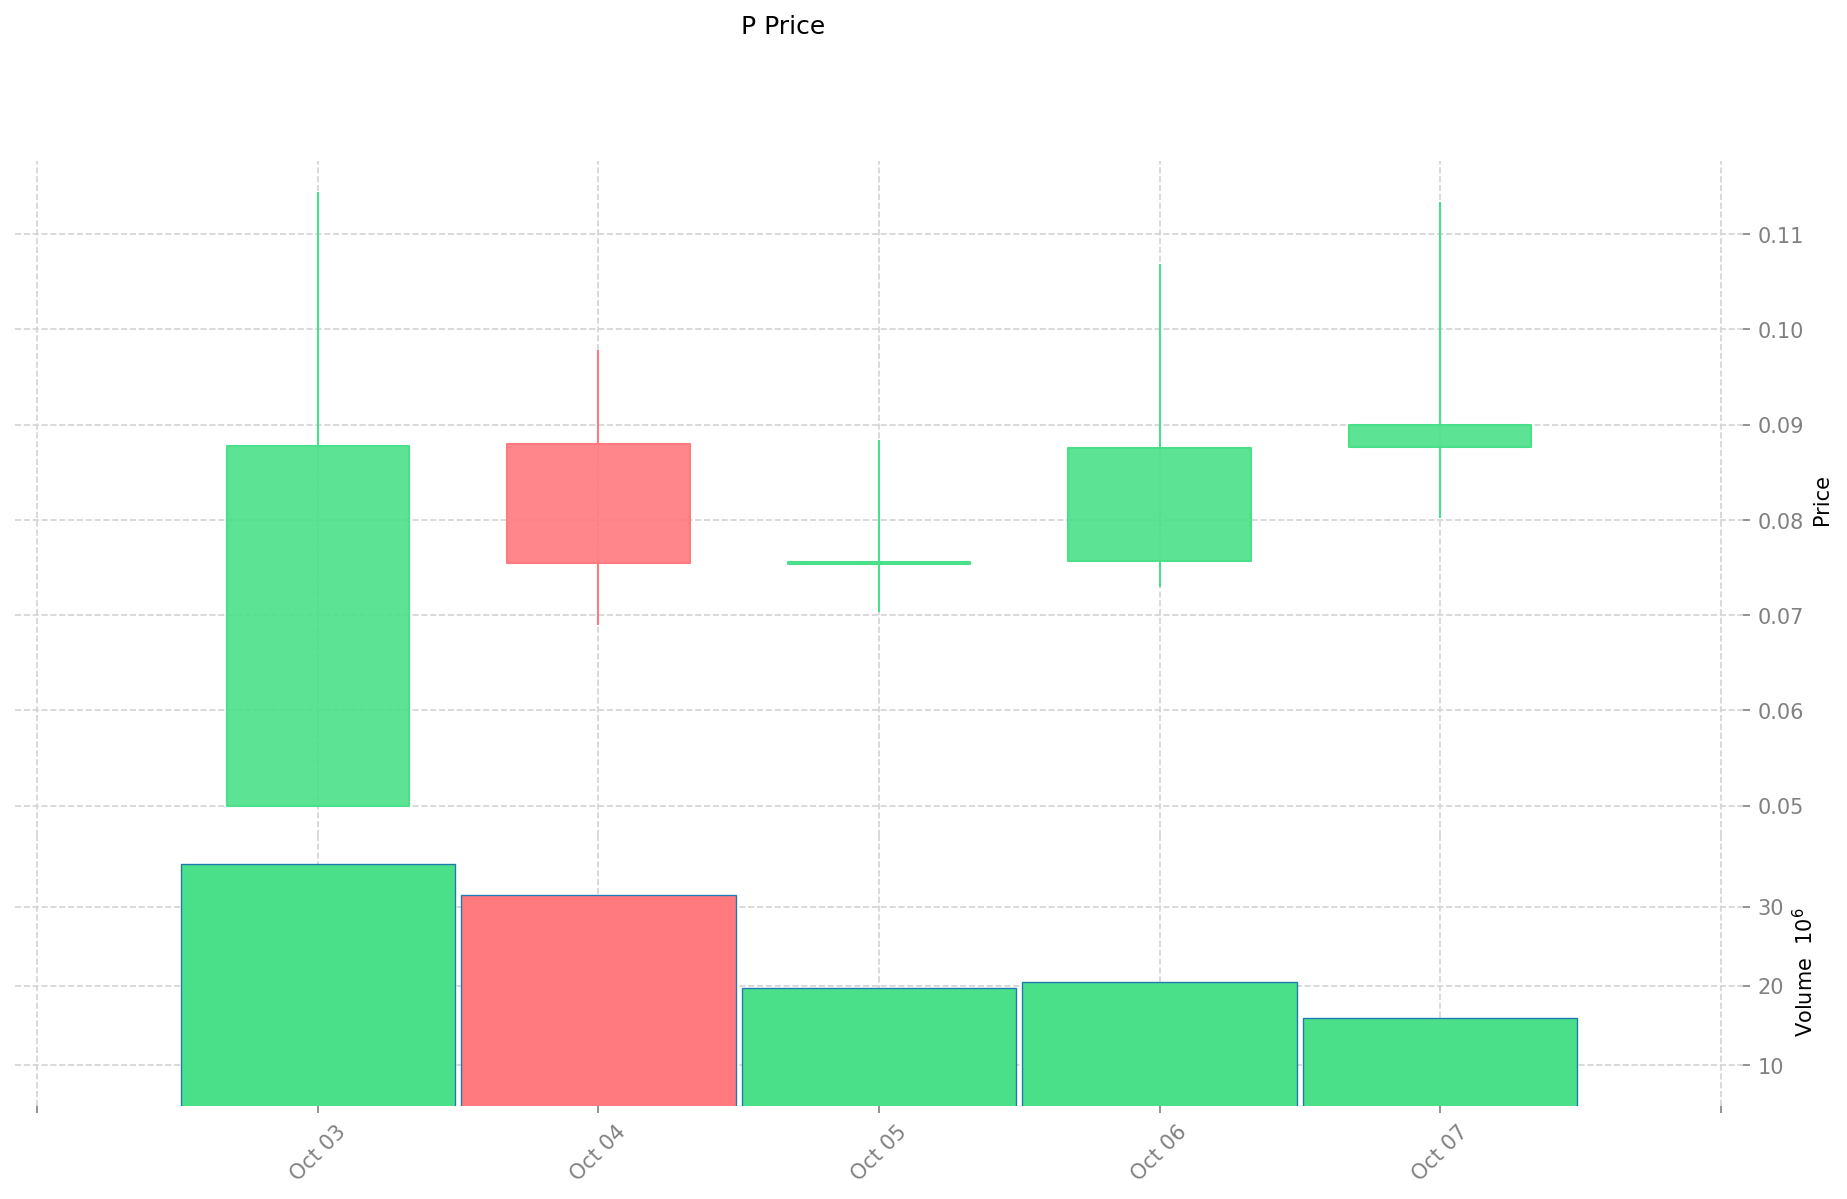
- 2025: P piyasaya çıktı ve 3 Ekim’de tüm zamanların en yüksek seviyesi olan $0,11443’a ulaştı.
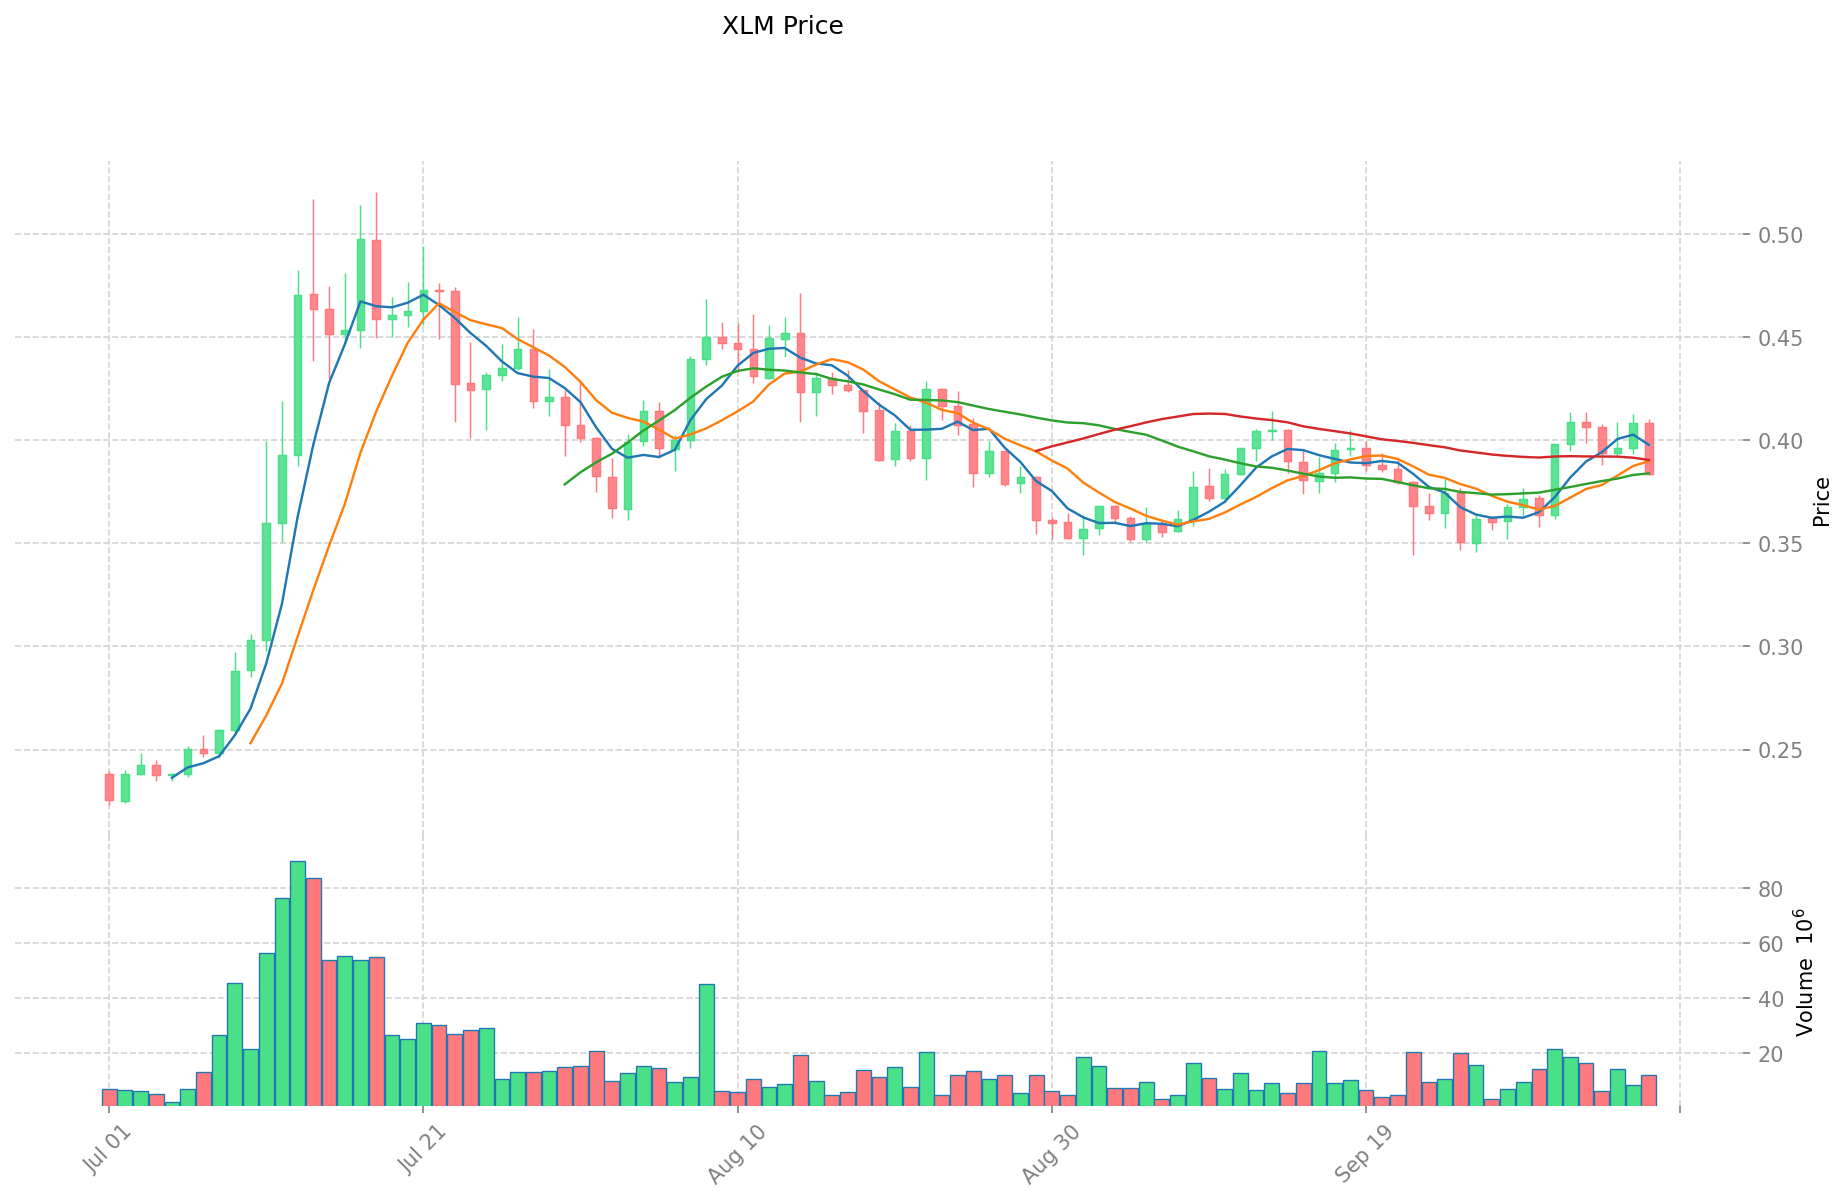
- 2018: XLM, 3 Ocak’ta tüm zamanların en yüksek seviyesi olan $0,875563’a ulaştı.
- Karşılaştırma: Güncel piyasa döngüsünde P, lansmandan bu yana $0,05-$0,11443 aralığında dalgalanırken, XLM ise 2014’ten beri uzun vadeli fiyat hareketleri sergilemiştir.
Güncel Piyasa Durumu (08 Ekim 2025)
- P'nin güncel fiyatı: $0,08974
- XLM'nin güncel fiyatı: $0,38441
- 24 saatlik işlem hacmi: $1.479.234,56 (P) ve $4.787.600,56 (XLM)
- Piyasa Duyarlılığı Endeksi (Korku & Açgözlülük Endeksi): 70 (Açgözlülük)
Anlık fiyatları görmek için tıklayın:
- P için güncel fiyat Piyasa Fiyatı
- XLM için güncel fiyat Piyasa Fiyatı
Stellar (XLM) Yatırım Değeri Analizi
I. XLM'nin Yatırım Değerini Etkileyen Temel Faktörler
Arz Mekanizması (Tokenomik)
- XLM: Sınırlı arz, sınırsız ihraç yok; uzun vadeli kıtlık avantajı ve enflasyon riskinden koruma
- 📌 Tarihsel Yönelim: Protokol güncellemeleri ve finansal iş birlikleri genellikle XLM talebini destekler
Kurumsal Benimseme ve Piyasa Kullanımı
- Kurumsal Kullanım: XLM, sınır ötesi ödeme ve mutabakatlarda 2-5 saniyede işlemi tamamlar
- İşlem Ücretleri: Sadece 0,00001 XLM ile son derece düşük; mikro ödemeler için ideal
- Ülke Politikaları: Ukrayna Merkez Bankası ile 2021’de dijital para pilotu iş birliği örneği
Teknik Gelişim ve Ekosistem Oluşumu
- XLM Teknik Yenilikleri: Protokol 23 yükseltmesi yolda ve piyasa algısını etkileyebilir
- Ekosistem Karşılaştırması: Stellar, stablecoin ve tokenize edilmiş gerçek varlıklar (RWA) dahil çeşitli varlıkların ihracını destekler
- Kullanım Odağı: Bitcoin (dijital altın) veya Ethereum (akıllı sözleşme platformu) yerine Stellar, sınır ötesi ödemeler ve varlık dolaşımında uzmanlaşmıştır
Makroekonomik ve Piyasa Döngüleri
- Piyasa Yapısı Etkisi: Düşük likidite, kısa vadede fiyat dalgalanmasını artırabilir
- Rekabet Konumu: Ripple (XRP), benzer sınır ötesi ödeme alanına odaklanırken, kurumsal yapıya yönelir; XLM finansal kapsayıcılık ve bireysel kullanıcıya odaklanır
- Fiyat Etkenleri: XLM fiyatı; temel göstergeler, dış piyasa koşulları ve piyasa yapısından etkilenir
III. 2025-2030 Fiyat Tahmini: P ve XLM
Kısa Vadeli Tahmin (2025)
- P: Muhafazakâr $0,0702-$0,09 | İyimser $0,09-$0,0999
- XLM: Muhafazakâr $0,2151632-$0,38422 | İyimser $0,38422-$0,3957466
Orta Vadeli Tahmin (2027)
- P büyüme fazına geçebilir, fiyat aralığı $0,071184015-$0,152537175 olarak öngörülmekte
- XLM büyüme fazına geçebilir, fiyat aralığı $0,25146123184-$0,56095197872 olarak tahmin edilmekte
- Belirleyici unsurlar: Kurumsal sermaye girişi, ETF, ekosistem gelişimi
Uzun Vadeli Tahmin (2030)
- P: Temel senaryo $0,105680678469187-$0,18540469906875 | İyimser senaryo $0,18540469906875-$0,220631591891812
- XLM: Temel senaryo $0,608313990875504-$0,732908422741572 | İyimser senaryo $0,732908422741572-$0,996755454928537
Feragatname
P:
| Yıl | Tahmini En Yüksek Fiyat | Tahmini Ortalama Fiyat | Tahmini En Düşük Fiyat | Değişim Oranı |
|---|---|---|---|---|
| 2025 | 0,0999 | 0,09 | 0,0702 | 0 |
| 2026 | 0,131031 | 0,09495 | 0,060768 | 5 |
| 2027 | 0,152537175 | 0,1129905 | 0,071184015 | 25 |
| 2028 | 0,192507564375 | 0,1327638375 | 0,067709557125 | 47 |
| 2029 | 0,2081736972 | 0,1626357009375 | 0,10733956261875 | 81 |
| 2030 | 0,220631591891812 | 0,18540469906875 | 0,105680678469187 | 106 |
XLM:
| Yıl | Tahmini En Yüksek Fiyat | Tahmini Ortalama Fiyat | Tahmini En Düşük Fiyat | Değişim Oranı |
|---|---|---|---|---|
| 2025 | 0,3957466 | 0,38422 | 0,2151632 | 0 |
| 2026 | 0,577175284 | 0,3899833 | 0,230090147 | 1 |
| 2027 | 0,56095197872 | 0,483579292 | 0,25146123184 | 25 |
| 2028 | 0,7468398585648 | 0,52226563536 | 0,3760312574592 | 35 |
| 2029 | 0,831264098520744 | 0,6345527469624 | 0,60282510961428 | 65 |
| 2030 | 0,996755454928537 | 0,732908422741572 | 0,608313990875504 | 90 |
IV. Yatırım Stratejisi Karşılaştırması: P ve XLM
Uzun Vadeli ve Kısa Vadeli Yatırım Stratejileri
- P: Web3 keşfi ve büyüme potansiyeline odaklanan yatırımcılar için uygun
- XLM: Sınır ötesi ödeme çözümleri ve finansal kapsayıcılığa odaklanan yatırımcılar için uygun
Risk Yönetimi ve Varlık Dağılımı
- Temkinli yatırımcılar: P %20, XLM %80
- Daha agresif yatırımcılar: P %40, XLM %60
- Koruma araçları: Stablecoin tahsisi, opsiyonlar, çapraz para portföyleri
V. Potansiyel Risk Karşılaştırması
Piyasa Riski
- P: Daha yeni bir varlık ve düşük piyasa değeri nedeniyle yüksek oynaklık riski
- XLM: Diğer sınır ötesi ödeme çözümlerinden kaynaklanan rekabet potansiyeli
Teknik Risk
- P: Ölçeklenebilirlik ve ağ istikrarı
- XLM: Yüksek işlem hacmi dönemlerinde ağ sıkışıklığı, olası akıllı sözleşme açıkları
Düzenleyici Risk
- Global düzenleyici politikalar her iki varlığı farklı şekillerde etkileyebilir
VI. Sonuç: Hangisi Daha Avantajlı Alım?
📌 Yatırım Değeri Özeti:
- P'nin avantajları: Yeni Web3 keşif platformu ve büyüme potansiyeli
- XLM'nin avantajları: Kurumsal kabul görmüş, oturmuş sınır ötesi ödeme çözümü
✅ Yatırım Tavsiyesi:
- Yeni yatırımcılar: Sınır ötesi ödeme sektörüne maruz kalmak için XLM’ye az miktarda yatırım yapmayı düşünmeli
- Tecrübeli yatırımcılar: Hem P hem XLM’den oluşan dengeli portföy, kendi risk toleransına göre ayarlanmalı
- Kurumsal yatırımcılar: Sınır ötesi ödemelerdeki köklü geçmişi nedeniyle XLM’yi önceliklendirmeli
⚠️ Risk Uyarısı: Kripto para piyasası oldukça dalgalı yapıdadır. Bu yazı yatırım tavsiyesi değildir. None
VII. Sıkça Sorulan Sorular
S1: P ile XLM arasındaki ana farklar nelerdir? C: P, 2025’te piyasaya çıkan yeni bir “Kullanıcı Odaklı Keşif ile Web3 Büyümesi” platformudur; XLM ise 2014’ten beri sınır ötesi ödeme ve finansal kapsayıcılığa odaklanan köklü bir kripto paradır.
S2: Son dönemde hangisi daha iyi fiyat performansı sergiledi? C: 08 Ekim 2025 itibarıyla P, $0,08974 seviyesinde ve en yüksek $0,11443’a ulaşırken; XLM $0,38441 ile 2018’deki $0,875563 zirvesinin oldukça altında seyretmektedir.
S3: Arz mekanizmaları nasıl farklılık gösteriyor? C: XLM sabit arz ile sınırsız ihraç olmaksızın uzun vadeli kıtlık avantajı sunar. P’nin arz mekanizması verilen bilgilerde net olarak belirtilmemiştir.
S4: Her bir kripto paranın temel kullanım alanları nelerdir? C: P, Web3 keşfi ve büyümesi odağındadır; XLM ise hızlı sınır ötesi ödeme ve mutabakatlarda, düşük işlem ücretleriyle 2-5 saniyede işlem tamamlama avantajı sağlar.
S5: Uzun vadeli fiyat tahminleri nasıl karşılaştırılıyor? C: 2030 yılı için P’nin $0,105680678469187-$0,220631591891812 aralığına, XLM’nin ise temel senaryoda $0,608313990875504-$0,996755454928537 aralığına ulaşacağı öngörülmektedir.
S6: P ve XLM yatırımıyla ilgili başlıca riskler nelerdir? C: P, yeni bir varlık ve düşük piyasa değeri nedeniyle daha yüksek oynaklığa sahipken; XLM’de ise rekabet ve yüksek hacimli işlemlerde ağ sıkışıklığı gibi riskler öne çıkmaktadır.
S7: Yatırımcılar P ve XLM arasında nasıl bir portföy dağılımı yapmalı? C: Temkinli yatırımcılar için %20 P ve %80 XLM; agresif yatırımcılar için ise %40 P ve %60 XLM öngörülebilir; portföy dağılımı, bireysel risk toleransı ve yatırım hedeflerine göre ayarlanmalıdır.
Share
Content
Giriş: P ile XLM Yatırımlarının Karşılaştırılması
I. Fiyat Geçmişi Karşılaştırması ve Güncel Piyasa Durumu
I. XLM'nin Yatırım Değerini Etkileyen Temel Faktörler
III. 2025-2030 Fiyat Tahmini: P ve XLM
IV. Yatırım Stratejisi Karşılaştırması: P ve XLM
V. Potansiyel Risk Karşılaştırması
VI. Sonuç: Hangisi Daha Avantajlı Alım?
VII. Sıkça Sorulan Sorular
How to Buy Cryptocurrency


Trending Cryptocurrencies


2025 AMP Fiyat Tahmini: Kripto Para Yatırımcılarına Yönelik Stratejik Analiz ve Piyasa Görünümü

2025 REQ Fiyat Tahmini: Request Network için piyasa trendleri ve olası büyüme faktörlerinin analizi

2025 WPAY Fiyat Tahmini: Dijital ödeme token’ının gelecekteki büyüme potansiyeli ve piyasa eğilimleri üzerine analiz
2025 UTK Fiyat Tahmini: Dijital ödeme ekosisteminin gelişimiyle birlikte UTRUST Token'ın büyüme potansiyelini ve piyasa trendlerini analiz etmek

UNA ve XLM: Sınır ötesi işlemlerde kullanılan iki yenilikçi blockchain protokolünün karşılaştırılması

MOVE ve XLM: İki Yenilikçi Blockchain Programlama Dili Karşılaştırması
Dropee Günlük Kombinasyonu 11 Aralık 2025
Tomarket Günlük Kombinasyonu 11 Aralık 2025

Merkeziyetsiz Finans'ta Geçici Kayıp Nedir?

Kripto Parada Çifte Harcama: Önleme Stratejileri

Kripto Ticaretinde Wyckoff Yönteminin Anlaşılması