ORBR vs QNT: A Comparative Analysis of Two Emerging Blockchain Technologies
Introduction: ORBR vs QNT Investment Comparison
In the cryptocurrency market, the comparison between Orbler (ORBR) and Quant (QNT) has been an unavoidable topic for investors. The two not only show significant differences in market cap ranking, application scenarios, and price performance but also represent different positioning in the crypto asset landscape.
Orbler (ORBR): Since its launch, it has gained market recognition for its position as a blockchain-based real-time defense game for global players.
Quant (QNT): Introduced in 2018, it has been hailed as a technology provider enabling trusted digital interactions, recognized for solving interoperability issues through its global blockchain operating system, Overledger.
This article will comprehensively analyze the investment value comparison between ORBR and QNT, focusing on historical price trends, supply mechanisms, institutional adoption, technological ecosystems, and future predictions, attempting to answer the question most crucial to investors:
"Which is the better buy right now?"
I. Price History Comparison and Current Market Status
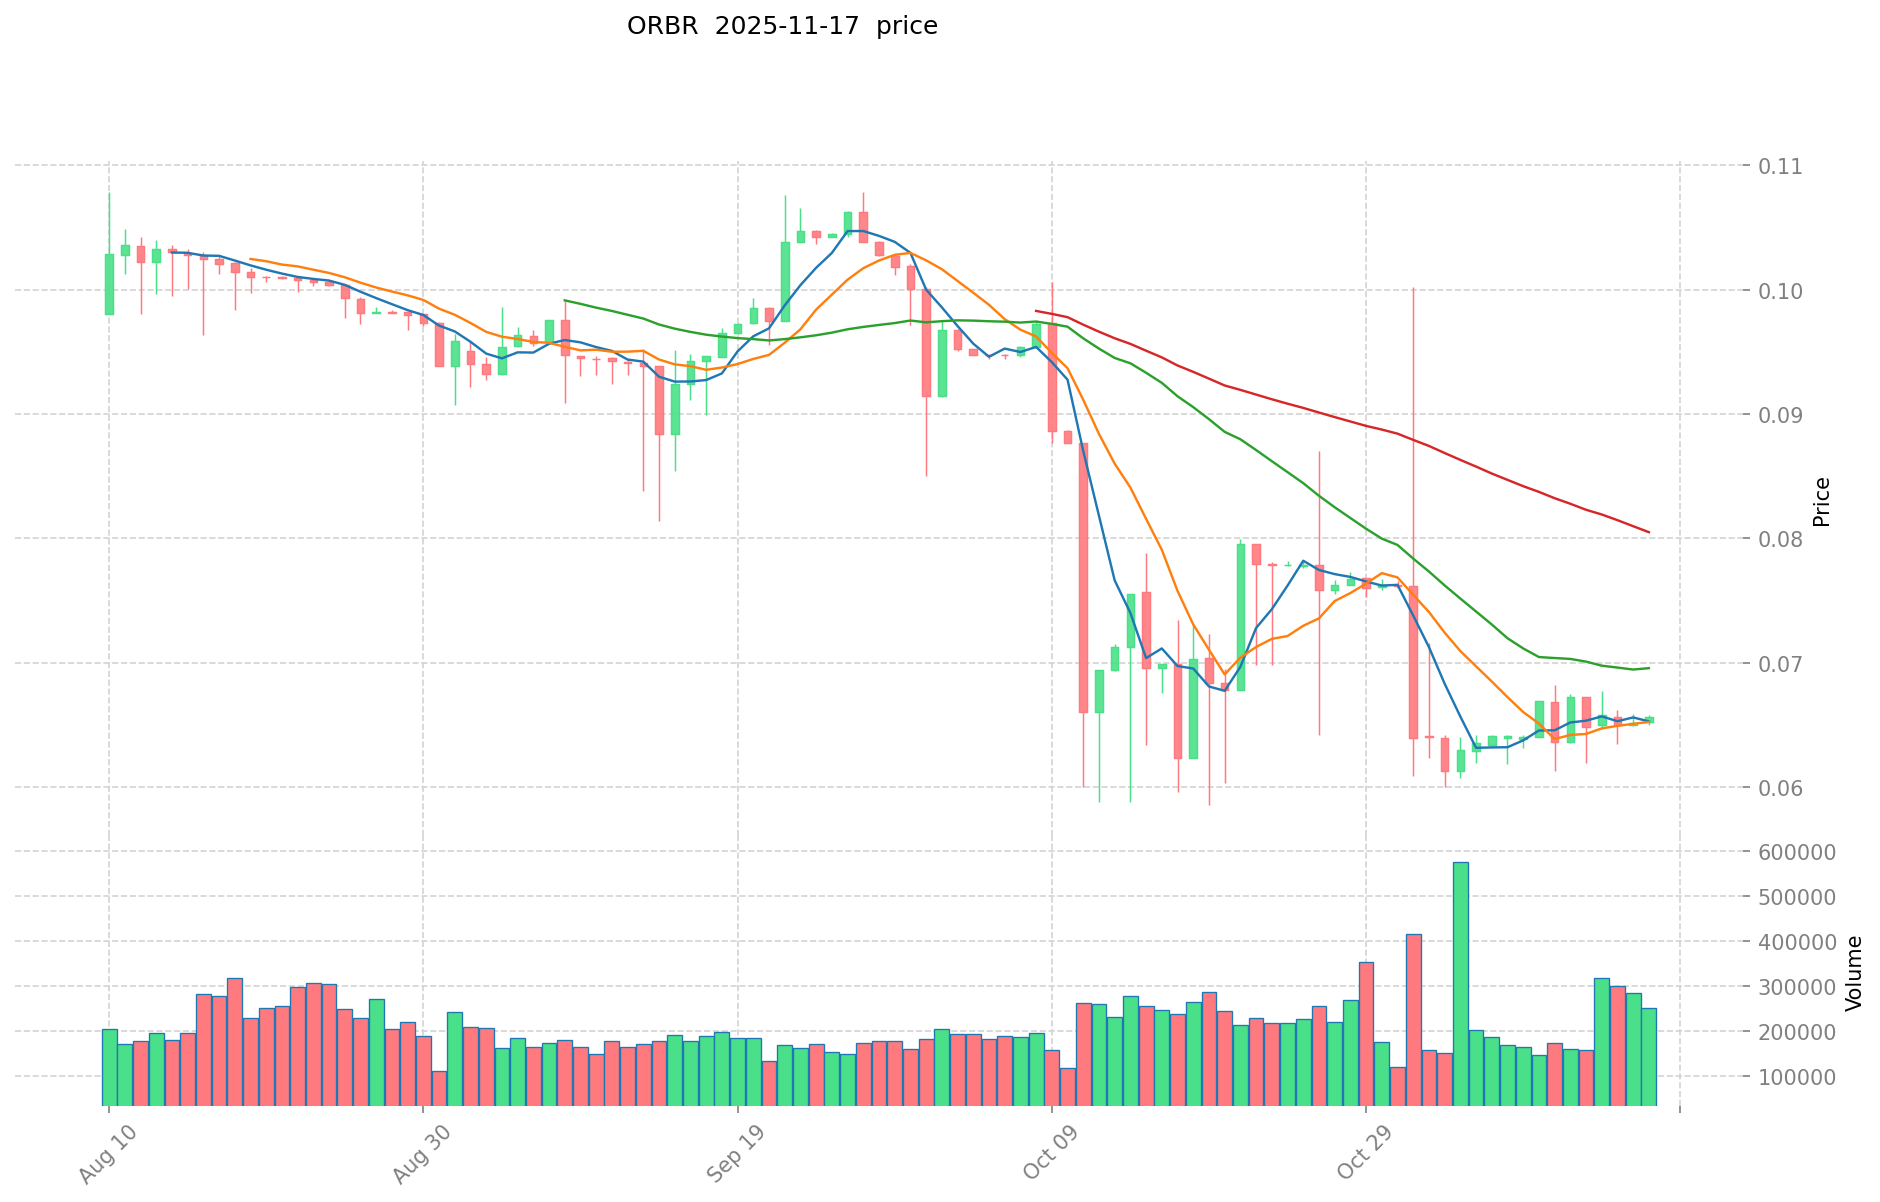
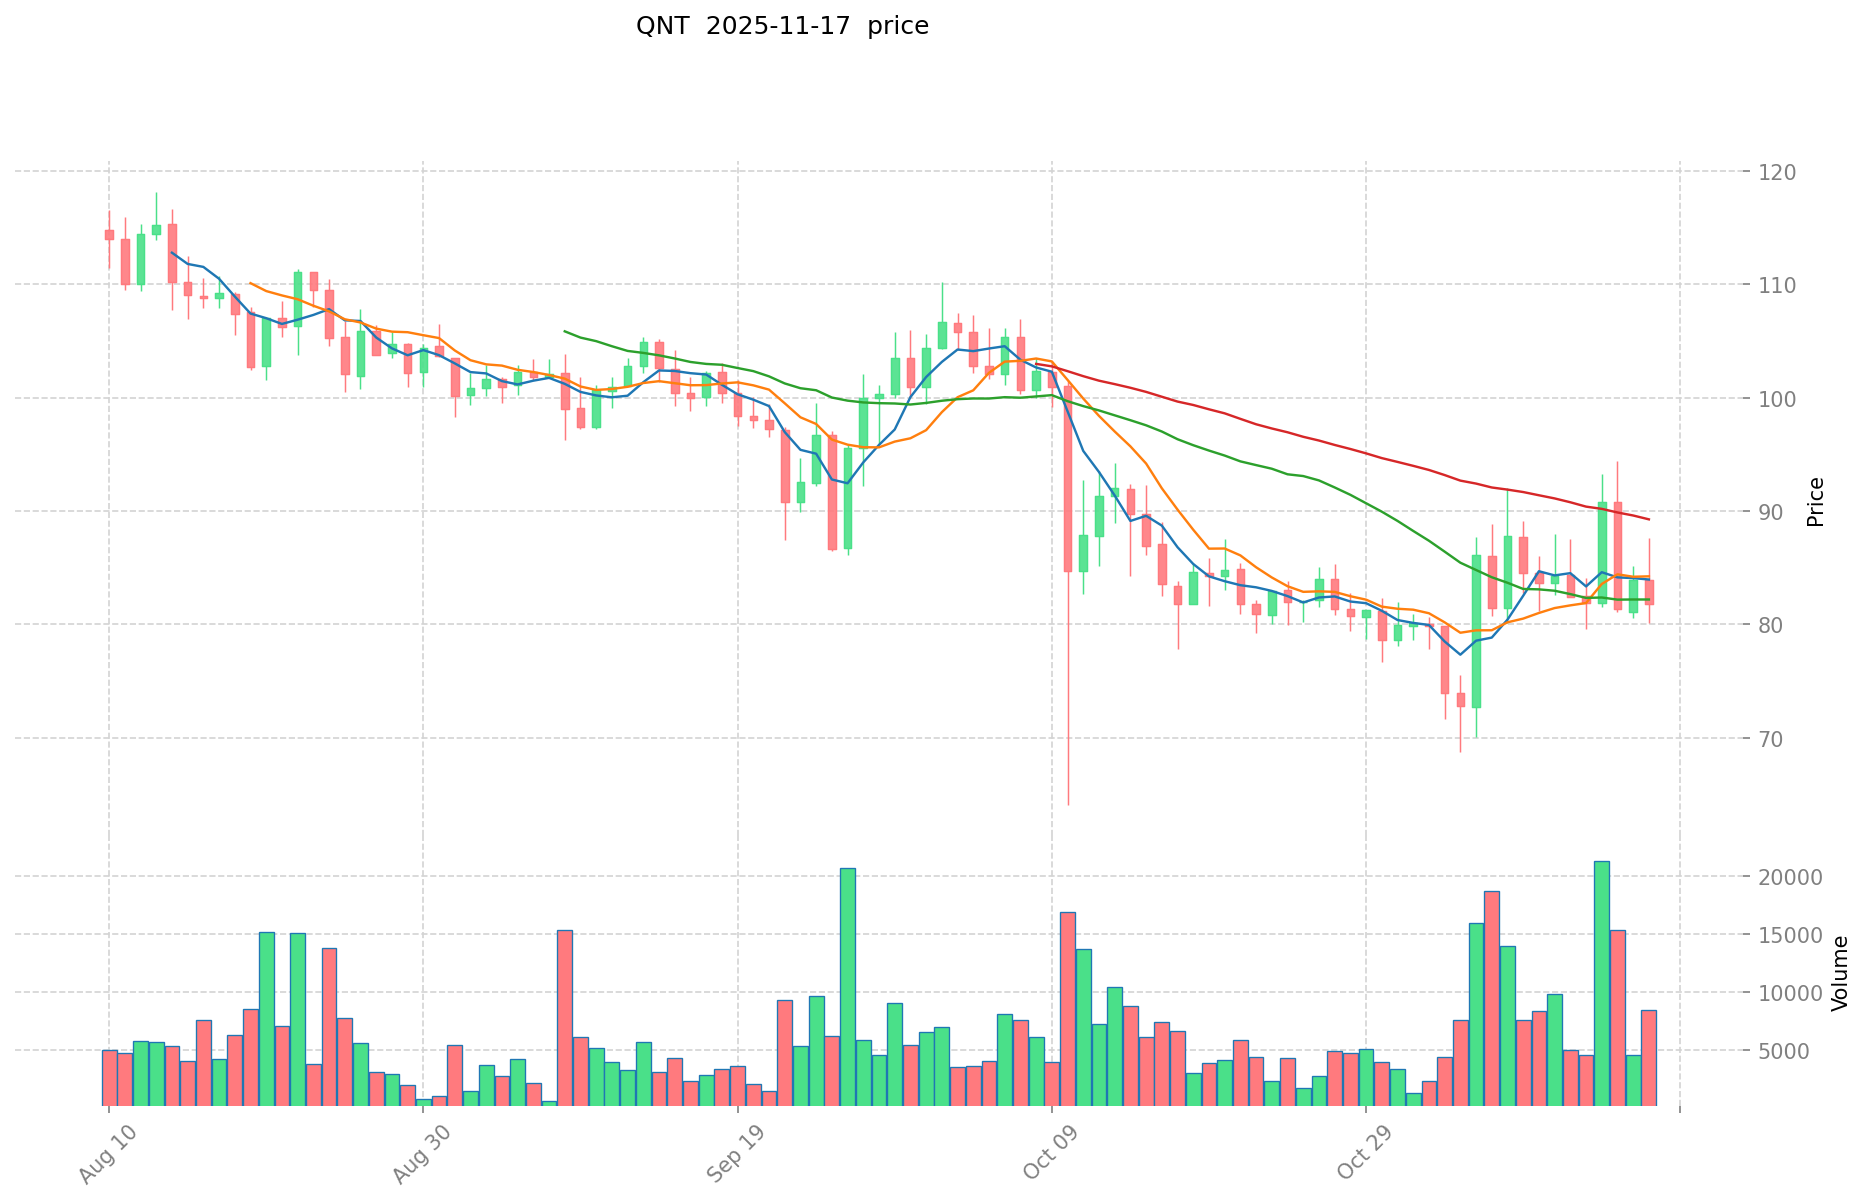
ORBR (Coin A) and QNT (Coin B) Historical Price Trends
- 2022: ORBR reached its all-time high of $44.91 on April 10, 2022.
- 2021: QNT hit its all-time high of $427.42 on September 11, 2021.
- Comparative Analysis: In the current market cycle, ORBR has dropped from its all-time high of $44.91 to a current price of $0.06563, while QNT has fallen from its peak of $427.42 to $80.75.
Current Market Situation (2025-11-17)
- ORBR current price: $0.06563
- QNT current price: $80.75
- 24-hour trading volume: ORBR $20,161.45 vs QNT $763,627.62
- Market Sentiment Index (Fear & Greed Index): 10 (Extreme Fear)
Click to view real-time prices:
- View ORBR current price Market Price
- View QNT current price Market Price
II. Core Factors Affecting Investment Value of ORBR vs QNT
Supply Mechanism Comparison (Tokenomics)
- ORBR: Fixed supply of 100 million tokens with a deflationary model; tokens are burned with each transaction in the ecosystem
- QNT: Fixed supply of 14.6 million tokens with no additional minting; utilizes a license model where tokens are locked up for usage
- 📌 Historical pattern: Fixed supply models tend to create upward price pressure during periods of increasing adoption, with QNT's significantly smaller supply potentially leading to higher price volatility during demand surges
Institutional Adoption and Market Applications
- Institutional holdings: QNT has gained more institutional attention with partnerships with major financial institutions and inclusion in regulated investment products
- Enterprise adoption: QNT leads in enterprise integration through its Overledger network connecting to major payment systems, while ORBR is building its presence in cross-border transactions
- Regulatory stance: QNT maintains stronger regulatory compliance across jurisdictions, particularly in UK and EU markets, providing greater certainty for institutional users
Technology Development and Ecosystem Building
- ORBR technical upgrades: Recent Layer-2 scaling solutions and cross-chain interoperability features that enhance transaction throughput
- QNT technology development: Overledger operating system continues to evolve with enterprise-grade security features and multi-ledger compatibility
- Ecosystem comparison: QNT has stronger established enterprise connections while ORBR is developing more DeFi and payment applications; both have limited presence in NFT markets
Macroeconomic Factors and Market Cycles
- Inflation environment performance: QNT has historically shown stronger resilience during inflation periods due to institutional backing
- Macroeconomic monetary policy: Both tokens show sensitivity to interest rate changes, with QNT typically displaying lower correlation to broader market movements
- Geopolitical factors: QNT's positioning in regulated markets provides stability during uncertain periods, while ORBR may benefit more from increasing cross-border transaction demand in emerging markets
III. 2025-2030 Price Prediction: ORBR vs QNT
Short-term Prediction (2025)
- ORBR: Conservative $0.0485-$0.0656 | Optimistic $0.0656-$0.0807
- QNT: Conservative $47.60-$80.69 | Optimistic $80.69-$92.79
Mid-term Prediction (2027)
- ORBR may enter a growth phase, with prices expected in the range of $0.0834-$0.1264
- QNT may enter a steady growth phase, with prices expected in the range of $86.25-$113.70
- Key drivers: Institutional capital inflow, ETFs, ecosystem development
Long-term Prediction (2030)
- ORBR: Base scenario $0.1057-$0.1373 | Optimistic scenario $0.1373-$0.1949
- QNT: Base scenario $85.32-$137.62 | Optimistic scenario $137.62-$148.63
Disclaimer: This analysis is based on historical data and current market trends. Cryptocurrency markets are highly volatile and unpredictable. This information should not be considered as financial advice. Always conduct your own research before making any investment decisions.
ORBR:
| 年份 | 预测最高价 | 预测平均价格 | 预测最低价 | 涨跌幅 |
|---|---|---|---|---|
| 2025 | 0.0807126 | 0.06562 | 0.0485588 | 0 |
| 2026 | 0.10243282 | 0.0731663 | 0.049021421 | 11 |
| 2027 | 0.1264313664 | 0.08779956 | 0.083409582 | 33 |
| 2028 | 0.129609710472 | 0.1071154632 | 0.0803365974 | 63 |
| 2029 | 0.15623861462352 | 0.118362586836 | 0.10179182467896 | 80 |
| 2030 | 0.194966853036259 | 0.13730060072976 | 0.105721462561915 | 109 |
QNT:
| 年份 | 预测最高价 | 预测平均价格 | 预测最低价 | 涨跌幅 |
|---|---|---|---|---|
| 2025 | 92.7935 | 80.69 | 47.6071 | 0 |
| 2026 | 109.294605 | 86.74175 | 81.537245 | 7 |
| 2027 | 113.7010859 | 98.0181775 | 86.2559962 | 21 |
| 2028 | 151.379273331 | 105.8596317 | 85.746301677 | 31 |
| 2029 | 146.62617586767 | 128.6194525155 | 73.313087933835 | 59 |
| 2030 | 148.6326393269118 | 137.622814191585 | 85.3261447987827 | 70 |
IV. Investment Strategy Comparison: ORBR vs QNT
Long-term vs Short-term Investment Strategies
- ORBR: Suitable for investors focused on gaming ecosystems and cross-border payment potential
- QNT: Suitable for investors seeking institutional adoption and interoperability solutions
Risk Management and Asset Allocation
- Conservative investors: ORBR: 20% vs QNT: 80%
- Aggressive investors: ORBR: 40% vs QNT: 60%
- Hedging tools: Stablecoin allocation, options, cross-currency combinations
V. Potential Risk Comparison
Market Risk
- ORBR: Higher volatility due to smaller market cap and gaming sector fluctuations
- QNT: Exposure to enterprise adoption cycles and competition in the interoperability space
Technical Risk
- ORBR: Scalability, network stability
- QNT: Centralization concerns, potential security vulnerabilities in the Overledger system
Regulatory Risk
- Global regulatory policies may have different impacts on both, with QNT potentially facing more scrutiny due to its focus on institutional markets
VI. Conclusion: Which Is the Better Buy?
📌 Investment Value Summary:
- ORBR advantages: Deflationary model, gaming ecosystem potential, cross-border transaction focus
- QNT advantages: Strong institutional adoption, established interoperability solution, fixed supply with larger market cap
✅ Investment Advice:
- New investors: Consider a balanced approach, leaning towards QNT for its established market presence
- Experienced investors: Explore a strategic allocation to both, with a higher weight on QNT for stability
- Institutional investors: Focus on QNT for its enterprise-grade solutions and regulatory compliance
⚠️ Risk Warning: The cryptocurrency market is highly volatile. This article does not constitute investment advice. None
FAQ
Q1: What are the main differences between ORBR and QNT? A: ORBR is a blockchain-based real-time defense game token with a fixed supply of 100 million, while QNT is an enterprise-focused interoperability solution with a fixed supply of 14.6 million tokens. QNT has stronger institutional adoption and regulatory compliance, while ORBR focuses more on gaming and cross-border payments.
Q2: Which token has performed better historically? A: QNT has shown stronger historical performance, reaching an all-time high of $427.42 in September 2021, compared to ORBR's all-time high of $44.91 in April 2022. QNT has also demonstrated better resilience during inflation periods due to its institutional backing.
Q3: What are the price predictions for ORBR and QNT in 2030? A: For ORBR, the base scenario predicts a range of $0.1057-$0.1373, with an optimistic scenario of $0.1373-$0.1949. For QNT, the base scenario predicts a range of $85.32-$137.62, with an optimistic scenario of $137.62-$148.63.
Q4: How do the supply mechanisms of ORBR and QNT differ? A: ORBR has a fixed supply of 100 million tokens with a deflationary model, burning tokens with each transaction. QNT has a fixed supply of 14.6 million tokens with no additional minting and uses a license model where tokens are locked up for usage.
Q5: Which token is considered more suitable for institutional investors? A: QNT is generally considered more suitable for institutional investors due to its stronger institutional adoption, partnerships with major financial institutions, and better regulatory compliance across jurisdictions, particularly in UK and EU markets.
Q6: What are the main risks associated with investing in ORBR and QNT? A: ORBR faces higher volatility due to its smaller market cap and exposure to gaming sector fluctuations, as well as potential scalability and network stability issues. QNT risks include exposure to enterprise adoption cycles, competition in the interoperability space, and potential centralization concerns.
Q7: How should investors allocate their assets between ORBR and QNT? A: For conservative investors, a suggested allocation is 20% ORBR and 80% QNT. For aggressive investors, the recommendation is 40% ORBR and 60% QNT. However, individual allocations should be based on personal risk tolerance and investment goals.
Share
Content
Introduction: ORBR vs QNT Investment Comparison
I. Price History Comparison and Current Market Status
II. Core Factors Affecting Investment Value of ORBR vs QNT
III. 2025-2030 Price Prediction: ORBR vs QNT
IV. Investment Strategy Comparison: ORBR vs QNT
V. Potential Risk Comparison
VI. Conclusion: Which Is the Better Buy?
FAQ

