OLE vs SAND: Blockchain Döneminde Dijital Varlıkların Egemenliği İçin Rekabet

Giriş: OLE ve SAND Yatırımı Karşılaştırması
Kripto para piyasasında OpenLeverage (OLE) ile The Sandbox (SAND) karşılaştırması, yatırımcıların göz ardı edemeyeceği bir konu halini almıştır. Bu iki varlık, piyasa değeri sıralamaları, kullanım alanları ve fiyat performanslarıyla belirgin şekilde ayrışmakta; aynı zamanda kripto varlıkların pozisyonlanmasında farklı yaklaşımları temsil etmektedir.
OpenLeverage (OLE): Lansmanından bu yana, izinsiz borç verme ve kaldıraçlı işlem protokolüyle sektör tarafından kabul görmektedir.
The Sandbox (SAND): İlk günden itibaren sanal bir oyun dünyası olarak öne çıkmış; yüksek küresel işlem hacmi ve piyasa değerine sahip başlıca kripto paralardan biri haline gelmiştir.
Bu makalede OLE ve SAND’in yatırım değerleri; geçmiş fiyat hareketleri, arz mekanizmaları, kurumsal benimseme, teknolojik ekosistemler ve gelecek tahminleri odağında kapsamlı olarak karşılaştırılacak ve yatırımcıların en büyük merak konusu olan şu soruya yanıt aranacaktır:
"Şu anda hangisi daha iyi bir yatırım?" Aşağıda sunulan bilgilere göre analiz:
I. Fiyat Geçmişi Karşılaştırması ve Mevcut Piyasa Durumu
OpenLeverage (OLE) ve The Sandbox (SAND) Geçmiş Fiyat Hareketleri
- 2021: SAND, metaverse rüzgârıyla ciddi bir büyüme yakaladı ve $8,40 ile rekor seviyeye ulaştı.
- 2022: OLE, token’ını piyasaya sürdü; yeni kripto projelerine özgü dalgalanma gözlendi.
- Karşılaştırmalı analiz: 2022’deki piyasa düşüşünde SAND, zirveden $1’ın altına inerken; OLE ise yeni bir token olarak yüksek volatilite sergiledi.
Mevcut Piyasa Durumu (30 Ekim 2025)
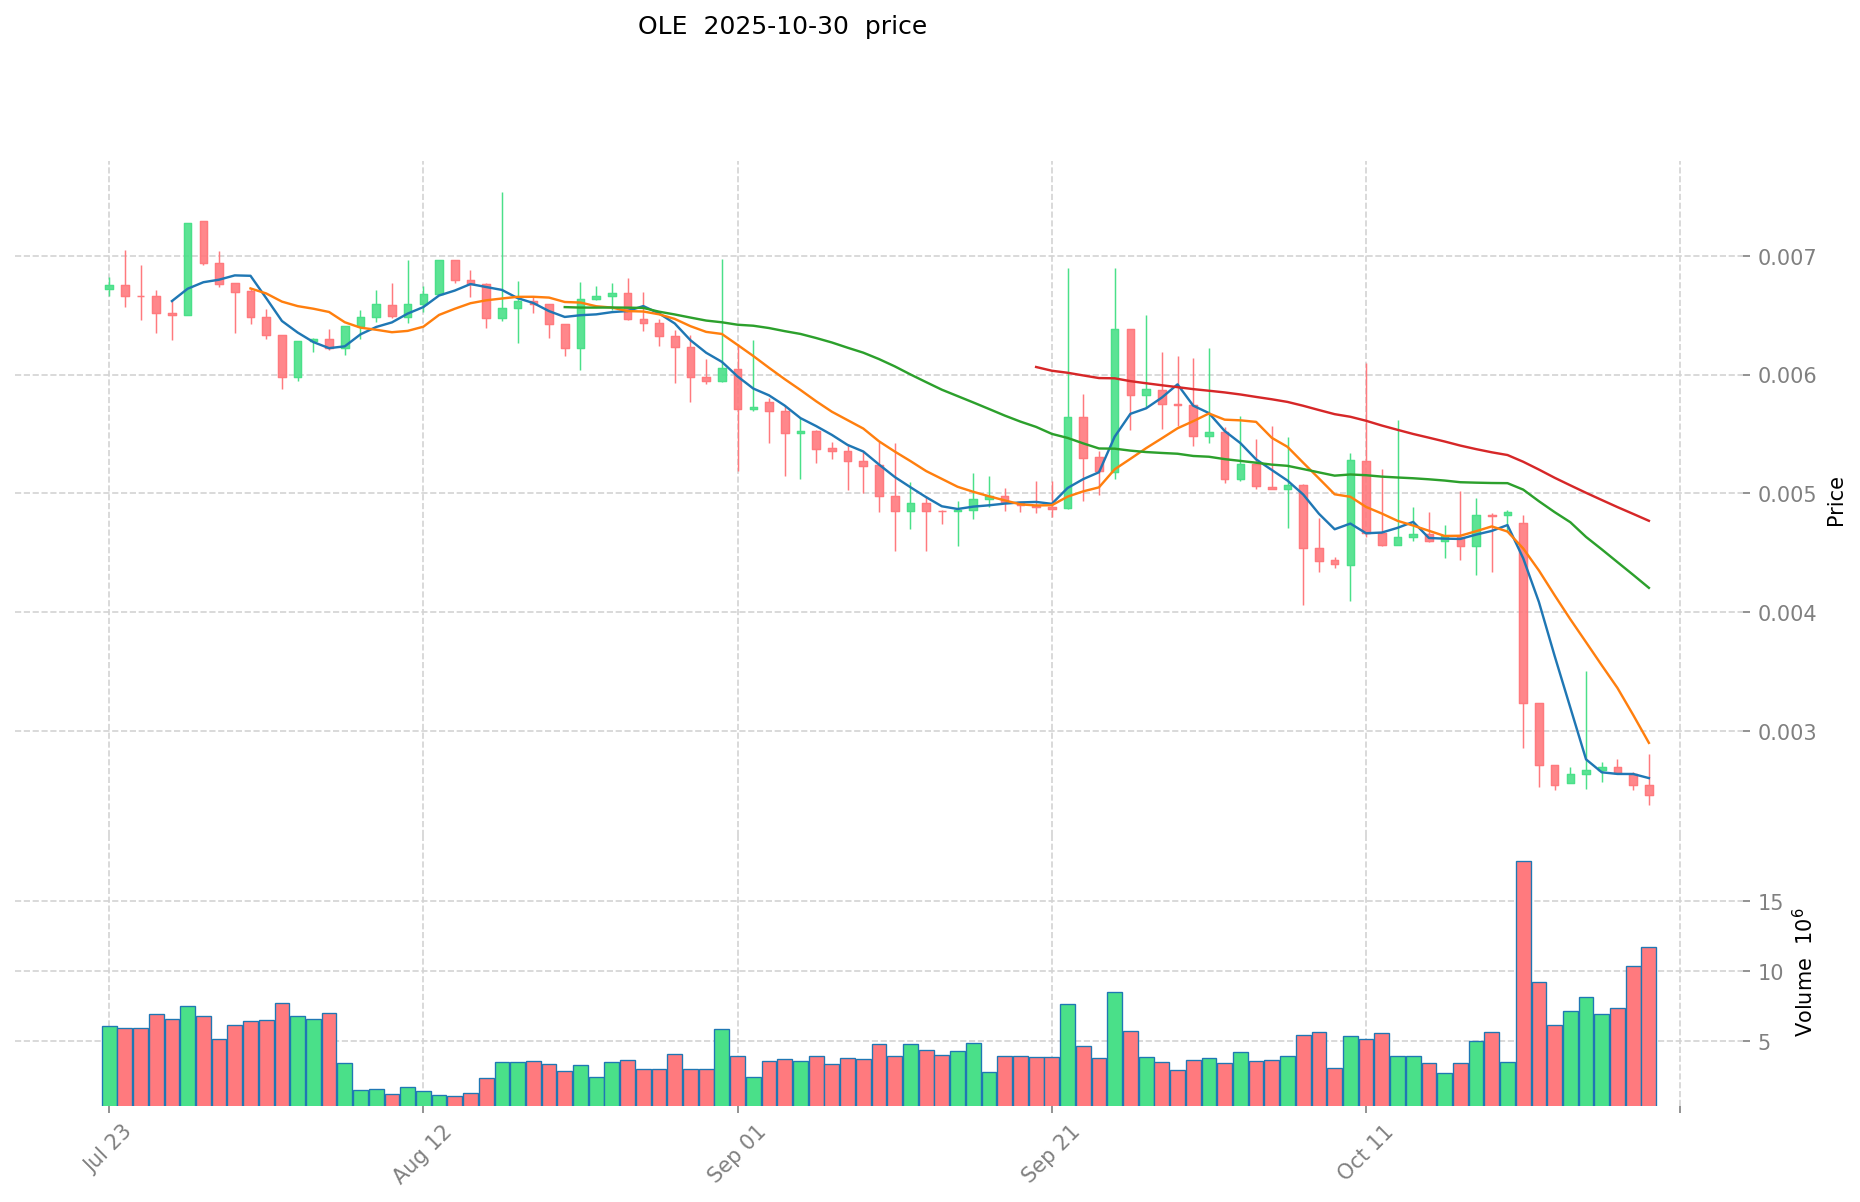
- OLE güncel fiyatı: $0,00245
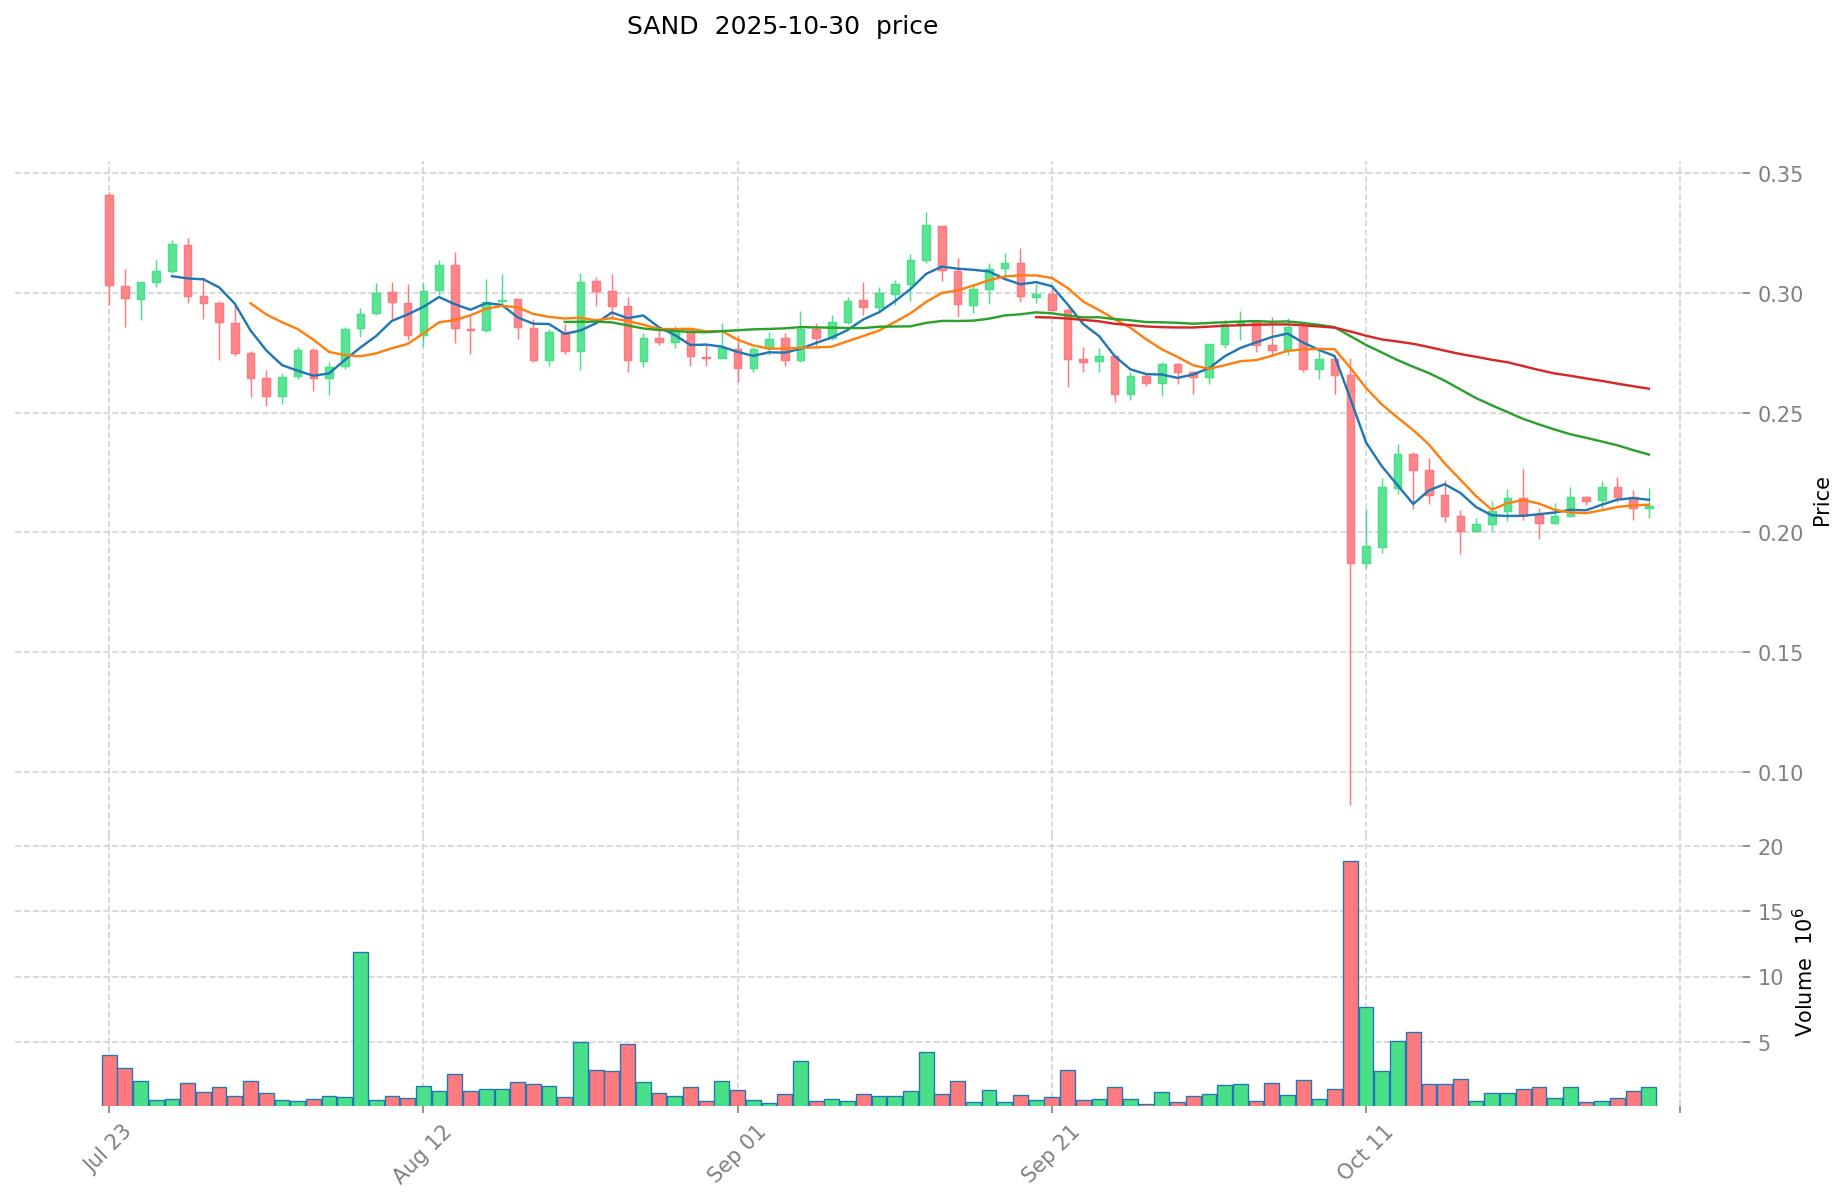
- SAND güncel fiyatı: $0,1976
- 24 saatlik işlem hacmi: OLE $20.923,62 | SAND $354.312,66
- Piyasa Duyarlılık Endeksi (Korku & Açgözlülük Endeksi): 34 (Korku)
Anlık fiyatları görüntülemek için tıklayın:
- OLE güncel fiyatı Piyasa Fiyatı
- SAND güncel fiyatı Piyasa Fiyatı
OLE ve SAND Yatırım Değerini Etkileyen Temel Unsurlar
Arz Mekanizması Karşılaştırması (Tokenomik)
- OLE: Temel ürün OYL cüzdan ve Runes’a programlanabilirlik kazandıran Protorunes meta-protokolüdür.
- SAND: Sanal dünya ekonomilerine odaklanan dijital para modeli.
- 📌 Tarihsel desen: Dijital varlıkların arz mekanizması, kıtlık prensibi ve benimsenme oranlarıyla fiyat döngülerine yön verir.
Kurumsal Benimseme ve Piyasa Uygulamaları
- Kurumsal portföyler: Bu varlıklar arasında kurumsal tercihlerle ilgili veri sınırlıdır.
- Kurumsal benimseme: Her iki proje de ödeme çözümleri ve sadakat programlarını birleştiren entegre hizmetler sunmayı hedefliyor.
- Mevzuat yaklaşımları: Dijital paralar, ülkeden ülkeye değişen düzenlemelere tabi; bazıları pilot aşamaya (Çin, İsveç), bazıları ise tam lansmana (Bahamalar) geçmiştir.
Teknoloji Gelişimi ve Ekosistem Oluşturma
- OLE teknolojisi: OYL cüzdan, Bitcoin inscription’ları için temel işlevsellik sağlar.
- SAND teknolojisi: Sanal ortamlarda dijital varlık uygulamalarına odaklanır.
- Ekosistem karşılaştırması: Her ikisi de finans teknolojisiyle dönüşen geniş dijital varlık ekosistemlerinde faaliyet gösterir.
Makroekonomik Faktörler ve Piyasa Döngüleri
- Enflasyon döneminde performans: Dijital paralar genellikle alternatif varlıklar olarak değerlendirilir.
- Makroekonomik para politikası: Merkez bankası dijital paraları (CBDC) artık merkez bankalarının %80’i tarafından araştırılıyor ve giderek önem kazanıyor.
- Jeopolitik etkiler: COVID-19, elektronik ödeme sistemlerinin benimsenmesini küresel ölçekte hızlandırdı ve nakit kullanımını azalttı.
III. 2025-2030 Fiyat Tahmini: OLE ve SAND
Kısa Vadeli Tahmin (2025)
- OLE: Muhafazakâr $0,00181892 - $0,002458 | İyimser $0,002458 - $0,0027038
- SAND: Muhafazakâr $0,132727 - $0,1981 | İyimser $0,1981 - $0,204043
Orta Vadeli Tahmin (2027)
- OLE, büyüme aşamasına geçebilir; beklenen fiyat aralığı $0,00216666555 - $0,00341324025
- SAND, istikrarlı büyüme aşamasına geçebilir; beklenen fiyat aralığı $0,2383903704 - $0,32282029325
- Temel etkenler: Kurumsal sermaye girişi, ETF gelişmeleri, ekosistem büyümesi
Uzun Vadeli Tahmin (2030)
- OLE: Temel senaryo $0,003465191992631 - $0,004470097670494 | İyimser senaryo $0,004470097670494+
- SAND: Temel senaryo $0,414543161090296 - $0,543051541028288 | İyimser senaryo $0,543051541028288+
Feragatname: Yukarıdaki tahminler, geçmiş veriler ve piyasa analizlerine dayanmaktadır. Kripto para piyasaları yüksek dalgalanma gösterir ve öngörülemez. Bu bilgiler, finansal tavsiye değildir. Yatırım kararı almadan önce her zaman kendi araştırmanızı yapınız.
OLE:
| 年份 | 预测最高价 | 预测平均价格 | 预测最低价 | 涨跌幅 |
|---|---|---|---|---|
| 2025 | 0.0027038 | 0.002458 | 0.00181892 | 0 |
| 2026 | 0.00335517 | 0.0025809 | 0.001393686 | 5 |
| 2027 | 0.00341324025 | 0.002968035 | 0.00216666555 | 21 |
| 2028 | 0.0036373268925 | 0.003190637625 | 0.00178675707 | 30 |
| 2029 | 0.003516401726512 | 0.00341398225875 | 0.002492207048887 | 39 |
| 2030 | 0.004470097670494 | 0.003465191992631 | 0.003014717033589 | 41 |
SAND:
| 年份 | 预测最高价 | 预测平均价格 | 预测最低价 | 涨跌幅 |
|---|---|---|---|---|
| 2025 | 0.204043 | 0.1981 | 0.132727 | 0 |
| 2026 | 0.295575105 | 0.2010715 | 0.13270719 | 1 |
| 2027 | 0.32282029325 | 0.2483233025 | 0.2383903704 | 25 |
| 2028 | 0.41407910691875 | 0.285571797875 | 0.2113231304275 | 44 |
| 2029 | 0.479260869783718 | 0.349825452396875 | 0.339330688824968 | 77 |
| 2030 | 0.543051541028288 | 0.414543161090296 | 0.33577996048314 | 109 |
IV. Yatırım Stratejisi Karşılaştırması: OLE ve SAND
Uzun Vadeli – Kısa Vadeli Yatırım Stratejisi
- OLE: DeFi ve borç verme protokollerine odaklanan yatırımcılar için uygundur.
- SAND: Metaverse ve oyun ekosistemleriyle ilgilenen yatırımcılar için uygundur.
Risk Yönetimi ve Varlık Dağılımı
- Temkinli yatırımcılar: OLE %20, SAND %80
- Agresif yatırımcılar: OLE %40, SAND %60
- Koruma araçları: Stablecoin tahsisi, opsiyonlar, çapraz para kombinasyonları
V. Potansiyel Risk Karşılaştırması
Piyasa Riski
- OLE: Küçük piyasa değeri ve yeni proje olması nedeniyle yüksek volatilite gösterir.
- SAND: Metaverse ve oyun sektöründeki eğilimlere duyarlıdır.
Teknik Risk
- OLE: Ölçeklenebilirlik, ağ istikrarı.
- SAND: Platform benimsemesi, akıllı sözleşme açıkları.
Mevzuat Riski
- Küresel düzenlemeler, DeFi protokolleri ve metaverse projeleri üzerinde farklı etkiler yaratabilir.
VI. Sonuç: Hangisi Daha İyi Yatırım?
📌 Yatırım Değeri Özeti:
- OLE avantajları: DeFi alanında büyüme potansiyeli ve yenilikçi borç verme protokolü.
- SAND avantajları: Yerleşik metaverse ekosistemi, büyük piyasa değeri ve likidite.
✅ Yatırım Tavsiyesi:
- Yeni yatırımcılar: Dengeli portföy için OLE’ye düşük, SAND’a yüksek oran verilebilir.
- Tecrübeli yatırımcılar: Risk toleransı ve sektör tercihlerine göre karar vermeli.
- Kurumsal yatırımcılar: Portföy hedefleri ve piyasa trendlerine göre analiz yapmalı.
⚠️ Risk Uyarısı: Kripto para piyasaları son derece dalgalıdır. Bu makale yatırım tavsiyesi değildir. None
VII. Sıkça Sorulan Sorular
S1: OLE ve SAND’in temel farkları nedir? C: OLE, DeFi ve borç verme protokollerine, SAND ise metaverse ve oyun ekosistemlerine odaklanır. OLE daha yeni ve düşük piyasa değerine sahipken, SAND yerleşik ve likiditesi yüksektir.
S2: Tarihsel olarak hangi kripto para daha iyi performans gösterdi? C: SAND, 2021’deki metaverse döneminde güçlü bir büyüme yaşadı ve $8,40 ile zirve yaptı. OLE ise yeni bir proje olarak yüksek volatilite gösterdi.
S3: OLE ve SAND’in güncel fiyat ve işlem hacmi nedir? C: 30 Ekim 2025 itibarıyla OLE’nin fiyatı $0,00245, 24 saatlik hacmi $20.923,62. SAND’in fiyatı $0,1976, hacmi ise $354.312,66’dır.
S4: OLE ve SAND için gelecek fiyat tahminleri nasıl? C: 2030’da OLE’nin temel senaryo fiyat aralığı $0,003465191992631 - $0,004470097670494; SAND’in ise $0,414543161090296 - $0,543051541028288. Her ikisi de büyüme potansiyeli taşırken, SAND’in tahmini değerleri daha yüksektir.
S5: OLE ve SAND yatırımlarında başlıca riskler nelerdir? C: OLE, küçük piyasa değeri ve yeni olmasından ötürü yüksek volatiliteye sahip; SAND ise metaverse ve oyun sektöründeki eğilimlere daha hassastır. Her iki projede ölçeklenebilirlik, akıllı sözleşme açıkları ve mevzuat riskleri mevcuttur.
S6: Yatırımcılar portföy dağılımını nasıl yapmalı? C: Temkinli yatırımcılar %20 OLE, %80 SAND; agresif yatırımcılar %40 OLE, %60 SAND’ı tercih edebilir. Nihai oranlar, kişisel risk toleransı ve yatırım hedeflerine göre belirlenmelidir.
Share
Content
Giriş: OLE ve SAND Yatırımı Karşılaştırması
I. Fiyat Geçmişi Karşılaştırması ve Mevcut Piyasa Durumu
OLE ve SAND Yatırım Değerini Etkileyen Temel Unsurlar
III. 2025-2030 Fiyat Tahmini: OLE ve SAND
IV. Yatırım Stratejisi Karşılaştırması: OLE ve SAND
V. Potansiyel Risk Karşılaştırması
VI. Sonuç: Hangisi Daha İyi Yatırım?
VII. Sıkça Sorulan Sorular
How to Buy Cryptocurrency


Trending Cryptocurrencies


Somnia (SOMI) iyi bir yatırım mı?: Bu yeni kripto paranın potansiyelini ve risklerini değerlendiriyoruz

WNXM ile MANA: Umut Vadeden İki Kripto Para Projesinin Karşılaştırmalı Analizi
DVI ve SNX: Oyun Monitörlerinde Hangi Görüntü Arayüzü Lider?

FYN ve GRT: Merkeziyetsiz finans ekosisteminde öne çıkan iki kripto para biriminin karşılaştırmalı analizi

EGLD ve MANA: Dijital Varlık Ekosisteminde İki Öne Çıkan Kripto Paranın Karşılaştırılması