MIRA vs NEAR: Comparing Two Innovative Blockchain Platforms for Decentralized Applications
Introduction: MIRA vs NEAR Investment Comparison
In the cryptocurrency market, MIRA vs NEAR comparison has always been a topic that investors cannot avoid. The two not only have significant differences in market capitalization ranking, application scenarios, and price performance, but also represent different cryptocurrency asset positioning.
MIRA (MIRA): Since its launch, it has gained market recognition for its decentralized verification network enabling truly autonomous AI.
NEAR (NEAR): Since its launch in 2020, it has been hailed as a highly scalable basic protocol for supporting DApp operations on mobile devices, and is one of the cryptocurrencies with high global trading volume and market capitalization.
This article will comprehensively analyze the investment value comparison between MIRA and NEAR focusing on historical price trends, supply mechanisms, institutional adoption, technological ecosystems, and future predictions, and attempt to answer the question that investors are most concerned about:
"Which is the better buy right now?"
I. Price History Comparison and Current Market Status
MIRA and NEAR Historical Price Trends
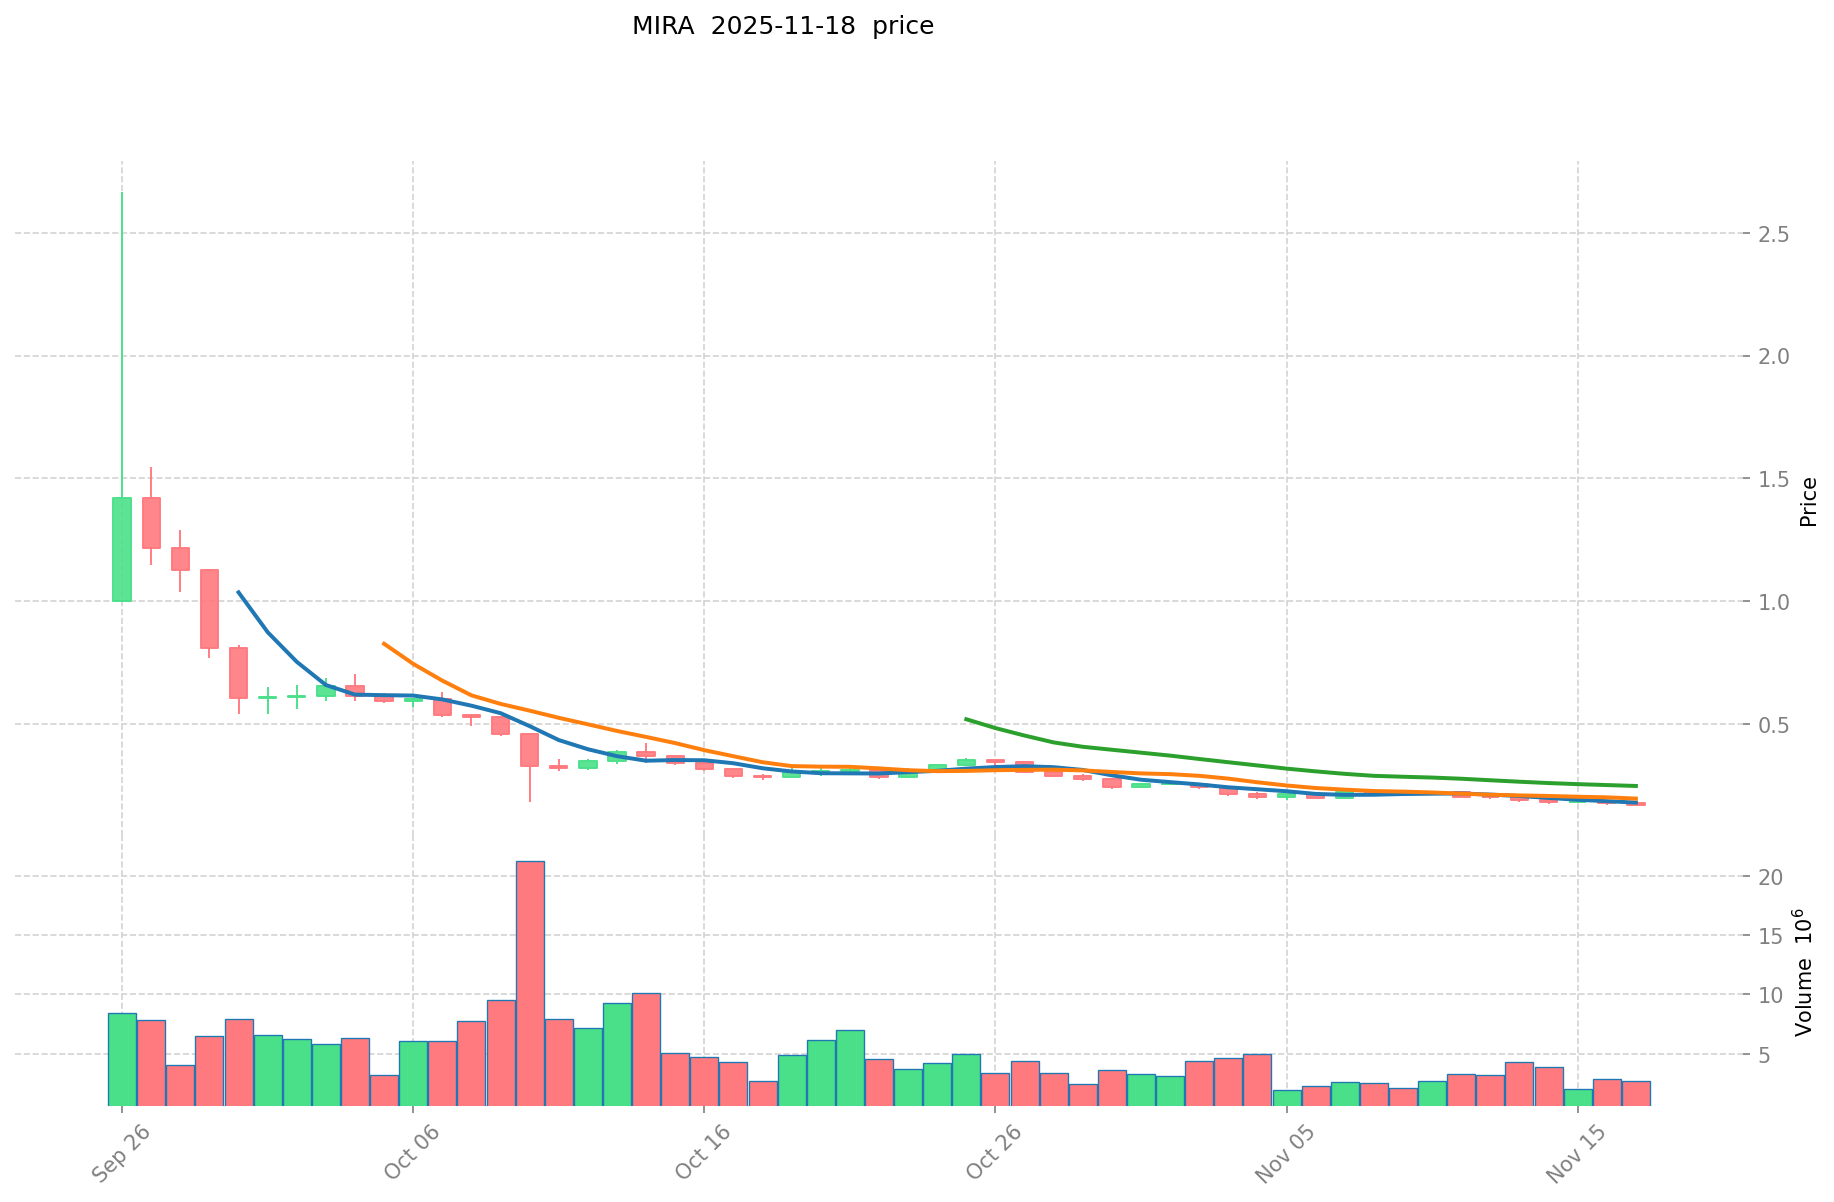
- 2025: MIRA experienced significant volatility, reaching an all-time high of $2.6662 on September 26, before declining sharply.
- 2022: NEAR reached its all-time high of $20.44 in January, followed by a prolonged downtrend.
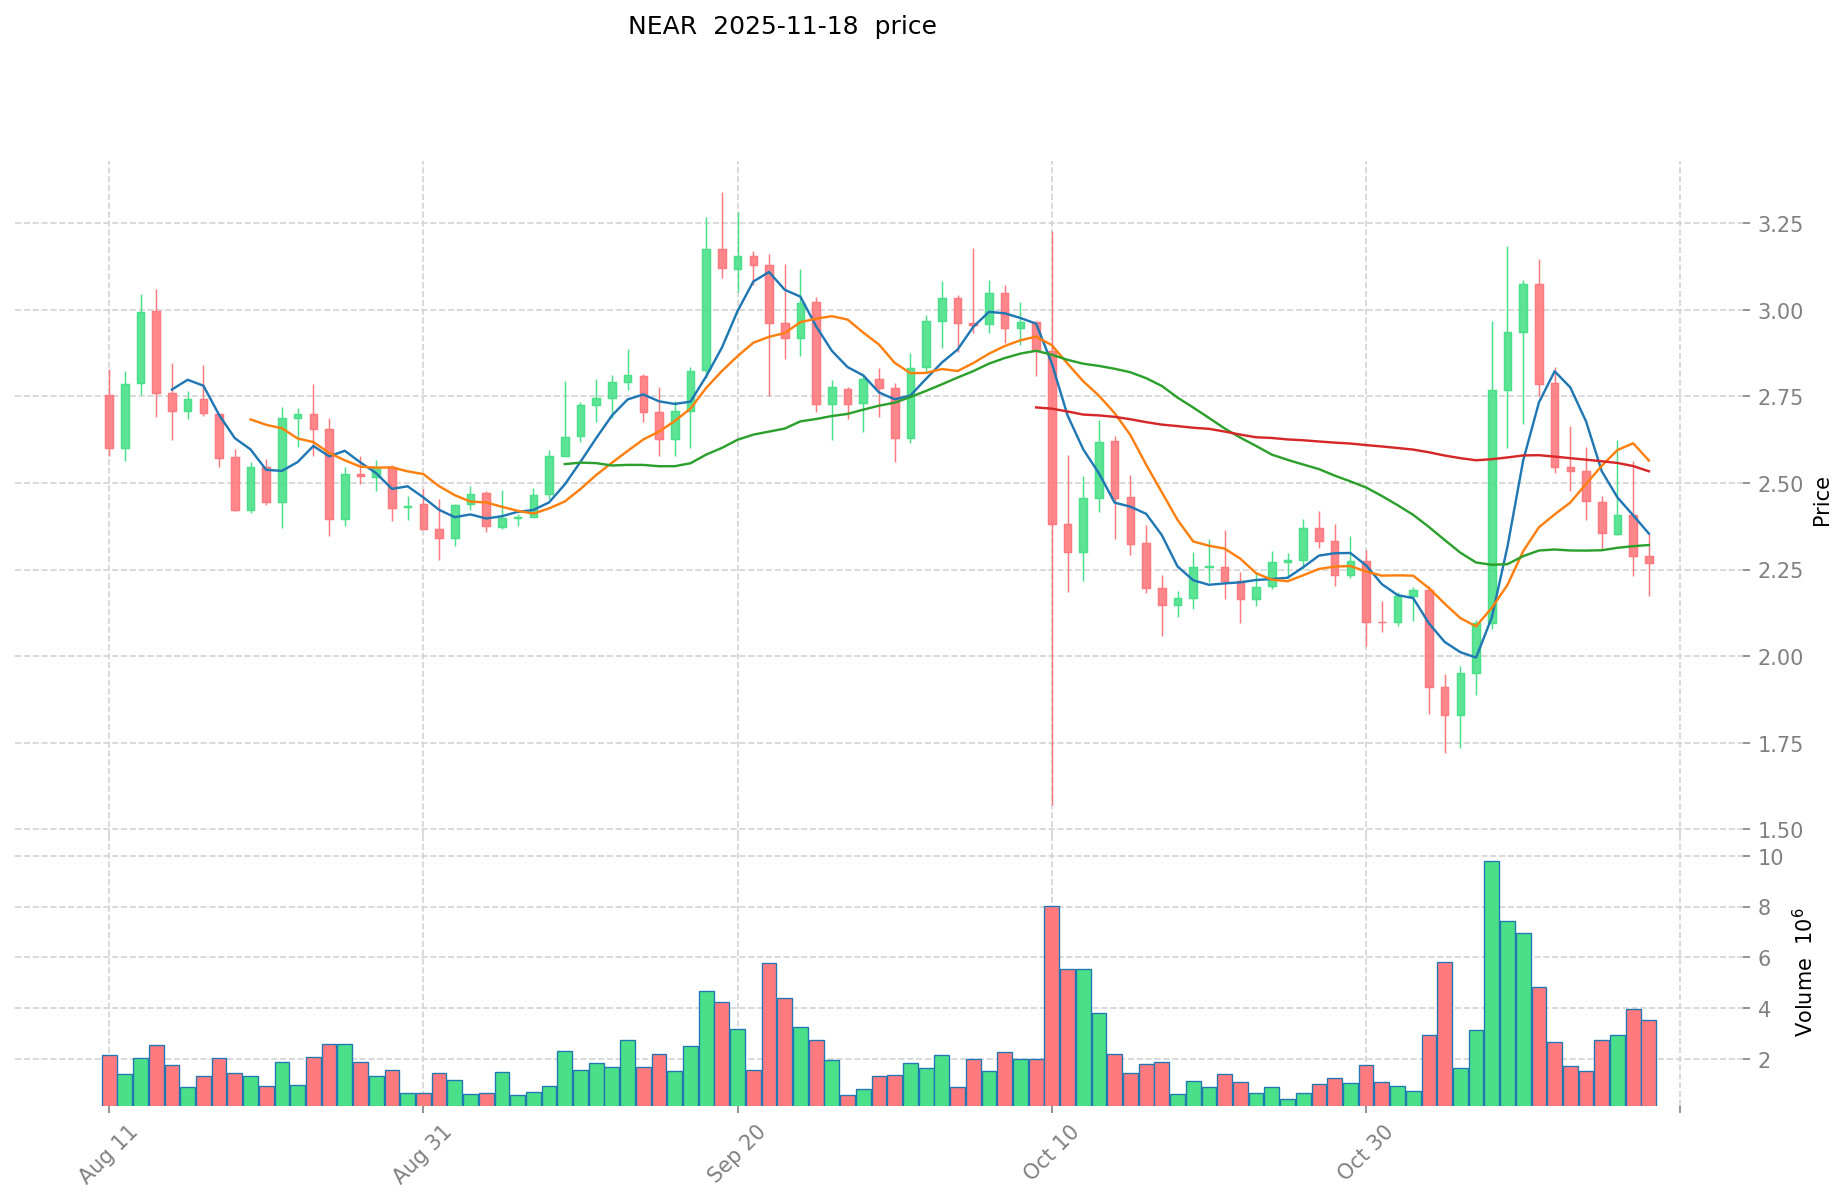
- Comparative analysis: In the current market cycle, MIRA has fallen from its peak of $2.6662 to a low of $0.1676, while NEAR has declined from its high of $20.44 to current levels around $2.21.
Current Market Situation (2025-11-18)
- MIRA current price: $0.1741
- NEAR current price: $2.213
- 24-hour trading volume: MIRA $559,724 vs NEAR $8,218,814
- Market Sentiment Index (Fear & Greed Index): 11 (Extreme Fear)
Click to view real-time prices:
- Check MIRA's current price Market Price
- Check NEAR's current price Market Price
MIRA vs NEAR Investment Value Analysis
I. MIRA Network: The Decentralized AI Verification Platform
MIRA Network represents a pioneering intersection of blockchain technology and artificial intelligence, establishing itself as a decentralized verification network designed to address one of AI's most critical challenges: trustworthiness. Launched in September 2025, MIRA aims to transform subjective AI outputs into objective, verifiable on-chain attestations.
II. Core Factors Affecting MIRA's Investment Value
Innovative Technology Architecture
- Multi-layered AI Verification: MIRA employs a unique system where multiple independent AI models analyze content to establish consensus.
- Blockchain Integration: Verified content generates cryptographic proof recorded on the Base blockchain, creating immutable, auditable verification records.
- Cross-Model Validation: AI outputs are cross-referenced with established data and other models' conclusions, significantly enhancing reliability.
Token Utility and Economic Model
- Service Payment: MIRA tokens serve as the primary medium for paying verification fees for AI-generated content.
- Incentive Mechanism: Token rewards encourage AI model owners to connect their systems to the network, creating a competitive environment where accurate models earn more.
- Flywheel Effect: As more applications utilize MIRA for trust verification, token demand increases, attracting more quality AI models to the network.
Market Applications and Industry Potential
- High-Risk Sector Focus: MIRA specifically targets industries where data accuracy is critical - finance, healthcare, and legal services.
- Growing Ecosystem: The network has already established applications like Klok and Learnrite, with user base exceeding one million.
- Trust Infrastructure: Positioning as the fundamental trust layer for the next wave of AI integration gives MIRA significant strategic value.
Development Team and Community
- Expert Background: While maintaining some anonymity (common in decentralized projects), the team demonstrates deep expertise in both AI and blockchain development.
- Community Engagement: Regular updates through official channels and transparent development processes have fostered strong community support.
- Long-Term Vision: The project shows commitment to sustainable development rather than short-term gains, aligning with successful cryptocurrency projects' strategies.
III. Market Position and Future Outlook
MIRA Network is establishing itself as a critical infrastructure component for the AI industry, particularly in sectors requiring high levels of trust and verification. Its unique approach to combining blockchain consensus mechanisms with AI validation addresses a genuine market need, potentially positioning it for significant growth as AI adoption continues to accelerate across industries.
The project's focus on building practical applications with real utility rather than speculative features suggests a sustainable development trajectory that could provide lasting investment value in the rapidly evolving intersection of AI and blockchain technologies.
III. 2025-2030 Price Prediction: MIRA vs NEAR
Short-term Prediction (2025)
- MIRA: Conservative $0.14088 - $0.1761 | Optimistic $0.1761 - $0.225408
- NEAR: Conservative $1.63228 - $2.236 | Optimistic $2.236 - $3.33164
Mid-term Prediction (2027)
- MIRA may enter a growth phase, with estimated prices ranging from $0.1656019746 to $0.2427316614
- NEAR may enter a bullish market, with estimated prices ranging from $3.145855791 to $3.729622845
- Key drivers: Institutional capital inflow, ETF, ecosystem development
Long-term Prediction (2030)
- MIRA: Base scenario $0.309925229724 - $0.37810878026328 | Optimistic scenario $0.37810878026328+
- NEAR: Base scenario $4.689102780348187 - $6.283397725666571 | Optimistic scenario $6.283397725666571+
Disclaimer: This forecast is for informational purposes only and should not be considered as financial advice. Cryptocurrency markets are highly volatile and unpredictable. Always conduct your own research before making any investment decisions.
MIRA:
| 年份 | 预测最高价 | 预测平均价格 | 预测最低价 | 涨跌幅 |
|---|---|---|---|---|
| 2025 | 0.225408 | 0.1761 | 0.14088 | 1 |
| 2026 | 0.25295004 | 0.200754 | 0.10238454 | 15 |
| 2027 | 0.2427316614 | 0.22685202 | 0.1656019746 | 30 |
| 2028 | 0.28175020884 | 0.2347918407 | 0.150266778048 | 34 |
| 2029 | 0.361579434678 | 0.25827102477 | 0.1859551378344 | 48 |
| 2030 | 0.37810878026328 | 0.309925229724 | 0.26033719296816 | 78 |
NEAR:
| 年份 | 预测最高价 | 预测平均价格 | 预测最低价 | 涨跌幅 |
|---|---|---|---|---|
| 2025 | 3.33164 | 2.236 | 1.63228 | 1 |
| 2026 | 3.7024806 | 2.78382 | 1.7816448 | 25 |
| 2027 | 3.729622845 | 3.2431503 | 3.145855791 | 46 |
| 2028 | 4.427710947075 | 3.4863865725 | 3.381794975325 | 57 |
| 2029 | 5.421156800908875 | 3.9570487597875 | 2.018094867491625 | 78 |
| 2030 | 6.283397725666571 | 4.689102780348187 | 4.360865585723814 | 111 |
IV. Investment Strategy Comparison: MIRA vs NEAR
Long-term vs Short-term Investment Strategies
- MIRA: Suitable for investors focused on AI integration and verification potential
- NEAR: Suitable for investors seeking established ecosystem and scalability
Risk Management and Asset Allocation
- Conservative investors: MIRA: 20% vs NEAR: 80%
- Aggressive investors: MIRA: 60% vs NEAR: 40%
- Hedging tools: Stablecoin allocation, options, cross-currency portfolios
V. Potential Risk Comparison
Market Risks
- MIRA: Higher volatility due to newer market entry and smaller market cap
- NEAR: Exposure to broader crypto market trends and competition from other Layer 1 platforms
Technical Risks
- MIRA: Scalability, network stability, AI model integration challenges
- NEAR: Network congestion during high demand, potential smart contract vulnerabilities
Regulatory Risks
- Global regulatory policies may impact both differently, with NEAR potentially facing more scrutiny as an established platform
VI. Conclusion: Which Is the Better Buy?
📌 Investment Value Summary:
- MIRA advantages: Unique AI verification niche, potential for rapid growth in emerging AI trust market
- NEAR advantages: Established ecosystem, proven scalability, wider adoption
✅ Investment Advice:
- New investors: Consider a small allocation to MIRA as part of a diversified portfolio, with larger exposure to NEAR
- Experienced investors: Balance between MIRA and NEAR based on risk tolerance and belief in AI verification potential
- Institutional investors: Consider NEAR for more established presence, explore MIRA for potential high-growth opportunities in AI sector
⚠️ Risk Warning: Cryptocurrency markets are highly volatile. This article does not constitute investment advice. None
VII. FAQ
Q1: What is the main difference between MIRA and NEAR? A: MIRA is a decentralized AI verification network, while NEAR is a highly scalable basic protocol for supporting DApp operations on mobile devices.
Q2: Which cryptocurrency has a higher market capitalization? A: NEAR has a significantly higher market capitalization and trading volume compared to MIRA.
Q3: What are the key factors affecting MIRA's investment value? A: MIRA's investment value is influenced by its innovative technology architecture, token utility, market applications in high-risk sectors, and the expertise of its development team.
Q4: How do the price predictions for MIRA and NEAR compare for 2030? A: By 2030, MIRA is predicted to reach $0.309925229724 - $0.37810878026328 in the base scenario, while NEAR is expected to reach $4.689102780348187 - $6.283397725666571.
Q5: What are the main risks associated with investing in MIRA and NEAR? A: MIRA faces higher volatility due to its newer market entry and smaller market cap, while NEAR is exposed to broader crypto market trends and competition from other Layer 1 platforms. Both face potential regulatory risks.
Q6: How should investors allocate their assets between MIRA and NEAR? A: Conservative investors might consider allocating 20% to MIRA and 80% to NEAR, while aggressive investors might opt for 60% MIRA and 40% NEAR. However, individual allocation should be based on personal risk tolerance and investment goals.
Q7: Which cryptocurrency is better suited for long-term investment? A: MIRA may be suitable for investors focused on AI integration and verification potential, while NEAR is more appropriate for those seeking an established ecosystem and scalability. The choice depends on individual investment strategies and risk appetite.
Share
Content
Introduction: MIRA vs NEAR Investment Comparison
I. Price History Comparison and Current Market Status
I. MIRA Network: The Decentralized AI Verification Platform
II. Core Factors Affecting MIRA's Investment Value
III. Market Position and Future Outlook
III. 2025-2030 Price Prediction: MIRA vs NEAR
IV. Investment Strategy Comparison: MIRA vs NEAR
V. Potential Risk Comparison
VI. Conclusion: Which Is the Better Buy?
VII. FAQ

