MASA vs KAVA: Comparing Two Innovative Blockchain Platforms for Decentralized Applications
Introduction: Investment Comparison of MASA vs KAVA
In the cryptocurrency market, the comparison between MASA vs KAVA has always been a topic that investors cannot avoid. The two not only have significant differences in market cap ranking, application scenarios, and price performance, but also represent different crypto asset positioning.
MASA (MASA): Since its launch, it has gained market recognition for its decentralized AI data and LLM network capabilities.
KAVA (KAVA): Launched in 2019, it has been hailed as a cross-chain decentralized financial platform, providing mortgage and stable currency services for mainstream digital assets.
This article will comprehensively analyze the investment value comparison between MASA vs KAVA, focusing on historical price trends, supply mechanisms, institutional adoption, technological ecosystems, and future predictions, and attempt to answer the question most concerned by investors:
"Which is the better buy right now?"
I. Price History Comparison and Current Market Status
MASA and KAVA Historical Price Trends
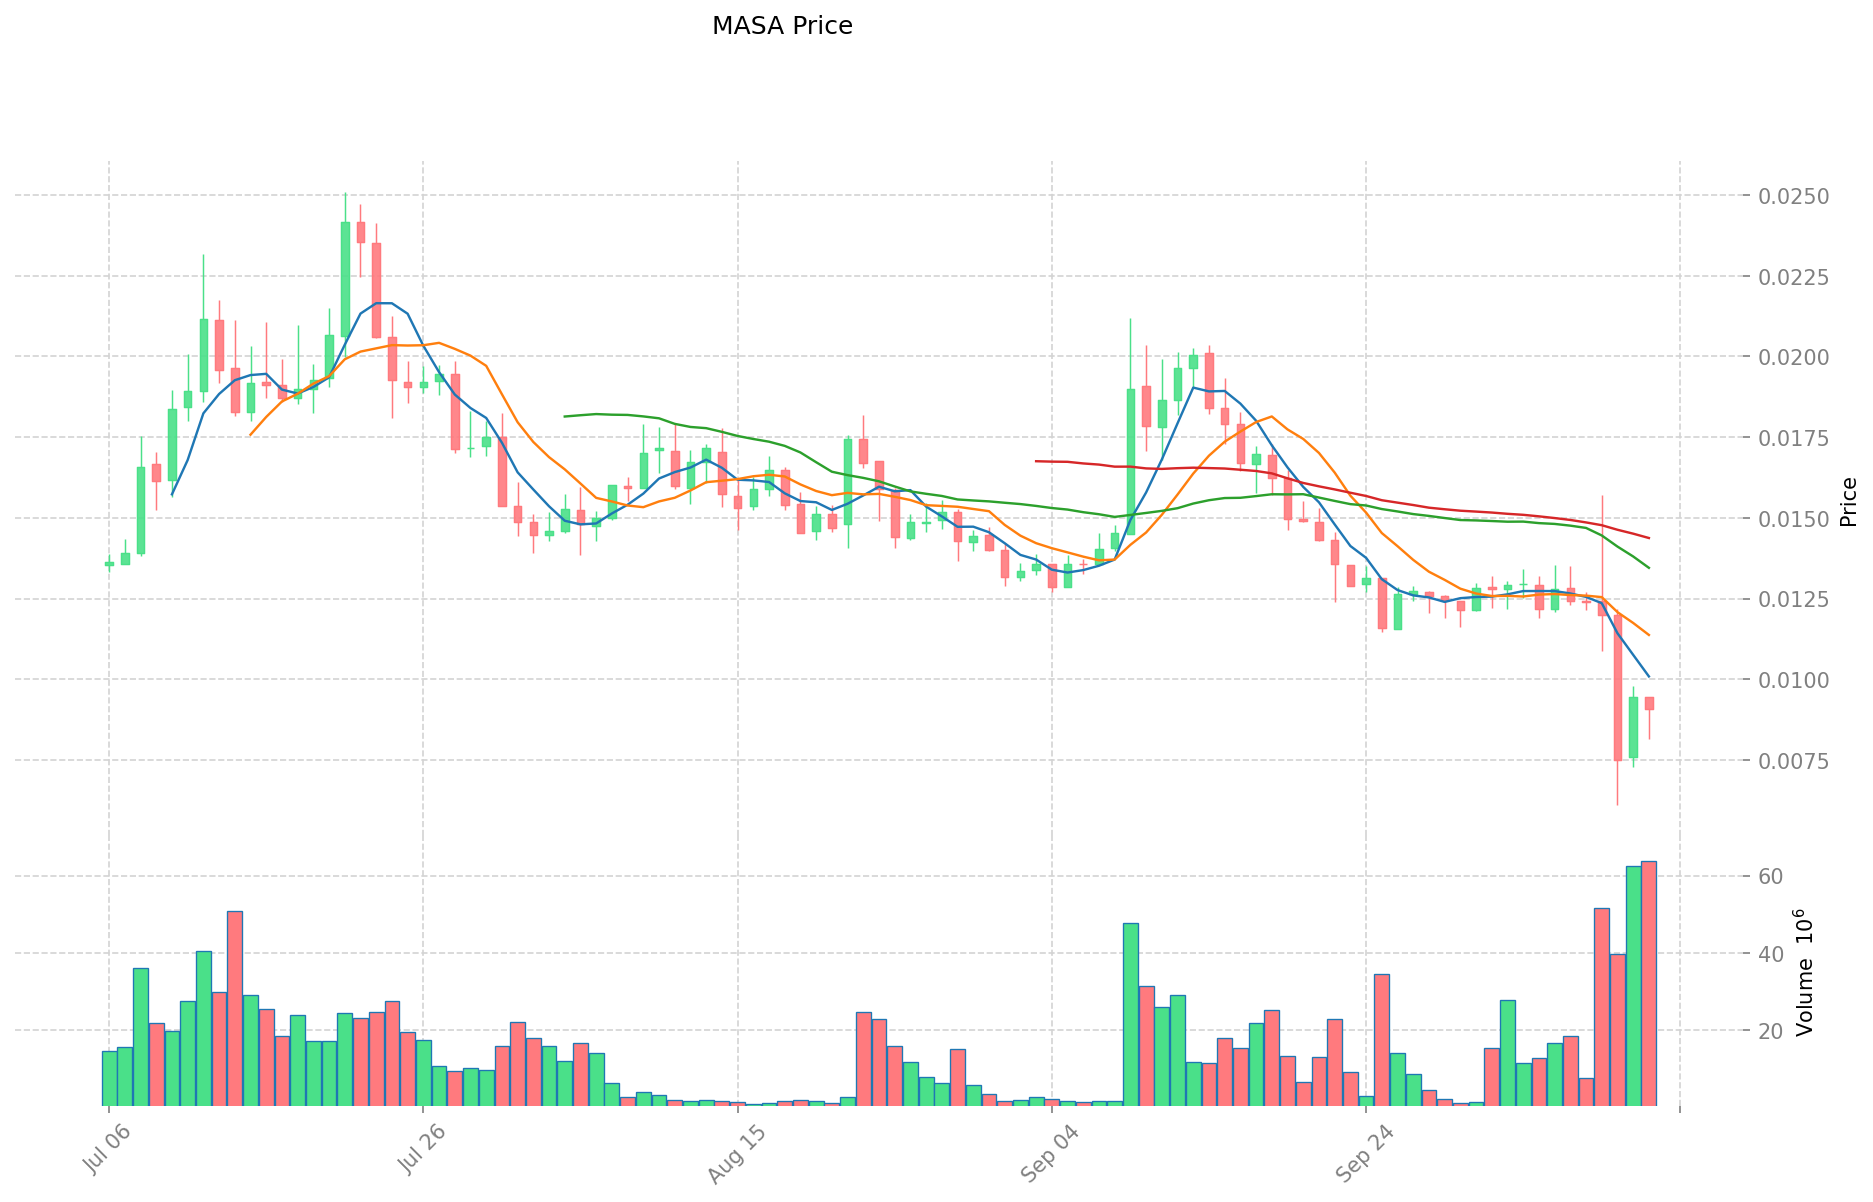
- 2024: MASA reached an all-time high of $1.7 on April 11, 2024.
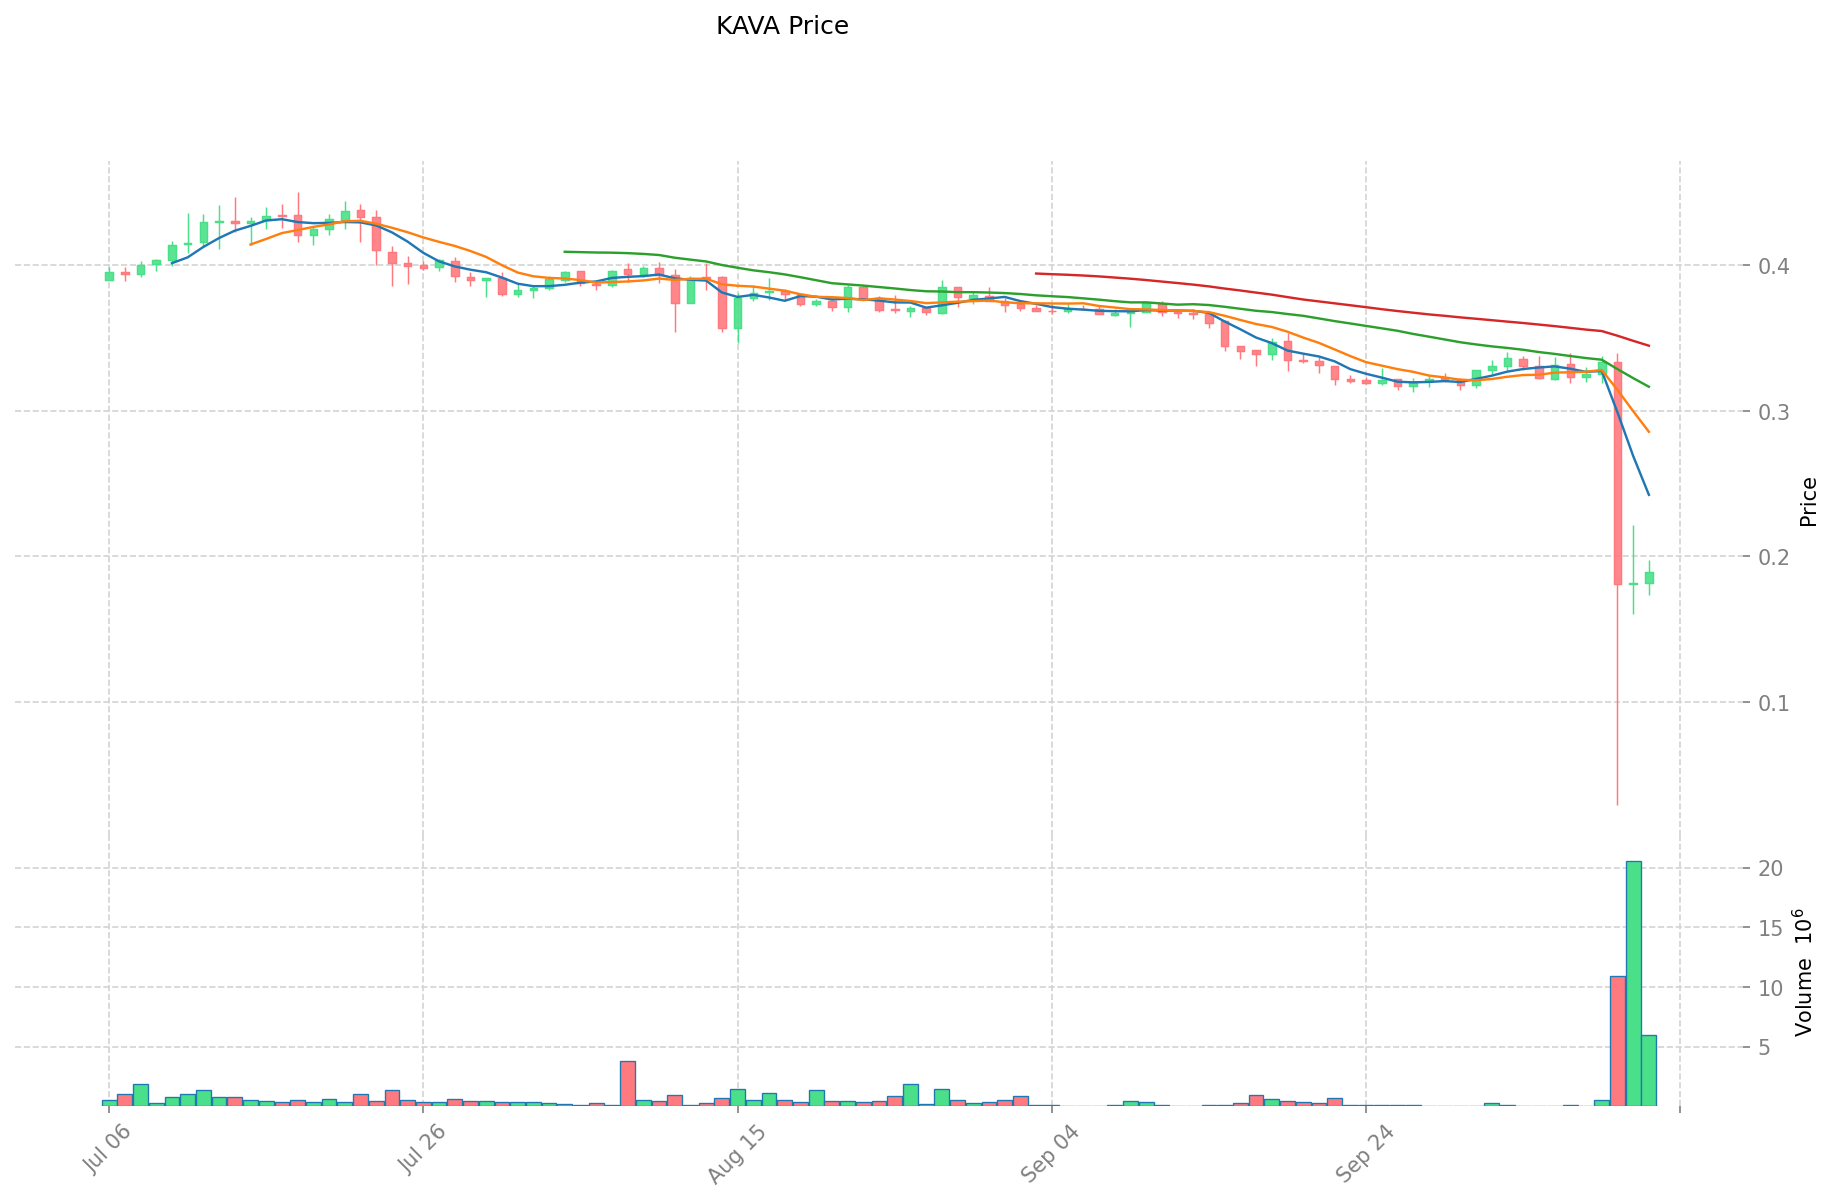
- 2025: KAVA hit a record low of $0.138058 on October 11, 2025.
- Comparative analysis: In the current market cycle, MASA has fallen from its peak of $1.7 to a low of $0.006094, while KAVA has dropped from its all-time high of $9.12 to its current price.
Current Market Situation (2025-10-13)
- MASA current price: $0.009728
- KAVA current price: $0.19
- 24-hour trading volume: $578,856 (MASA) vs $1,083,141 (KAVA)
- Market Sentiment Index (Fear & Greed Index): 38 (Fear)
Click to view real-time prices:
- View MASA current price Market Price
- View KAVA current price Market Price
II. Core Factors Influencing MASA vs KAVA Investment Value
Supply Mechanism Comparison (Tokenomics)
- KAVA: Zero inflation policy is one of its core advantages for long-term potential
Institutional Adoption and Market Applications
- Enterprise Adoption: KAVA positions itself pragmatically in cross-chain and financial infrastructure rather than competing directly with Ethereum or Solana on TPS
Technical Development and Ecosystem Building
- KAVA Technical Development: Hybrid architecture enabling low-risk optimized returns
- Ecosystem Comparison: KAVA serves as an ecosystem pillar rather than just an investment asset, with staking options providing annual returns
Macroeconomic and Market Cycles
- KAVA's strategic positioning in cross-chain capabilities and financial infrastructure provides its market differentiation
III. 2025-2030 Price Prediction: MASA vs KAVA
Short-term Prediction (2025)
- MASA: Conservative $0.00530 - $0.00982 | Optimistic $0.00982 - $0.01404
- KAVA: Conservative $0.13622 - $0.18920 | Optimistic $0.18920 - $0.23839
Mid-term Prediction (2027)
- MASA may enter a growth phase, with estimated prices ranging from $0.01350 to $0.01893
- KAVA may enter a steady growth phase, with estimated prices ranging from $0.20645 to $0.26212
- Key drivers: Institutional capital inflow, ETF, ecosystem development
Long-term Prediction (2030)
- MASA: Base scenario $0.01431 - $0.02104 | Optimistic scenario $0.02104 - $0.02525
- KAVA: Base scenario $0.25270 - $0.31988 | Optimistic scenario $0.31988 - $0.39025
Disclaimer
MASA:
| 年份 | 预测最高价 | 预测平均价格 | 预测最低价 | 涨跌幅 |
|---|---|---|---|---|
| 2025 | 0.01404117 | 0.009819 | 0.00530226 | 0 |
| 2026 | 0.0174179241 | 0.011930085 | 0.00727735185 | 22 |
| 2027 | 0.0189294658695 | 0.01467400455 | 0.013500084186 | 50 |
| 2028 | 0.019321995491212 | 0.01680173520975 | 0.009072937013265 | 72 |
| 2029 | 0.02402228091614 | 0.018061865350481 | 0.013727017666365 | 85 |
| 2030 | 0.025250487759972 | 0.02104207313331 | 0.014308609730651 | 116 |
KAVA:
| 年份 | 预测最高价 | 预测平均价格 | 预测最低价 | 涨跌幅 |
|---|---|---|---|---|
| 2025 | 0.238392 | 0.1892 | 0.136224 | 0 |
| 2026 | 0.25014132 | 0.213796 | 0.11331188 | 12 |
| 2027 | 0.2621245858 | 0.23196866 | 0.2064521074 | 21 |
| 2028 | 0.368099468121 | 0.2470466229 | 0.190225899633 | 29 |
| 2029 | 0.33217888915134 | 0.3075730455105 | 0.17839236639609 | 61 |
| 2030 | 0.390248680143722 | 0.31987596733092 | 0.252702014191426 | 68 |
IV. Investment Strategy Comparison: MASA vs KAVA
Long-term vs Short-term Investment Strategy
- MASA: Suitable for investors focused on AI and data network potential
- KAVA: Suitable for investors seeking cross-chain DeFi exposure
Risk Management and Asset Allocation
- Conservative investors: MASA: 30% vs KAVA: 70%
- Aggressive investors: MASA: 60% vs KAVA: 40%
- Hedging tools: Stablecoin allocation, options, cross-currency portfolio
V. Potential Risk Comparison
Market Risk
- MASA: Volatility due to emerging technology sector
- KAVA: Dependent on overall DeFi market performance
Technical Risk
- MASA: Scalability, network stability
- KAVA: Cross-chain interoperability challenges, smart contract vulnerabilities
Regulatory Risk
- Global regulatory policies may impact both differently, with DeFi platforms like KAVA potentially facing more scrutiny
VI. Conclusion: Which Is the Better Buy?
📌 Investment Value Summary:
- MASA advantages: Potential in AI and data network market
- KAVA advantages: Established cross-chain DeFi platform with staking options
✅ Investment Advice:
- New investors: Consider a balanced approach, leaning towards KAVA for its more established ecosystem
- Experienced investors: Explore a mix of both, with higher allocation to MASA for potential growth
- Institutional investors: Focus on KAVA for its DeFi infrastructure play, while keeping an eye on MASA's long-term potential
⚠️ Risk Warning: Cryptocurrency markets are highly volatile. This article does not constitute investment advice. None
VII. FAQ
Q1: What are the main differences between MASA and KAVA? A: MASA is focused on decentralized AI data and LLM network capabilities, while KAVA is a cross-chain decentralized financial platform providing mortgage and stable currency services for mainstream digital assets.
Q2: Which cryptocurrency has shown better price performance recently? A: Based on the information provided, MASA reached an all-time high of $1.7 in April 2024, while KAVA hit a record low of $0.138058 in October 2025. However, both have experienced significant price drops from their peaks.
Q3: What are the current prices of MASA and KAVA? A: As of October 13, 2025, MASA's current price is $0.009728, while KAVA's current price is $0.19.
Q4: What are the key factors influencing the investment value of MASA and KAVA? A: Key factors include supply mechanisms, institutional adoption, technical development, ecosystem building, and macroeconomic conditions. KAVA, for instance, has a zero inflation policy and focuses on cross-chain and financial infrastructure.
Q5: What are the long-term price predictions for MASA and KAVA? A: By 2030, the base scenario for MASA is predicted to be $0.01431 - $0.02104, while for KAVA it's $0.25270 - $0.31988. In optimistic scenarios, MASA could reach $0.02104 - $0.02525, and KAVA could reach $0.31988 - $0.39025.
Q6: How should investors approach asset allocation between MASA and KAVA? A: Conservative investors might consider allocating 30% to MASA and 70% to KAVA, while aggressive investors might opt for 60% MASA and 40% KAVA. The exact allocation should depend on individual risk tolerance and investment goals.
Q7: What are the potential risks associated with investing in MASA and KAVA? A: Both face market risks related to cryptocurrency volatility. MASA may face technical risks related to scalability and network stability, while KAVA might encounter challenges with cross-chain interoperability and smart contract vulnerabilities. Regulatory risks are also a factor, particularly for DeFi platforms like KAVA.
Share
Content