LL vs LTC: Uzun Vadede Hangi Kriptopara Daha Fazla Potansiyel Sunuyor?

Giriş: LL ve LTC Yatırımı Karşılaştırması
Kripto para piyasasında LightLink (LL) ile Litecoin (LTC) arasındaki karşılaştırma, yatırımcıların gündeminden düşmeyen bir başlıktır. İki varlık, yalnızca piyasa değeri sıralaması, kullanım alanları ve fiyat performansı açısından değil, kripto varlık dünyasındaki konumlandırmalarıyla da birbirinden ayrılır.
LightLink (LL): 2017’de piyasaya çıkan LL, Ethereum Layer 2 üzerinde dApp’ler ve kurumsal yapılar için anlık ve işlem ücreti olmayan transferlere odaklanarak piyasa tarafından kabul görmüştür.
Litecoin (LTC): 2011’de tanıtılan LTC, “Bitcoin’in altınına karşılık gümüş” olarak bilinir ve en yüksek küresel işlem hacmine ve piyasa değerine sahip kripto paralardan biridir.
Bu makalede, LL ve LTC arasındaki yatırım değerinin kapsamlı bir analizi sunulacak; tarihsel fiyat eğilimleri, arz mekanizmaları, kurumsal benimseme, teknolojik ekosistemler ve geleceğe yönelik öngörüler odağında yanıt aranacak ana soru şudur:
“Şu anda hangisi daha iyi bir yatırım fırsatı sunuyor?”
I. Fiyat Geçmişi ve Güncel Piyasa Durumu Karşılaştırması
LightLink (LL) ve Litecoin (LTC) Tarihsel Fiyat Eğilimleri
- 2024: LL, 24 Nisan 2024’te $0,3 ile tüm zamanların en yüksek seviyesine ulaştı.
- 2021: LTC, 10 Mayıs 2021’de boğa piyasasında $410,26 ile zirve yaptı.
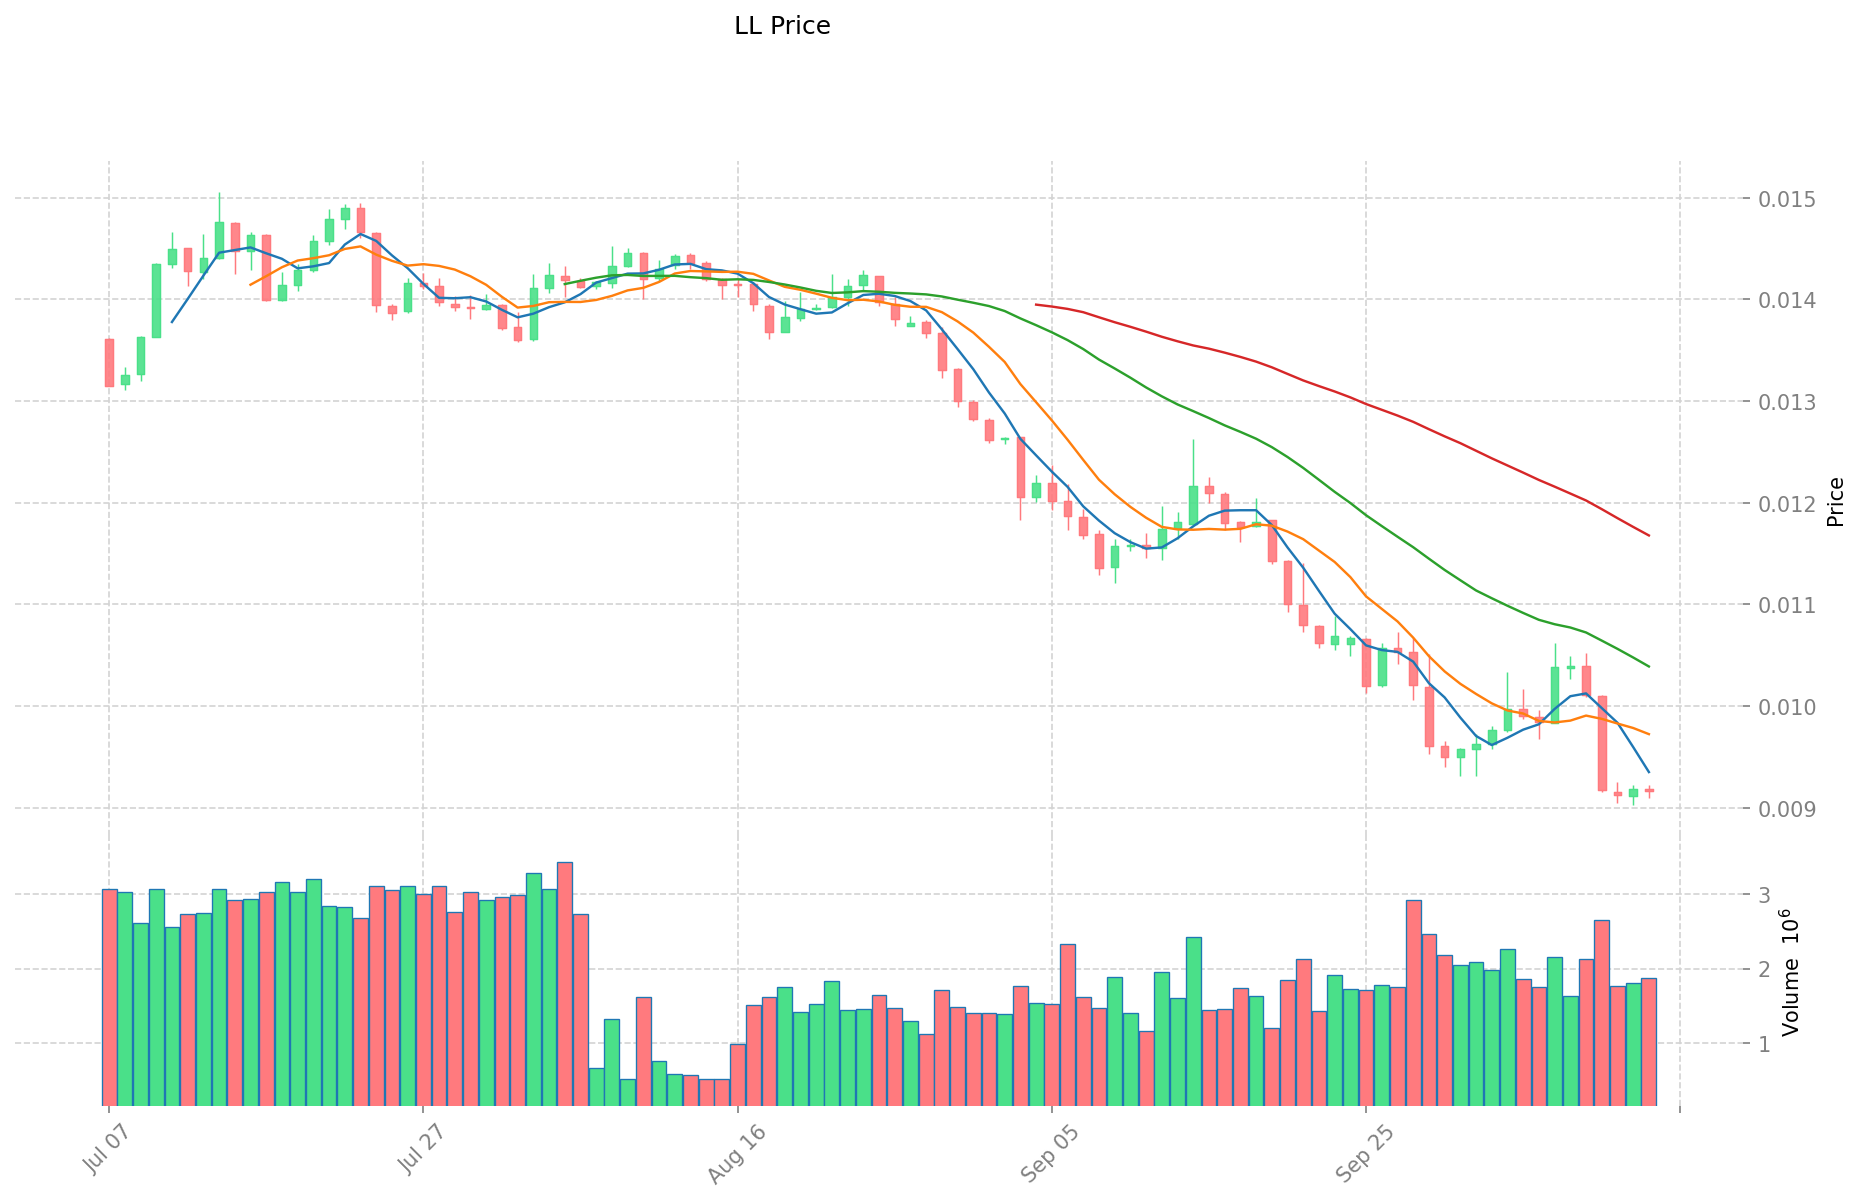
- Karşılaştırmalı analiz: Son döngüde LL, $0,3’ten $0,009022 seviyesine kadar düşerken, LTC daha istikrarlı bir performans gösterdi ve şu anda $99,27’den işlem görüyor.
Güncel Piyasa Durumu (14 Ekim 2025)
- LL güncel fiyat: $0,009158
- LTC güncel fiyat: $99,27
- 24 saatlik işlem hacmi: LL $17.047,47 — LTC $17.751.143,96
- Piyasa Duyarlılık Endeksi (Korku & Açgözlülük Endeksi): 38 (Korku)
Canlı fiyatları görmek için tıklayın:
- LL güncel fiyatı: Piyasa Fiyatı
- LTC güncel fiyatı: Piyasa Fiyatı

II. LL ve LTC Yatırımlarının Değerini Etkileyen Temel Faktörler
Arz Mekanizması Karşılaştırması (Tokenomik)
- Litecoin (LTC): Bitcoin’e benzer biçimde yaklaşık dört yılda bir blok ödüllerinin yarıya indiği halving mekanizmasına sahip. Maksimum arzı 84 milyon coin ile sınırlandırılmıştır.
- Litentry (LL): Maksimum arzı 100 milyon token ile sınırlandırılmış, deflasyonist bir model sunar.
- 📌 Tarihsel Örüntü: LTC gibi sınırlı arzlı coin’ler genellikle halving dönemlerinde fiyat artışına sahne olurken; LL gibi daha yeni token’larda benimseme oranı ve ağ gelişimi volatiliteyi belirler.
Kurumsal Benimseme ve Piyasa Uygulamaları
- Kurumsal Portföyler: LTC, Grayscale’in Dijital Büyük Piyasa Değeri Fonu ve çeşitli ETP’lere dahil edilerek daha fazla kurumsal ilgi görürken, LL daha geniş kurumsal benimseme aşamasındadır.
- Kurumsal Kullanım: LTC, ödeme sistemleri ve sınır ötesi işlemlerde düşük komisyon avantajı sunarken; LL, Web3 ekosisteminde kimlik yönetimine odaklanıyor.
- Düzenleyici Durum: LTC, en eski altcoin’lerden biri olarak çoğu ülkede düzenleyici netliğe sahipken; LL, kimlik yönetimi alanında yardımcı token olması nedeniyle farklı regülasyonlarla karşılaşabiliyor.
Teknolojik Gelişim ve Ekosistem Oluşumu
- Litecoin Teknik Yükseltmeleri: Gizlilik ve ölçeklenebilirlik için MWEB (Mimblewimble Extension Block) uygulanıyor; Bitcoin’in teknik yol haritasıyla uyum sürüyor.
- Litentry Teknik Gelişimi: Çoklu blokzincirlerle iş birliğiyle çapraz zincir kimlik konsolidasyonu teknolojisi geliştiriliyor; merkeziyetsiz kimlik doğrulama çözümleri üzerinde çalışılıyor.
- Ekosistem Karşılaştırması: LTC, yaygın ödeme altyapısı ve Lightning Network uyumluluğu ile öne çıkarken; LL, DeFi kimlik çözümleri, kredi skoru ve itibar sistemlerinde uzmanlaşıyor.
Makroekonomik Faktörler ve Piyasa Döngüleri
- Enflasyon Dönemindeki Performans: LTC, Bitcoin’e olan korelasyonu nedeniyle enflasyona karşı koruma potansiyeli gösterirken; LL’nin enflasyon direnci, büyük ekonomik döngülerde henüz test edilmedi.
- Para Politikası Etkisi: Her iki token da Fed kararları ve faiz değişimlerine duyarlı. LTC, geleneksel piyasalarla daha güçlü korelasyon sergiler.
- Jeopolitik Faktörler: LTC, yaygın erişimi sayesinde sınır ötesi ödeme kısıtlamaları döneminde avantaj sağlarken; LL, gizlilik ve kimlik çözümlerine talebin arttığı durumlarda öne çıkabilir.
III. 2025-2030 Fiyat Tahmini: LL ve LTC
Kısa Vadeli Tahmin (2025)
- LL: Muhafazakâr $0,00485639 - $0,009163 | İyimser $0,009163 - $0,01026256
- LTC: Muhafazakâr $88,7597 - $99,73 | İyimser $99,73 - $135,6328
Orta Vadeli Tahmin (2027)
- LL, büyüme aşamasına girebilir; tahmini fiyat aralığı $0,009439365243 - $0,012484321773
- LTC, boğa piyasası yaşayabilir; tahmini fiyat aralığı $124,76582028 - $195,86892216
- Başlıca faktörler: Kurumsal sermaye girişi, ETF, ekosistem gelişimi
Uzun Vadeli Tahmin (2030)
- LL: Temel senaryo $0,014948742115772 - $0,018685927644716 | İyimser senaryo $0,018685927644716+
- LTC: Temel senaryo $212,24778999165 - $267,432215389479 | İyimser senaryo $267,432215389479+
Feragatname
LL:
| Yıl | Tahmini En Yüksek Fiyat | Tahmini Ortalama Fiyat | Tahmini En Düşük Fiyat | Değişim (%) |
|---|---|---|---|---|
| 2025 | 0,01026256 | 0,009163 | 0,00485639 | 0 |
| 2026 | 0,0105869302 | 0,00971278 | 0,0052449012 | 6 |
| 2027 | 0,012484321773 | 0,0101498551 | 0,009439365243 | 10 |
| 2028 | 0,01380684789253 | 0,0113170884365 | 0,01086440489904 | 23 |
| 2029 | 0,01733551606703 | 0,012561968164515 | 0,007914039943644 | 37 |
| 2030 | 0,018685927644716 | 0,014948742115772 | 0,008969245269463 | 63 |
LTC:
| Yıl | Tahmini En Yüksek Fiyat | Tahmini Ortalama Fiyat | Tahmini En Düşük Fiyat | Değişim (%) |
|---|---|---|---|---|
| 2025 | 135,6328 | 99,73 | 88,7597 | 0 |
| 2026 | 150,632192 | 117,6814 | 96,498748 | 18 |
| 2027 | 195,86892216 | 134,156796 | 124,76582028 | 34 |
| 2028 | 181,514144988 | 165,01285908 | 153,4619589444 | 65 |
| 2029 | 251,2320779493 | 173,263502034 | 102,22546620006 | 74 |
| 2030 | 267,432215389479 | 212,24778999165 | 118,858762395324 | 113 |
IV. Yatırım Stratejisi Karşılaştırması: LL ve LTC
Uzun Vadeli ve Kısa Vadeli Yatırım Stratejisi
- LL: Ekosistem potansiyeli ve kimlik yönetimi uygulamalarına odaklanan yatırımcılar için uygundur
- LTC: İstikrar ve enflasyondan korunma arayan yatırımcılar için uygundur
Risk Yönetimi ve Varlık Dağılımı
- Temkinli yatırımcılar: LL %10, LTC %90
- Agresif yatırımcılar: LL %30, LTC %70
- Koruma araçları: Stablecoin tahsisi, opsiyonlar, döviz çeşitlendirilmiş portföy
V. Potansiyel Risk Karşılaştırması
Piyasa Riski
- LL: Düşük piyasa değeri ve işlem hacmi nedeniyle yüksek volatiliteye sahip
- LTC: Geniş kripto para piyasası eğilimleri ve Bitcoin fiyat hareketlerinden etkilenebilir
Teknik Risk
- LL: Ölçeklenebilirlik ve ağ istikrarı riskleri mevcut
- LTC: Madenciliğin merkezileşmesi ve olası güvenlik açıkları
Düzenleyici Risk
- Küresel regülasyonlar, her iki varlık üzerinde farklı etkiler yaratabilir
VI. Sonuç: Hangisi Daha İyi Bir Yatırım?
📌 Yatırım Değeri Özeti:
- LL’nin avantajları: Web3’te kimlik yönetimine odaklanması, DeFi uygulamalarında büyüme potansiyeli
- LTC’nin avantajları: Yerleşik geçmiş, geniş kabul ve “dijital gümüş” olarak ün
✅ Yatırım Tavsiyesi:
- Yeni yatırımcılar: Daha fazla istikrar için LTC’ye ağırlık verebilir
- Deneyimli yatırımcılar: Risk profiline göre LL ve LTC’yi dengeli dağıtabilir
- Kurumsal yatırımcılar: Geniş piyasa için LTC, Web3 kimlik çözümleri için LL
⚠️ Risk Uyarısı: Kripto para piyasalarında yüksek oynaklık bulunmaktadır. Bu makale yatırım tavsiyesi değildir. None
VII. SSS
S1: LightLink (LL) ile Litecoin (LTC) arasındaki temel farklar nelerdir? C: LightLink, Ethereum Layer 2 üzerinde dApp’ler ve kurumsal şirketler için anlık, işlem ücreti olmayan transferlere odaklanırken; Litecoin, genellikle “Bitcoin’in altınına karşılık gümüş” olarak anılır ve en yüksek küresel işlem hacmi ile piyasa değerine sahip kripto paralardan biridir.
S2: LL ve LTC’nin arz mekanizmaları nasıl karşılaştırılır? C: Litecoin’in maksimum arzı 84 milyon coin olup, Bitcoin’e benzer bir halving mekanizmasına sahiptir. LightLink’in maksimum arzı ise 100 milyon token ile sınırlanmış ve deflasyonist yapıdadır.
S3: Hangi kripto para daha yüksek fiyat istikrarı göstermiştir? C: Litecoin (LTC), LightLink’e (LL) göre daha istikrarlı bir fiyat performansı sergilemiştir. Son piyasa döngüsünde LL $0,3’ten $0,009022’ye gerilerken, LTC yaklaşık $99,27 seviyelerinde istikrarlı seyretmiştir.
S4: Kurumsal benimseme LL ve LTC arasında nasıl farklılık gösteriyor? C: LTC, Grayscale’in Dijital Büyük Piyasa Değeri Fonu ve çeşitli ETP’ler aracılığıyla daha fazla kurumsal ilgi görürken, LL hâlâ daha geniş kurumsal benimseme arayışındadır.
S5: LL ve LTC’nin yatırım değerini etkileyen başlıca faktörler nelerdir? C: Arz mekanizmaları, kurumsal benimseme, piyasa uygulamaları, teknolojik gelişim, ekosistem inşası ve enflasyon ile para politikası gibi makroekonomik faktörler öne çıkar.
S6: LL ve LTC’nin uzun vadeli fiyat tahminleri nasıl karşılaştırılır? C: 2030 itibarıyla LL’nin temel senaryo fiyat aralığı $0,014948742115772 - $0,018685927644716, LTC’nin ise $212,24778999165 - $267,432215389479’dur.
S7: LL ve LTC yatırımlarında başlıca hangi riskler bulunuyor? C: LL için başlıca riskler; düşük piyasa değeri ve işlem hacmine bağlı yüksek volatilite, ölçeklenebilirlik ve ağ istikrarı sorunlarıdır. LTC için ise piyasa eğilimlerine duyarlılık, madencilikte merkezileşme ve olası güvenlik açıkları öne çıkar.
S8: Yatırımcılar LL ile LTC arasında portföylerini nasıl dağıtmalı? C: Temkinli yatırımcılar %10 LL ve %90 LTC, daha agresif yatırımcılar %30 LL ve %70 LTC ayırabilir. Nihai dağılım, bireysel risk toleransı ve yatırım hedeflerine göre belirlenmelidir.
Share
Content
Giriş: LL ve LTC Yatırımı Karşılaştırması
I. Fiyat Geçmişi ve Güncel Piyasa Durumu Karşılaştırması
II. LL ve LTC Yatırımlarının Değerini Etkileyen Temel Faktörler
III. 2025-2030 Fiyat Tahmini: LL ve LTC
IV. Yatırım Stratejisi Karşılaştırması: LL ve LTC
V. Potansiyel Risk Karşılaştırması
VI. Sonuç: Hangisi Daha İyi Bir Yatırım?
VII. SSS
How to Buy Cryptocurrency


Trending Cryptocurrencies


AQT ve ETC: Kuantum ile Klasik Hesaplama Yaklaşımlarının Karşılaştırmalı Analizi

2025 yılında Polkadot (DOT) için mevcut piyasa görünümü nedir?

Poly Kripto Fiyat Tahmini 2025: Yükselecek mi Yoksa Düşecek mi?
NFP ve HBAR: Tarım Dışı İstihdam Raporları ile Hedera Hashgraph'ın piyasa üzerindeki temel etkilerinin karşılaştırmalı analizi
Hedera (HBAR) iyi bir yatırım mı?: Bu dağıtık defter teknolojisinin potansiyeli üzerine bir analiz

COS vs DOT: Sponsorluk Sertifikası ile Ulaştırma Bakanlığı Uyumluluğu Arasındaki Temel Farkları Anlamak

Dropee Günlük Kombinasyonu 11 Aralık 2025
Tomarket Günlük Kombinasyonu 11 Aralık 2025

Merkeziyetsiz Finans'ta Geçici Kayıp Nedir?

Kripto Parada Çifte Harcama: Önleme Stratejileri

Kripto Ticaretinde Wyckoff Yönteminin Anlaşılması