LIKE vs FLOW: Sosyal Medya Pazarlamasında Gerçek Etkileşimin Gücünü Açığa Çıkarıyoruz


Giriş: LIKE ve FLOW Yatırımı Karşılaştırması
Kripto para piyasasında LIKE ile FLOW’un karşılaştırılması, yatırımcılar için sürekli gündemde olan bir başlıktır. Bu iki varlık, hem piyasa değeri sıralaması, uygulama alanları ve fiyat performansı açısından belirgin şekilde ayrışıyor hem de kripto varlıklarının konumlandırılması bakımından farklılıklara sahiptir.
LIKE (LIKE): 2021’de piyasaya çıkan LIKE, NFT’lerle üretici ekonomisini birleştiren yenilikçi sosyal medya platformu sayesinde piyasada tanınırlık kazanmıştır.
FLOW (FLOW): 2020 yılında tanıtılan FLOW, yeni nesil oyunlar ve dijital varlıklar için platform olarak öne çıkmış; küresel ölçekte yüksek işlem hacmi ve piyasa değeriyle kripto para piyasasında önemli bir konuma ulaşmıştır.
Bu makalede, LIKE ile FLOW’un yatırım değerleri kapsamlı biçimde analiz edilecek; tarihsel fiyat trendleri, arz mekanizmaları, kurumsal benimsenme, teknolojik ekosistem ve gelecek öngörüleri üzerinden karşılaştırma sunulacaktır. Böylece yatırımcıların en çok sorduğu şu soruya yanıt aranacaktır:
"Şu anda hangisi daha mantıklı bir alım?"
I. Fiyat Geçmişi Karşılaştırması ve Güncel Piyasa Durumu
LIKE (Coin A) ve FLOW (Coin B) Tarihsel Fiyat Eğilimleri
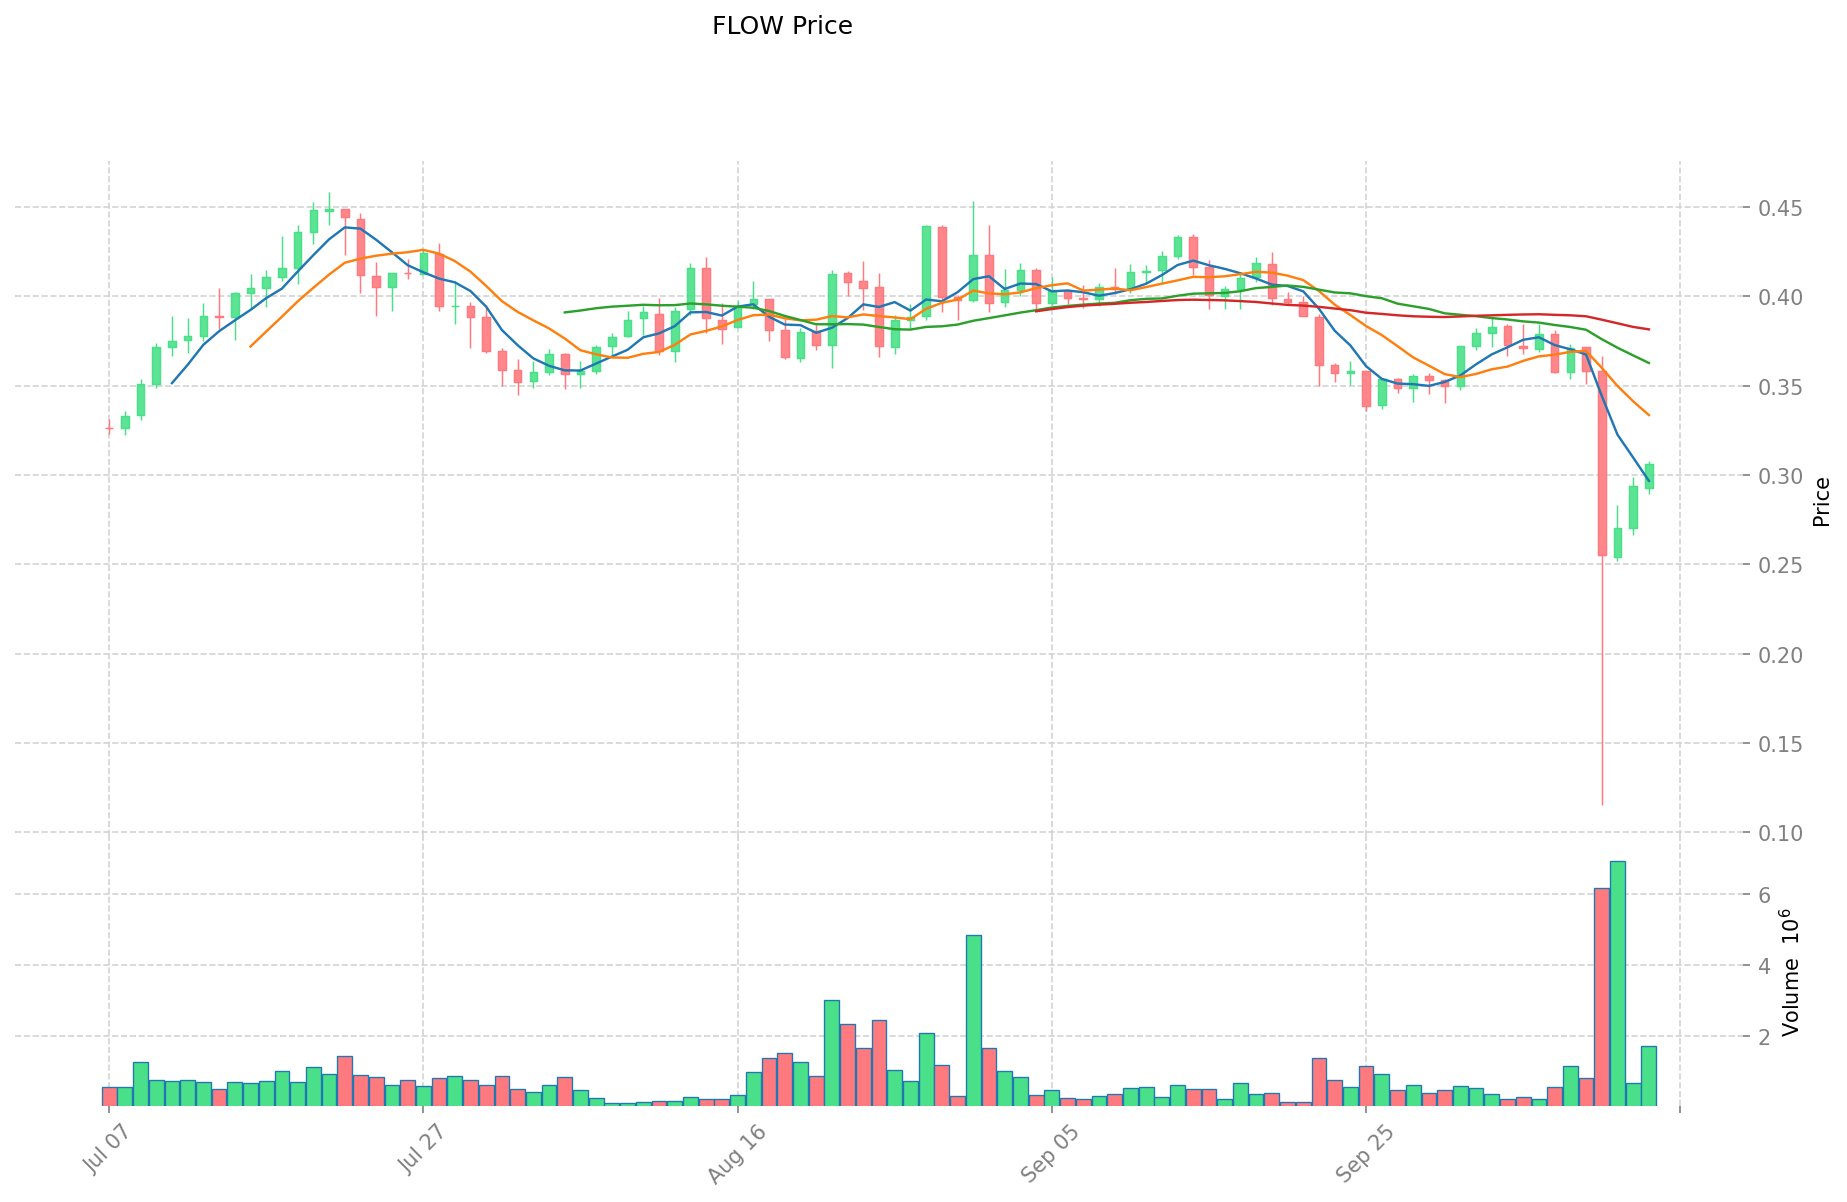
- 2021: FLOW, 5 Nisan 2021’de kripto piyasasındaki genel yükseliş sırasında 42,4 $ ile tüm zamanların en yüksek seviyesini gördü.
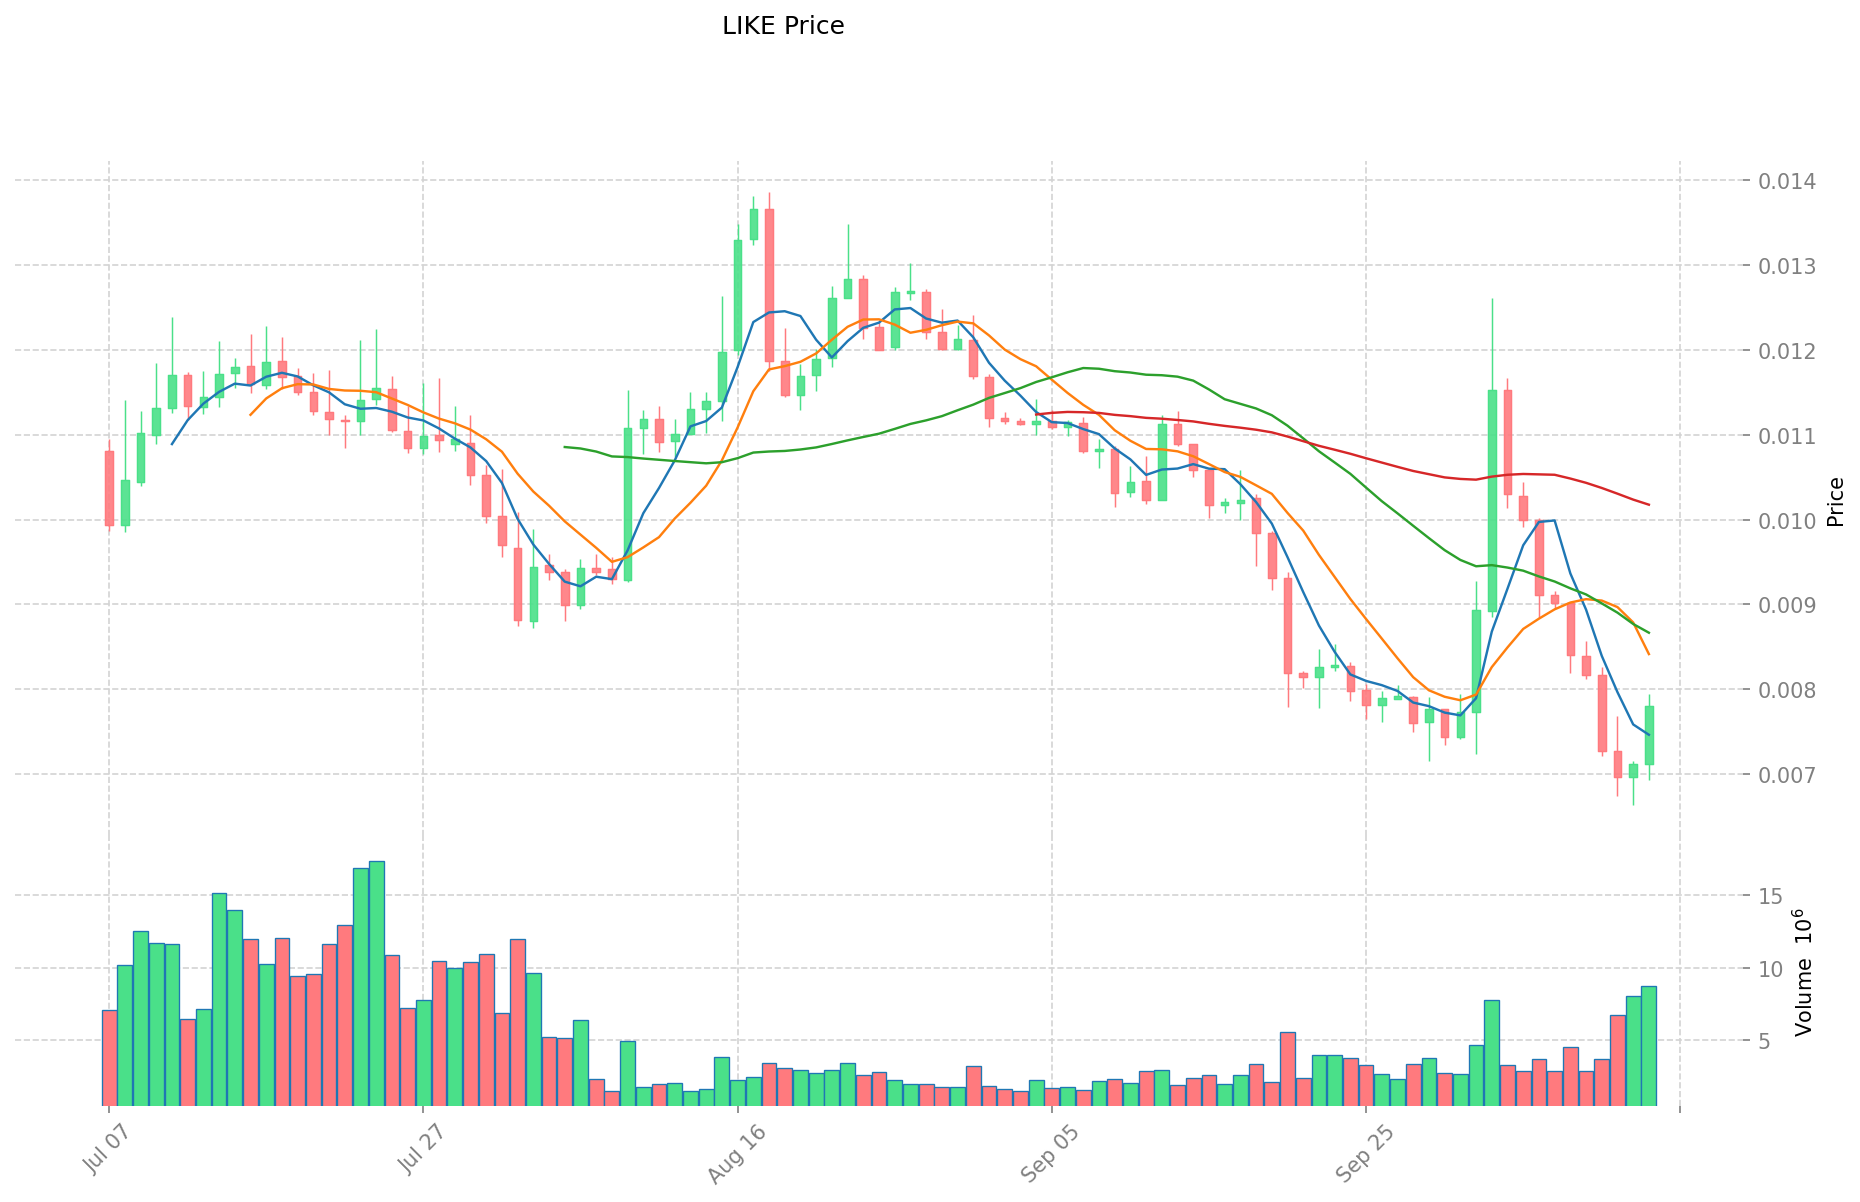
- 2023: LIKE, 6 Ağustos 2023’te piyasa genelindeki düşüşe paralel olarak 0,00133134 $ ile en düşük seviyesine indi.
- Karşılaştırmalı analiz: Zirve fiyatlarından bu yana LIKE, 1,041 $’dan 0,007797 $’a; FLOW ise 42,4 $’dan 0,3057 $’a gerileyerek her ikisi de ciddi düzeltmeler yaşadı.
Güncel Piyasa Durumu (14 Ekim 2025)
- LIKE güncel fiyatı: 0,007797 $
- FLOW güncel fiyatı: 0,3057 $
- 24 saatlik işlem hacmi: 63.192,23 $ (LIKE) - 515.109,93 $ (FLOW)
- Piyasa Duyarlılık Endeksi (Korku & Açgözlülük): 38 (Korku)
Anlık fiyatları görüntülemek için tıklayın:
- LIKE güncel fiyatı için Piyasa Fiyatı
- FLOW güncel fiyatı için Piyasa Fiyatı
II. LIKE ve FLOW’un Yatırım Değerini Etkileyen Temel Faktörler
Arz Mekanizmaları Karşılaştırması (Token Ekonomisi)
- LIKE: 1 milyar sabit arz üst limiti mevcut; dolaşımda 750 milyon token bulunuyor
- FLOW: Maksimum arz 1,25 milyar token; dolaşımda 1,03 milyar token var
- 📌 Tarihsel örnek: Sınırlı arzlı tokenlar (LIKE gibi), piyasa döngülerinde genellikle daha yüksek fiyat oynaklığı gösterirken; FLOW’un kontrollü arzı ise daha dengeli fiyat hareketleri sunmuştur.
Kurumsal Benimsenme ve Piyasa Kullanımı
- Kurumsal varlık: FLOW, Dapper Labs ortaklıkları ve NBA Top Shot entegrasyonu ile kurumsal anlamda daha güçlü destek görüyor
- Kurumsal benimsenme: FLOW, NBA, NFL ve UFC gibi büyük markalarla NFT platformu iş birlikleri sayesinde kurumsal benimsenmede öne çıkıyor
- Düzenleyici yaklaşımlar: Her iki token benzer düzenleyici ortamlarda faaliyet gösterse de, FLOW’un mevcut ortaklıkları ek düzenleyici netlik sağlayabilir
Teknik Geliştirme ve Ekosistem İnşası
- LIKE teknik yenilikleri: LiveArt pazar yeriyle sanat NFT’lerinin entegrasyonu ve yeni token kullanım alanları
- FLOW teknik geliştirmeleri: Konsensüs mekanizmasında güncellemeler ve Cadence programlama dilinin geliştirilmesi
- Ekosistem karşılaştırması: FLOW, yerleşik NFT pazarları, oyunlar ve uygulamalar ile daha gelişmiş bir ekosisteme sahipken; LIKE, sosyal token ve üretici ekonomisi alanında ivme kazanıyor
Makroekonomik Etkenler ve Piyasa Döngüleri
- Enflasyon dönemlerinde performans: Doğrudan karşılaştırma için yeterli geçmiş veri yok
- Makro para politikası: Her iki token, faiz oranı değişimleriyle genel kripto piyasası hareketlerine paralel değişim gösteriyor
- Jeopolitik etkiler: FLOW’un daha yaygın ve küresel ekosistemi, bölgesel düzenleyici sorunlara karşı daha dirençli olabilir
III. 2025-2030 Fiyat Tahmini: LIKE ve FLOW
Kısa Vadeli Tahmin (2025)
- LIKE: Temkinli 0,00717508 $ - 0,007799 $ | İyimser 0,007799 $ - 0,0085789 $
- FLOW: Temkinli 0,220968 $ - 0,3069 $ | İyimser 0,3069 $ - 0,362142 $
Orta Vadeli Tahmin (2027)
- LIKE, büyüme fazına geçebilir; tahmini fiyat aralığı: 0,0059349415125 $ - 0,011504655855 $
- FLOW, boğa piyasasına girebilir; tahmini fiyat aralığı: 0,2962517976 $ - 0,523859886 $
- Temel etkenler: Kurumsal sermaye girişi, ETF, ekosistem büyümesi
Uzun Vadeli Tahmin (2030)
- LIKE: Temel senaryo 0,012075798103446 $ - 0,016181569458617 $ | İyimser senaryo 0,016181569458617 $
- FLOW: Temel senaryo 0,492415873747875 $ - 0,649988953347195 $ | İyimser senaryo 0,649988953347195 $
Feragatname
LIKE:
| Yıl | Tahmini En Yüksek Fiyat | Tahmini Ortalama Fiyat | Tahmini En Düşük Fiyat | Değişim Oranı |
|---|---|---|---|---|
| 2025 | 0,0085789 | 0,007799 | 0,00717508 | 0 |
| 2026 | 0,0100724085 | 0,00818895 | 0,0054865965 | 5 |
| 2027 | 0,011504655855 | 0,00913067925 | 0,0059349415125 | 17 |
| 2028 | 0,0127939077651 | 0,0103176675525 | 0,008254134042 | 32 |
| 2029 | 0,012595808548092 | 0,0115557876588 | 0,006586798965516 | 48 |
| 2030 | 0,016181569458617 | 0,012075798103446 | 0,010505944349998 | 54 |
FLOW:
| Yıl | Tahmini En Yüksek Fiyat | Tahmini Ortalama Fiyat | Tahmini En Düşük Fiyat | Değişim Oranı |
|---|---|---|---|---|
| 2025 | 0,362142 | 0,3069 | 0,220968 | 0 |
| 2026 | 0,38804436 | 0,334521 | 0,17395092 | 9 |
| 2027 | 0,523859886 | 0,36128268 | 0,2962517976 | 18 |
| 2028 | 0,50895697545 | 0,442571283 | 0,30537418527 | 44 |
| 2029 | 0,50906761827075 | 0,475764129225 | 0,37585366208775 | 55 |
| 2030 | 0,649988953347195 | 0,492415873747875 | 0,448098445110566 | 61 |
IV. Yatırım Stratejisi Karşılaştırması: LIKE ve FLOW
Uzun Vadeli ve Kısa Vadeli Yatırım Stratejileri
- LIKE: Sosyal medya platformları ile üretici ekonomisi potansiyeline odaklanan yatırımcılar için uygun
- FLOW: NFT pazarları ve blockchain oyun ekosistemleriyle ilgilenen yatırımcılar için uygun
Risk Yönetimi ve Varlık Dağılımı
- Temkinli yatırımcılar: LIKE %20, FLOW %80
- Agresif yatırımcılar: LIKE %40, FLOW %60
- Korumalı portföy için: Stablecoin tahsisi, opsiyonlar, çapraz para portföyleri
V. Olası Risk Karşılaştırması
Piyasa Riskleri
- LIKE: Daha düşük piyasa değeri ve yeni proje olması nedeniyle daha yüksek oynaklık
- FLOW: NFT pazar talebi ve blockchain oyun trendlerindeki dalgalanmalara maruz kalma riski
Teknik Riskler
- LIKE: Ölçeklenebilirlik ve ağ stabilitesi
- FLOW: Akıllı sözleşme açıkları, yüksek talep dönemlerinde ağ tıkanıklığı
Düzenleyici Riskler
- Küresel düzenleyici politikalar iki token üzerinde farklı etkiler yaratabilir; FLOW, büyük ekosistemi ve iş ortaklıkları nedeniyle daha fazla denetimle karşılaşabilir
VI. Sonuç: Hangisi Daha Mantıklı Bir Alım?
📌 Yatırım Değeri Özeti:
- LIKE avantajları: Sosyal medya ve üretici ekonomisi alanlarında büyüme potansiyeli
- FLOW avantajları: Kurumsal iş ortaklıkları, güçlü NFT ekosistemi ve blockchain oyun odaklı yapı
✅ Yatırım Tavsiyesi:
- Yeni başlayanlar için: Kripto portföyünüzde FLOW’u daha düşük oranla değerlendirin
- Deneyimli yatırımcılar için: Her iki varlığı risk toleransınıza ve ekosistemlere olan güveninize göre analiz edin
- Kurumsal yatırımcılar için: FLOW, kurulu iş ortaklıkları ve geniş piyasa hacmiyle daha cazip görünebilir
⚠️ Risk Uyarısı: Kripto para piyasası yüksek oynaklığa sahiptir, bu içerik yatırım tavsiyesi değildir. None
SSS
S1: LIKE ile FLOW arasındaki başlıca farklar nelerdir? C: LIKE, sosyal medya platformları ve üretici ekonomisine odaklanırken; FLOW, NFT pazarları ve blockchain oyunlarına yöneliktir. FLOW daha büyük piyasa değeri, köklü iş ortaklıkları ve güçlü ekosistem avantajına sahipken; LIKE, kendi nişinde büyüme potansiyeli barındıran yeni bir projedir.
S2: Geçmişte hangi token daha iyi performans gösterdi? C: FLOW, Nisan 2021’de 42,4 $ ile daha iyi bir tarihi performans sergilemiştir. Ancak iki token da zirve sonrası ciddi düzeltmeler yaşadı; şu anda LIKE 0,007797 $, FLOW ise 0,3057 $ seviyesindedir.
S3: LIKE ve FLOW’un arz mekanizmaları nasıl karşılaştırılır? C: LIKE, 1 milyar sabit arz üst limiti ve 750 milyon dolaşımdaki tokene sahip. FLOW’un maksimum arzı 1,25 milyar ve dolaşımda 1,03 milyar token bulunuyor. LIKE’ın sınırlı arzı genellikle daha yüksek fiyat oynaklığına yol açarken; FLOW’un kontrollü arzı daha dengeli fiyat hareketleri sağlıyor.
S4: Bu tokenlarda yatırım değerini etkileyen temel faktörler nelerdir? C: Temel etkenler; arz mekanizmaları, kurumsal benimsenme, teknik gelişim, ekosistem inşası ve makroekonomik parametrelerdir. FLOW, kurumsal destek ve benimsenmede önde; LIKE ise sosyal token ve üretici ekonomisi alanında ivme kazanıyor.
S5: 2030 için LIKE ve FLOW fiyat tahminleri nedir? C: LIKE için temel senaryo 0,012075798103446 $ - 0,016181569458617 $ aralığında; FLOW için ise 0,492415873747875 $ - 0,649988953347195 $ bandında öngörülmektedir. Bunlar uzun vadeli tahminler olup dikkatle değerlendirilmelidir.
S6: Yatırımcılar LIKE ve FLOW’a yatırımda risk yönetimini nasıl ele almalı? C: Temkinli yatırımcılar portföylerinde %20 LIKE, %80 FLOW ayırabilir; agresif yatırımcılar ise %40 LIKE, %60 FLOW tercih edebilir. Stablecoin tahsisi, opsiyonlar ve çapraz para portföyleri gibi koruma araçları ile risk yönetimi yapılmalıdır.
S7: LIKE ve FLOW yatırımlarında karşılaşılabilecek olası riskler nelerdir? C: Her iki token piyasa, teknik ve düzenleyici risklerle karşı karşıya. LIKE, küçük piyasa değeri ve yeni olması nedeniyle daha yüksek oynaklık gösterir. FLOW ise NFT talebi ve blockchain oyun trendlerindeki dalgalanmalara maruz kalır. Her ikisi de düzenleyici denetim riski taşır; FLOW, büyük ekosistemi ve ortaklıkları nedeniyle daha fazla incelemeye tabi olabilir.
Share
Content
Giriş: LIKE ve FLOW Yatırımı Karşılaştırması
I. Fiyat Geçmişi Karşılaştırması ve Güncel Piyasa Durumu
II. LIKE ve FLOW’un Yatırım Değerini Etkileyen Temel Faktörler
III. 2025-2030 Fiyat Tahmini: LIKE ve FLOW
IV. Yatırım Stratejisi Karşılaştırması: LIKE ve FLOW
V. Olası Risk Karşılaştırması
VI. Sonuç: Hangisi Daha Mantıklı Bir Alım?
SSS
How to Buy Cryptocurrency


Trending Cryptocurrencies


Metan Chain (METAN) iyi bir yatırım mı?: Bu yükselen kripto paranın potansiyelini ve risklerini değerlendiriyoruz

Babylons (BABI) iyi bir yatırım mı?: Bu Yükselen Kripto Varlığın Potansiyeli ve Risklerinin Analizi
Flow (FLOW) iyi bir yatırım mı?: Akıllı sözleşmelere yönelik bu blockchain platformunun potansiyeli ve risklerinin analizi

SFUND ve DOT: Blockchain Ekosisteminde Yatırım Fırsatlarının Karşılaştırılması

2025 GAMESTARTER Fiyat Tahmini: Oyun Tokeni'nin Piyasa Trendleri ve Büyüme Potansiyelinin Analizi
FEAR ve DOT: Belirsizlik Dönemlerinde Duygusal ve Mantıksal Karar Verme Sürecinde Yön Bulmak
ENS Alan Adları ile Web3 Kimlik Yönetimi
Farcaster Protokolünü Keşfetmek: Kripto Ağlarında Yeni Bir Dönem
ETH Dağıtımlarına Güvenli Şekilde Katılmak: Temel İpuçları
Curve Protokolü Hakkında Bilgi: Merkeziyetsiz Platformlarda Stablecoin Ticaretinin İncelenmesi

Kripto Para White Paper'larını Anlamak: Yatırımcılar İçin Kapsamlı Bir Rehber